


 text new page (beta)
 English (pdf)
 Article in xml format
 Article references
 Send this article by e-mail
 Cited by SciELO
  Similars in
SciELO
Similars in
SciELO 
 Permalink
Health is defined as the equality of rights of the functions,
wet-dry, cold-hot, bitter-sweet and the rest;
but single rule of either pair is deleterious.
Thus, inequality of power leads to tyranny in
a political system and disease in the body.
Greek physician/philosopher Alcmaon of Croton (500 BCE)
Excerpt from G. E. Billman (2013)
Introduction
It can be argued that many - if not most - of the contemporary world problems are related to the resilience of complex dynamical systems: we are worried about global warming, the globalization of economic markets, the increasing international coupling of electrical power grids, the degradation of the environment, world population ageing etc., and we would like to predict (and hopefully prevent!) irreversible climate change, global financial crises, massive power blackouts, mass species extinctions and the ever increasing prevalence of chronic-degenerative disease (Zolli and Healy 2013). All of the above systems are examples of complex systems, consisting of many interconnected components, and where typically new systemic properties emerge that are not contained in the local interactions between the individual components (Erdi 2008; Fossion & Zapata-Fonseca 2015 y 2018). To study these collective properties, complexity sciences have developed a toolkit containing network analysis, data mining, and time-series analysis and other techniques. One specific example of a collective property is resilience, which is not so easy to understand and even more difficult to quantify; it is the antonym of fragility, and it can loosely be understood as the combination of robustness and adaptability to withstand and/or adjust to perturbations from the external environment (Scheffer 2009; Zolli and Healy 2013).
Human physiology, or the dynamics of human health, is a good example of a complex system (Cocho 2015). In the last few years, medical specialists have also come to the conclusion that the global health state of the human body, or its degeneration, is a systemic property and that some frailty index is needed that integrates functional, epidemiological, emotional, cognitive and social aspects, which is not an easy task (Rockwood et al. 2005; Fried et al. 2009; Fossion 2010). Claude Bernard, a French physiologist (1813-1878), noted the remarkable stability of the human body where certain parameters of the internal environment such as core temperature, blood pressure and body water volume are maintained constant and independent from variations in the outside environment (Bernard, 1878). The American physiologist Walter Cannon (1871-1945) identified specialized regulating mechanisms in the human body that react to and correct for interior and exterior perturbations and coined the term homeostasis (from the Greek words óμοιος “similar” and στάσις “standing still” to mean together “staying similar”) (Cannon 1932). The Jewish-American mathematician Norbert Wiener (1894-1964), the Mexican physiologist Arturo Rosenblueth (1900-1970) and collaborators developed the field of cybernetics (from κυβερνήτης “governor”), the mathematical theory of regulating and communication mechanisms in animals and in machines (Wiener, 1961), which was later incorporated into the field of control theory (Tewari 2002; Åström and Murray 2008; Erdi 2008). Homeostasis is part of Darwinian evolution, does already play a role in unicellular lifeforms such as bacteria, and has become increasingly more complex since these single cells clustered together to form multicellular organisms. Individual cells floating in the ocean have direct access to nutritional substances that are more or less homogeneously dissolved into the water. In contrast, specialized cells inside of multicellular organisms need distributing and controlling mechanisms to provide nutrients and to carry waste products away; these homeostatic mechanisms create a constant internal environment that is reminiscent of the primordial ocean and create an independence from the outside environment allowing the organism to colonize new habitats (Schulte, Kunter and Moeller 2015).
When technological advances first allowed to monitor physiological variables in a continuous way, it came as a surprise that most - if not all - of these variables are always fluctuating, even when the monitored subject is in a resting condition, and it is generally accepted that the statistics of these fluctuations in some way reflects the dynamics of the underlying regulating processes, although it is not always clear whether these mechanisms are homeostatic or chaotic (Goldberger 1991; Goldberger et al. 2002). In some cases, a large variability is interpreted as a signature of good health, such as in the case of heart rate variability (Malik et al. 1996), whereas in other cases it has been found to represent a risk factor, such as in the case of blood pressure variability (Parati et al. 2013). In literature, at least two different frameworks have been proposed to explain the phenomenology of the fluctuations of time series of complex dynamical systems: (i) the loss of complexity hypothesis of Lipsitz & Goldberger (1992) which proposes that complex correlations and variability are characteristics of health which are increasingly lost with ageing and disease, and (ii) the paradigm of early-warning signals which suggests that an increase in the variability and correlations of the time series might indicate an impending collapse of the dynamical system (Scheffer 2009), and both hypotheses appear to contradict each other. The objective of the present contribution is to explain homeostasis from the point of view of physiological time series, and - inspired by control theory - to offer an intuitive explanation for the phenomenology of the variability of time series.
Non-invasive continuous physiological monitoring: time series, distributions and dynamics
Physiological variables may exhibit very distinct statistics, depending on the specific variable that is being measured and whether the statistics is studied over a group of individuals or over time in a single individual. Group-averaged biological or medical measures of individuals, such as weight, height, cerebral volume, cholesterol levels, blood pressure, pulmonary capacity, intellectual quotient, depression levels and personality traits, tend to behave as a normal (Gaussian) distribution,
and the 2 parameters of mean μ and standard deviation σ are sufficient to characterize the distribution. Like the normal distribution, exponential functions,
decay rapidly and restrict the variable x to a single specific scale around the average of the distribution. Additional parameters such as skewness and kurtosis have been introduced to describe deviations from the normal distribution (Lane 2013; Fossion et al. 2013). Other variables, however, have distributions with long/heavy tails that may span various orders of magnitude such that single- scale parameters such as the above are not meaningful to describe the distribution, and the data may behave in a fractal way (Liebovitch, Scheurle 2000). One example of a heavy-tailed distribution is the lognormal distribution as in the case of the incubation time of infectious diseases; here, log-transformed variables can be studied, which by definition behave Gaussian (Limpert, Stahel and Abbt 2001)., i.e.,
Another example of a heavy-tailed distribution are power laws,
such as the time evolution of acidity of the oesophagus or the stomach in individual subjects (Gardner et al. 2004). A visual way to distinguish between these different distributions is by plotting the data in different scales (Figure 1). Both exponential functions and power laws appear as curves in a linear-linear scale. Exponential functions behave linearly when represented in a linear-logarithmic scale, i.e., log[P(x)] ∝-λ x. Power laws behave linearly in a double-logarithmic scale, i.e., log[P(x)] ∝-β log(x). Typical for normal or exponential distributions is their rapid decay, such that they are restricted to a single scale and the average and the standard deviation are representative for the whole distribution, whereas heavy-tailed distributions such as log-normals or power laws decay more slowly, may span various scales, and there is no single characteristic value for the distribution.
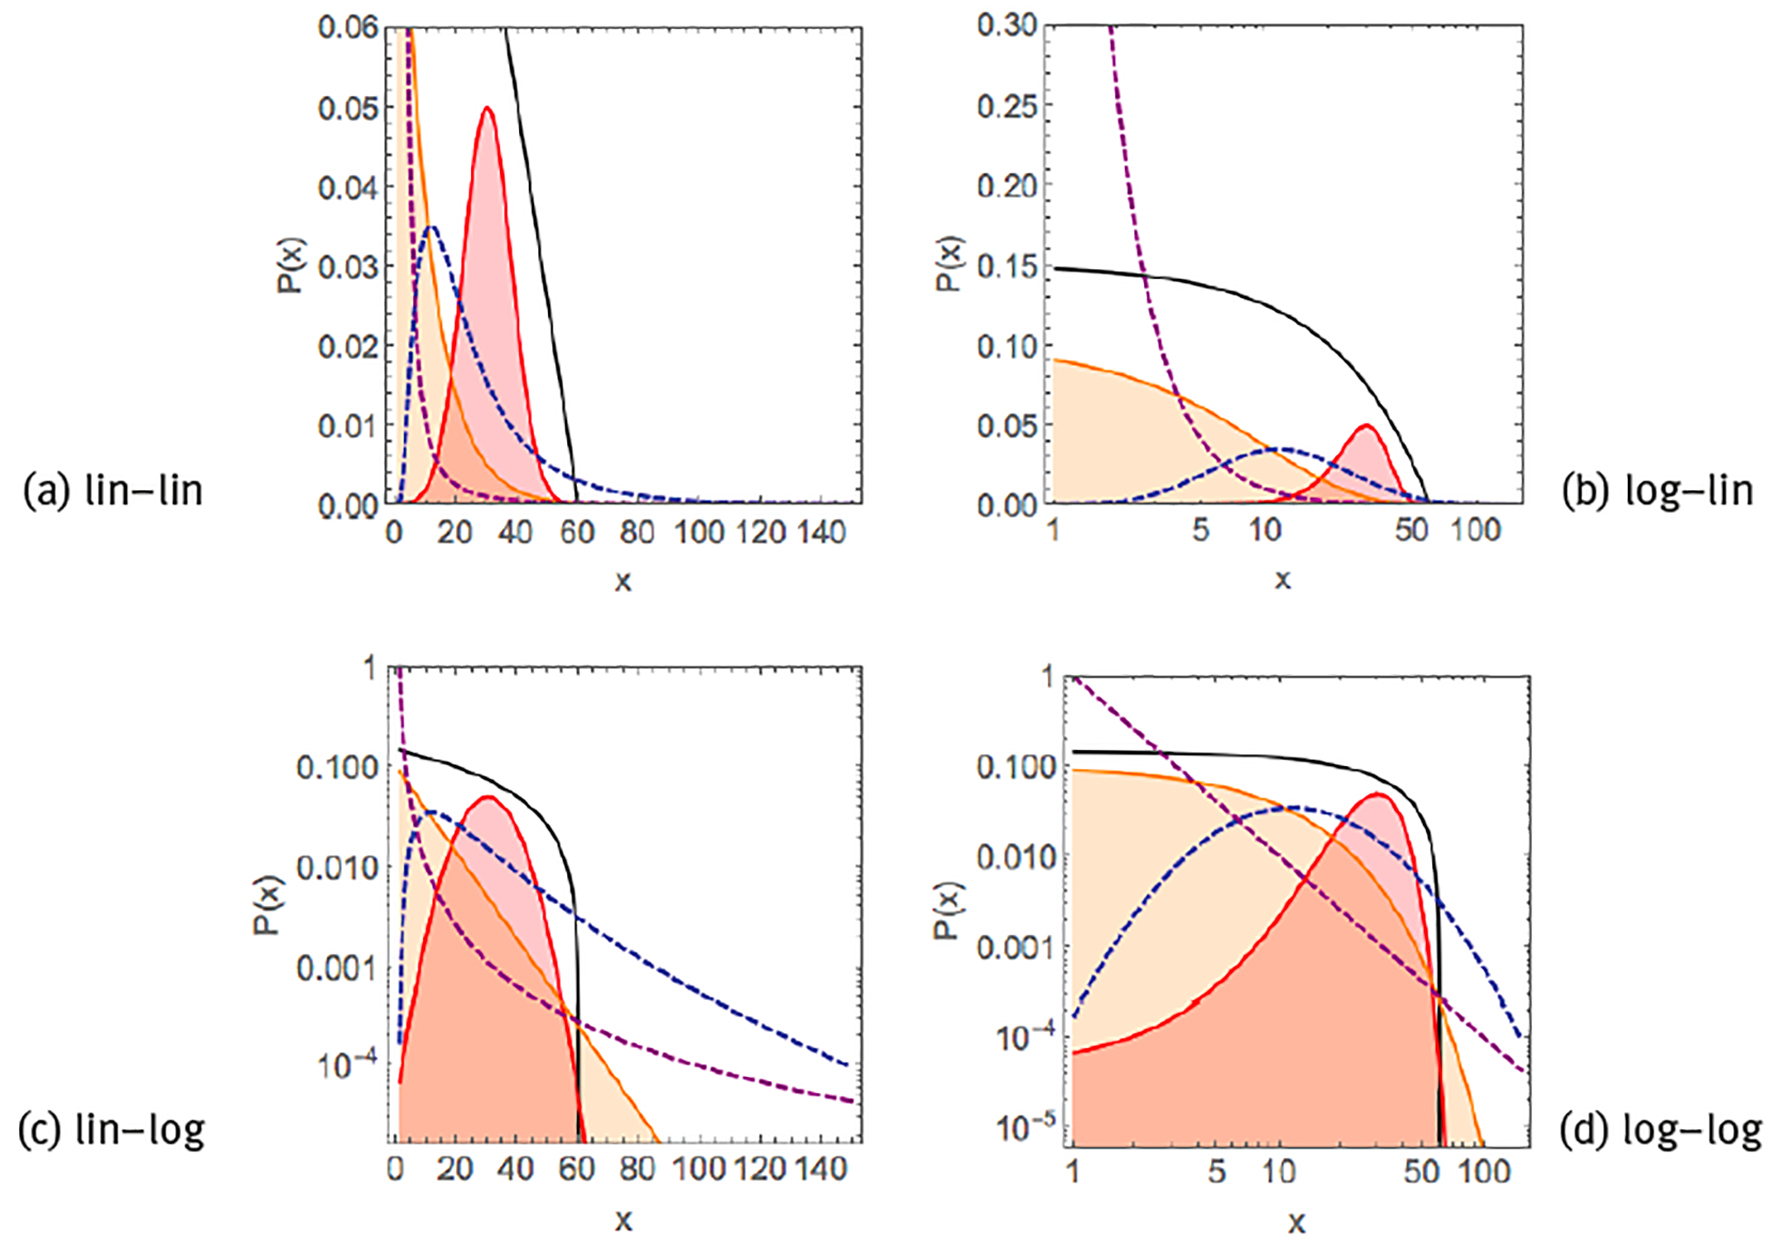
Note: Linear exponential P(x) ∝ (black curve), Gaussian/normal P(x) ∝ exp[-(x-µ1)2]/
Source: Created by the authors based on Kello et al. (2010).
Figure 1 Examples of common probability distribution functions.
In the present contribution, we are interested in the statistical properties of data of the non-invasive continuous monitoring of physiological variables, i.e., time series, which are thought to reflect the dynamics of the underlying regulating mechanisms (Goldberger 1991; Goldberger et al. 2002). Measurement devices capable of continuous physiological monitoring are becoming ubiquitous, not only in the specialized medical world (Figure 2), but also in the consumer market with a wide variety of fitness trackers, smartphones, smartwatches and dedicated applets for data collection, analysis and visualization (see panels (a) and (b) of Figure 3), and allow to monitor a wide variety of physiological variables, such as, e.g., blood oxygen saturation (SpO2) (Chaudhary et al. 1998), blood glucose (Churruca et al. 2008), gastro-oesophageal acidity (Gardner et al. 2005), brain signals (Garrett et al. 2013), gait (Hausdorff 2005), heart rate (Malik et al. 1996), blood pressure (Parati et al. 2013), breathing (Papaioannou, Pneumatikos 2012), skin temperature (Varela et al. 2005; Fossion et al. 2017a), core body temperature (Kelly, 2006a y 2006b), electrodermal activity (Visnovcova et al. 2016), equilibrium and balance function (Yamagata et al. 2017) and physical activity (actigraphy) (Ivanov et al. 2007; Hu et al. 2009a y 2009b; Fossion et al. 2017b).
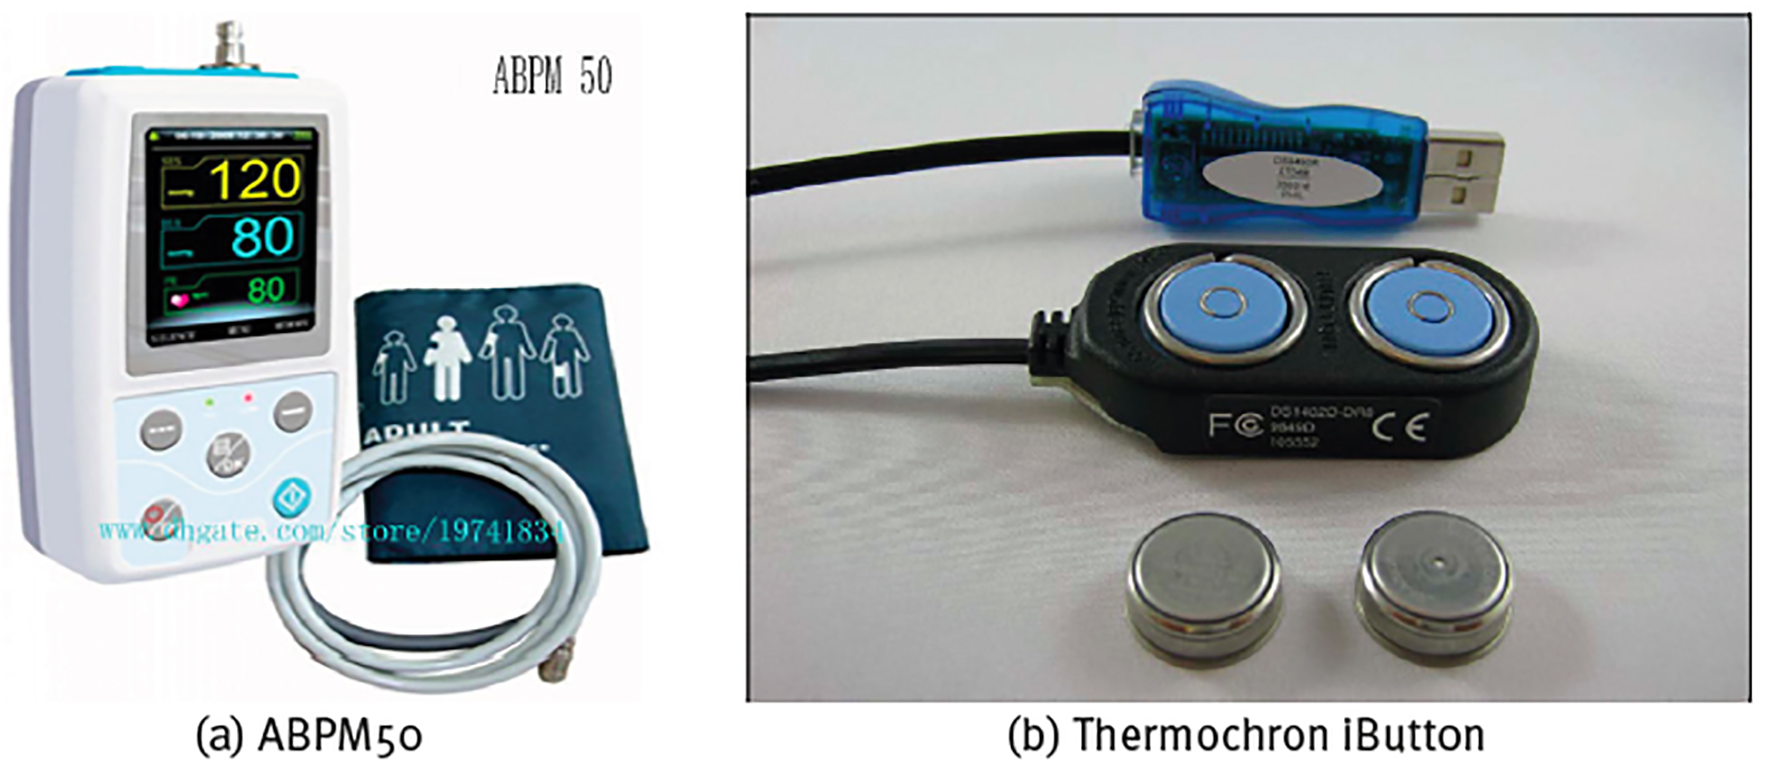
Note: (a) ambulatory blood pressure monitoring device CONTEC ABPM50, (b) continuous temperature monitoring device Maxim Thermochron iButton DS1922L (“Thermochron8k”).
Source: Reproduced from the commercial webpages of (a) CONTEC Medical Systems Co. Ltd. (http://www.contecmed.com) and (b) Maxim Integrated (https://www.maximintegrated.com/en.html).
Figure 2 Specialized monitoring equipment.
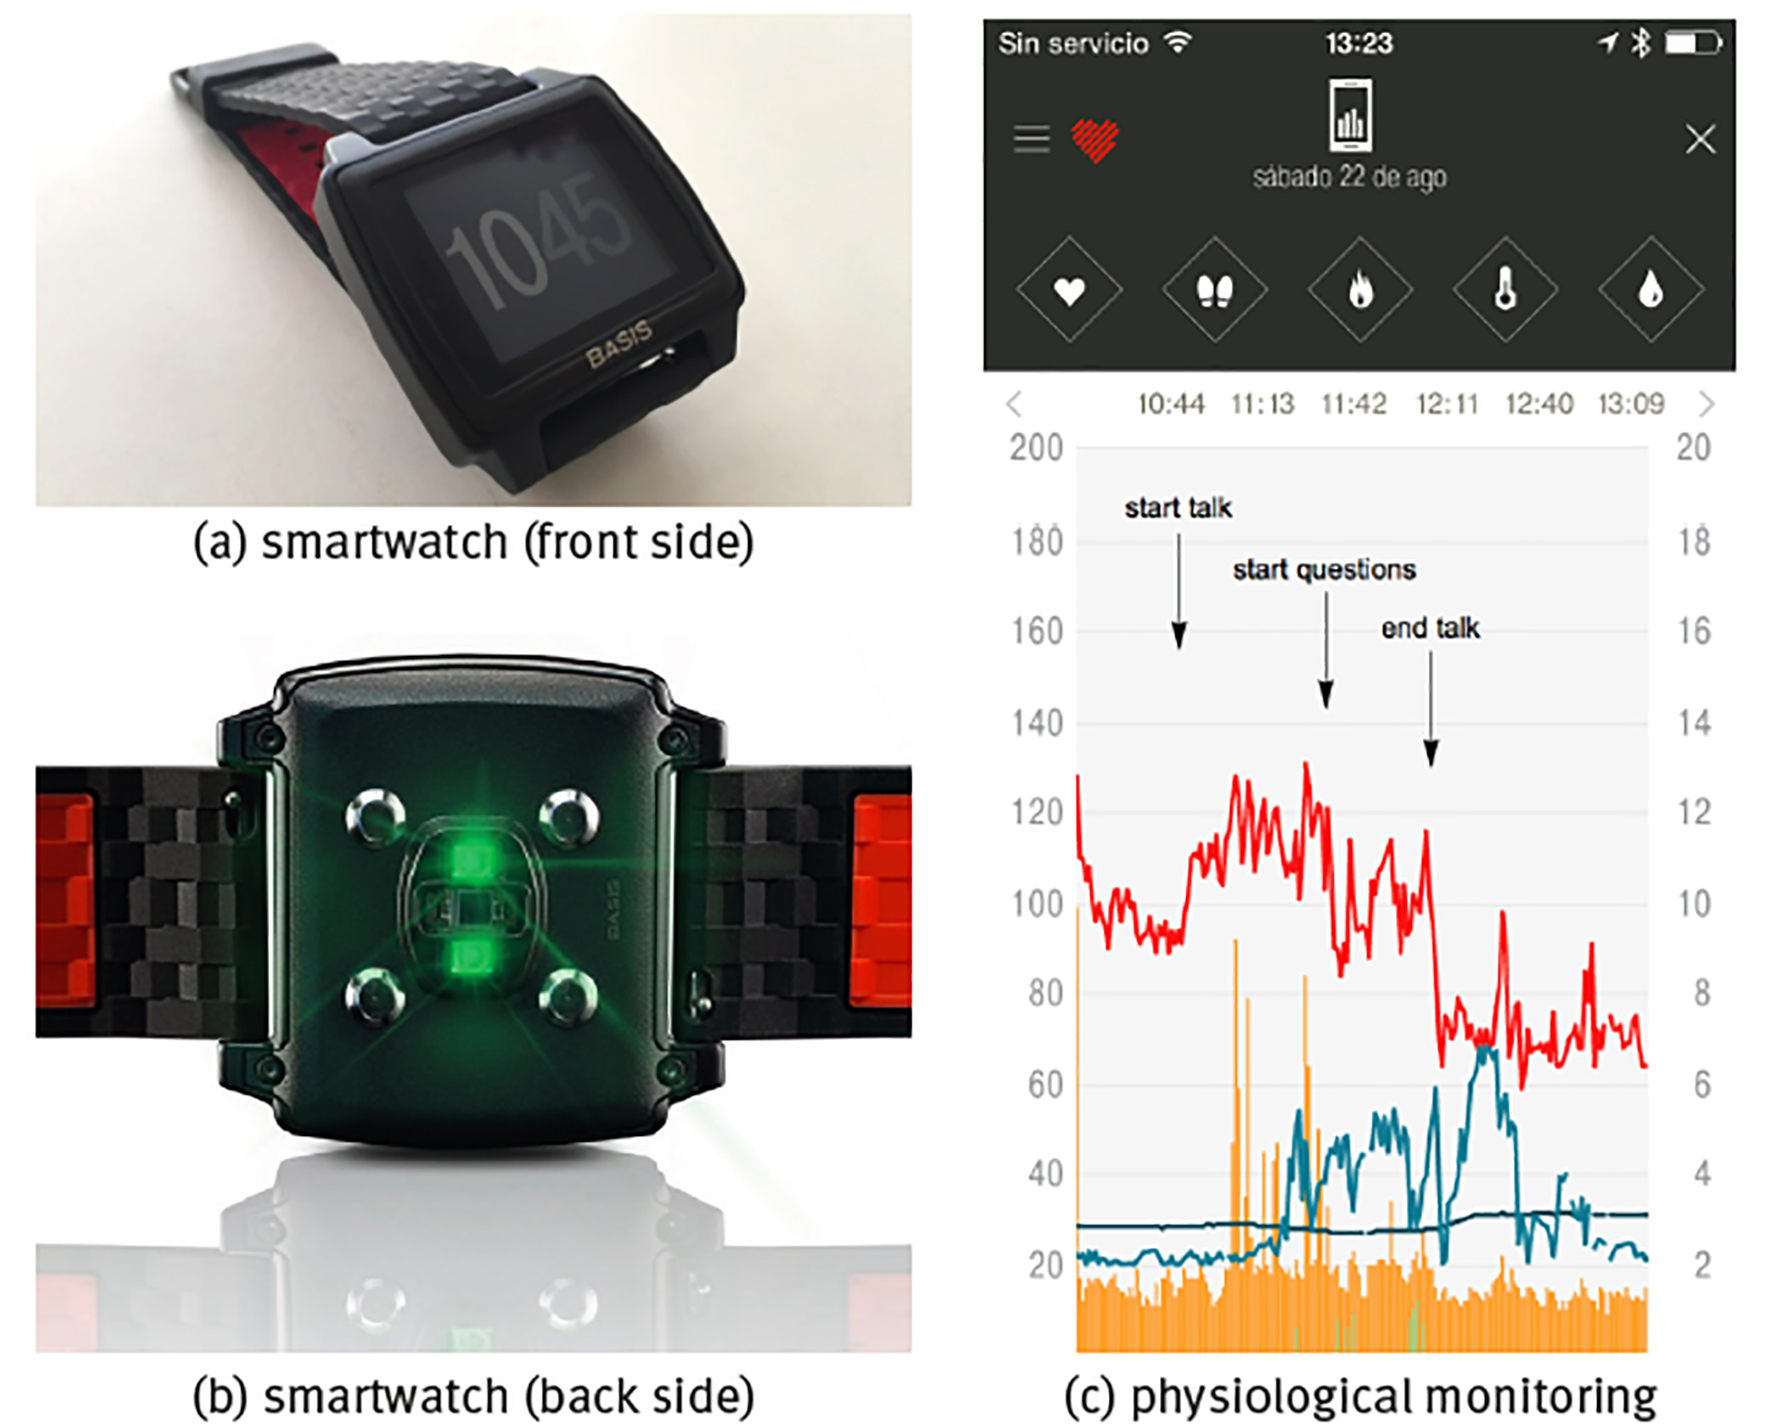
Note: Shown are (a) front side of the watch with the time display, (b) back side of watch with the sensors, (c) continuous monitoring of a healthy young adult during the stressful event of giving a talk in public with physiological time series of heart rate (units bpm, red curve), skin temperature T (units in °C, dark blue curve), sweating (units gsr, light grey-blue curve), walking step rate (units in steps/min, green curve) and total (rest+active) calorie burning rate (kCal/min, orange curve), sample rate is f = 1/min.
Source: (a, b) Reproduced from the commercial webpage of BASIS Peak that was sadly discontinued by the end of December 2016; (c) created by the authors.
Figure 3 Commercial smartwatch BASIS Peak.
The most obvious way to evaluate physiological time series is in response to particular conditions or stimuli. Panel (c) of Figure 3 shows the example of the stressful event of giving a talk in public during a congress. Heart rate in rest in a healthy young adult, either lying supine or sitting, should be in the range 60100 beats per minute (bpm); heart rate <60 bpm is called bradycardia and the blood circulation is not sufficient to carry about nutrients through the whole body; heart rate >100 bpm in rest is called tachycardia and can be dangerous if chronic, on the other hand, a temporal rise in heart rate because of acute stress is part of the normal physiological response. Here, it can be seen that already before the beginning of the talk heart rate was high and close to tachycardia in nervous anticipation; heart rate rose with +20 bpm immediately at the start of the talk, relaxed for a moment with -30 bpm at the end of the talk but rose again with +20 bmp at the start of the questions, and relaxed with the large amount of -60 bpm immediately after both talk and questions had finished and the subject could take his seat again off stage. Sweating is also part of the stress response, but in the present case it is delayed with respect to the heart rate response, starting when the talk was already halfway and only diminishing after the talk had already ended; there is also a certain correlation with skin temperature, where stress induces lower temperatures and relaxation is associated to higher temperatures (because of vasoconstriction and vasodilatation, respectively, see forward example 2: Body temperature homeostasis).
When monitoring is realized over various hours or even successive days, it may not be possible to correlate the behaviour of each specific detail of the time series with a particular event. On the other hand, the statistics of the time series should reflect the physiological responses to the stimuli received during the monitoring period, and specialized techniques from time-series analysis can be applied to quantify many different aspects of the statistics. Figure 4 shows the continuous monitoring of heart rate, skin temperature, sweating and step rate over 3 different time spans. At the time scale of 24 hours, see panel (a), there is an obvious difference between day and night, where during the day heart rate is higher (because of physical activity) and skin temperature tends to be lower (because of vasoconstriction), whereas during the night heart rate is lower (because of rest) and skin temperature tends to be higher (because of vasodilatation). Apart from these overall features, all variables show rapid fluctuations that reflect physiological responses to many different stimuli. The behaviour is not regular or predictable, and there are correlations in the time series that in principle may be used to quantify the health state of the corresponding physiological mechanism. At the time scale of 2 weeks, see panel (b), heart rate and step rate show the physiological response to the periodic alternation of day and night, called a circadian cycle; this periodicity is also present in skin temperature, although somewhat less clearly, but does not appear to be present in the sweating time series. At the time scale of 1 year, see panel (c), all patterns seem to be lost, and the time series of all variables appears to be featureless white noise (i.e., a random time series without correlations).
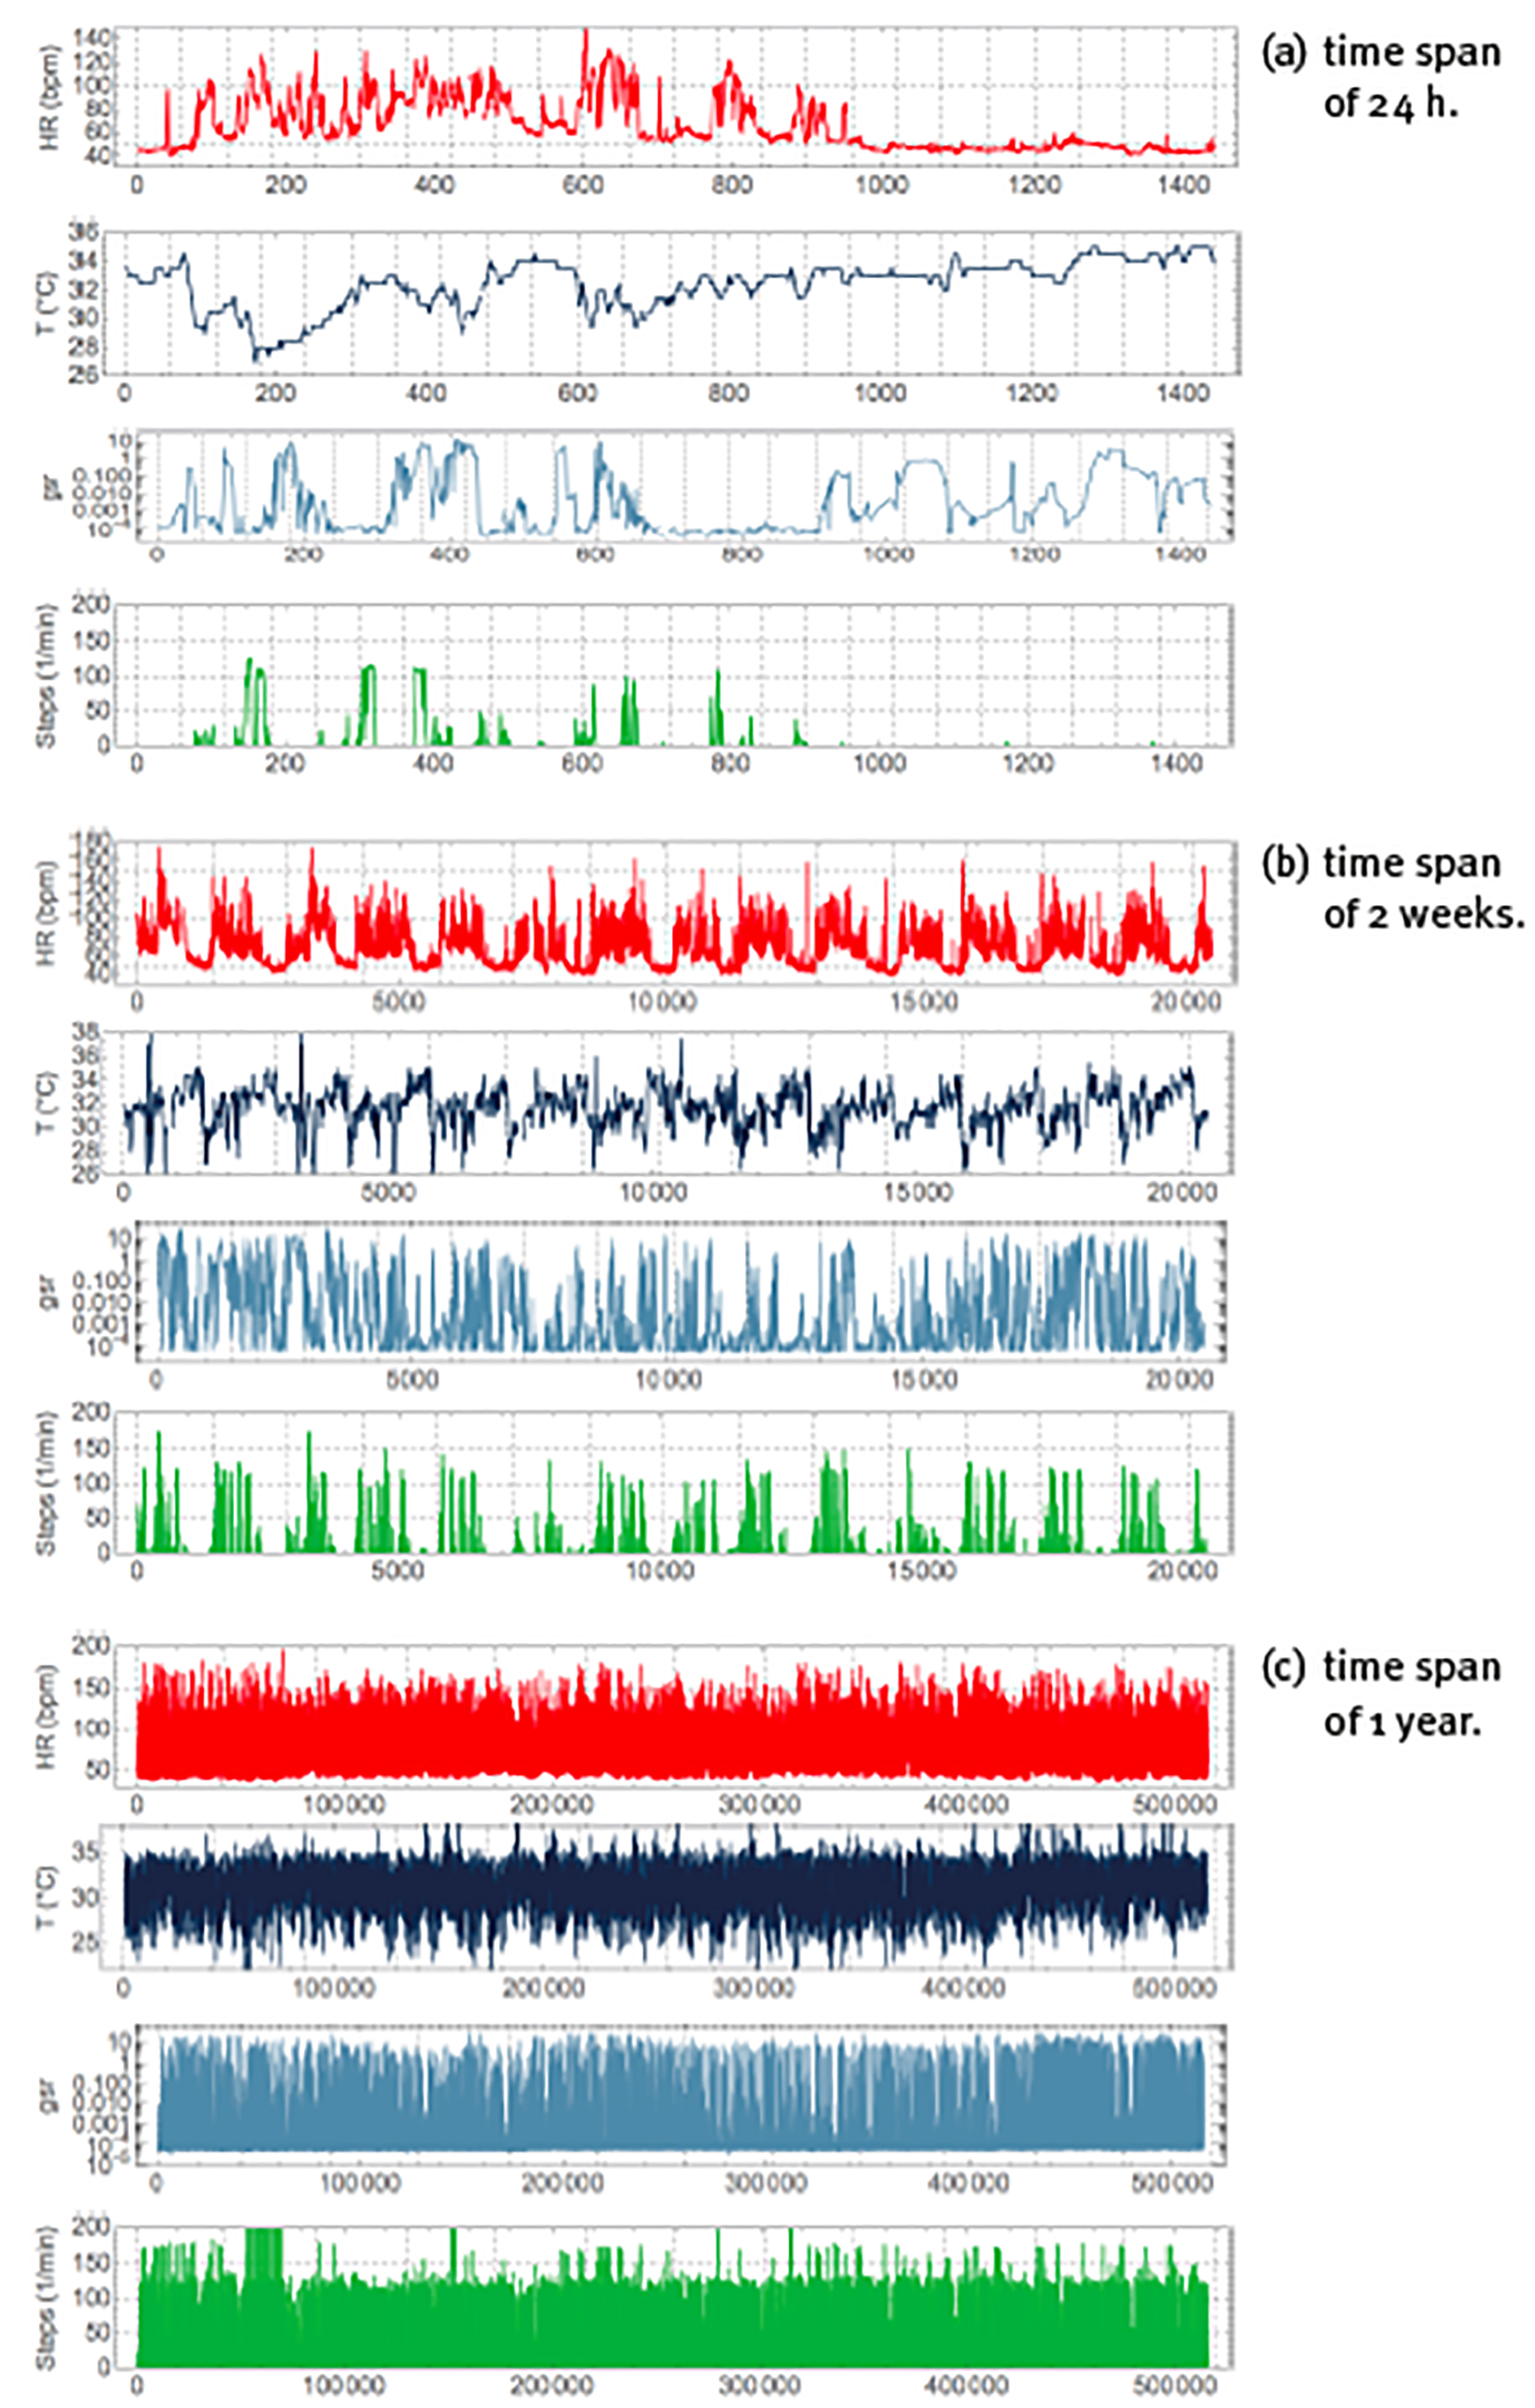
Note: Peak of periods of (a) 24h (with vertical gridlines at 1h intervals), (b) 2 weeks (with vertical gridlines at 24h intervals), (c) 1 year (with vertical gridlines at 1 month intervals). Units, colours, variables and sample rate as explained in Figure 3.
Source: Created by the authors.
Figure 4 Non-invasive and continuous physiological monitoring by the commercial smartwatch BASIS Peak for periods.
Figure 5 shows a Fourier spectral analysis of 1 year of the heart rate data of Figure 4(c), where the whole time series is decomposed as the sum of periodic components with different frequencies f and where according to the Parsival theorem,
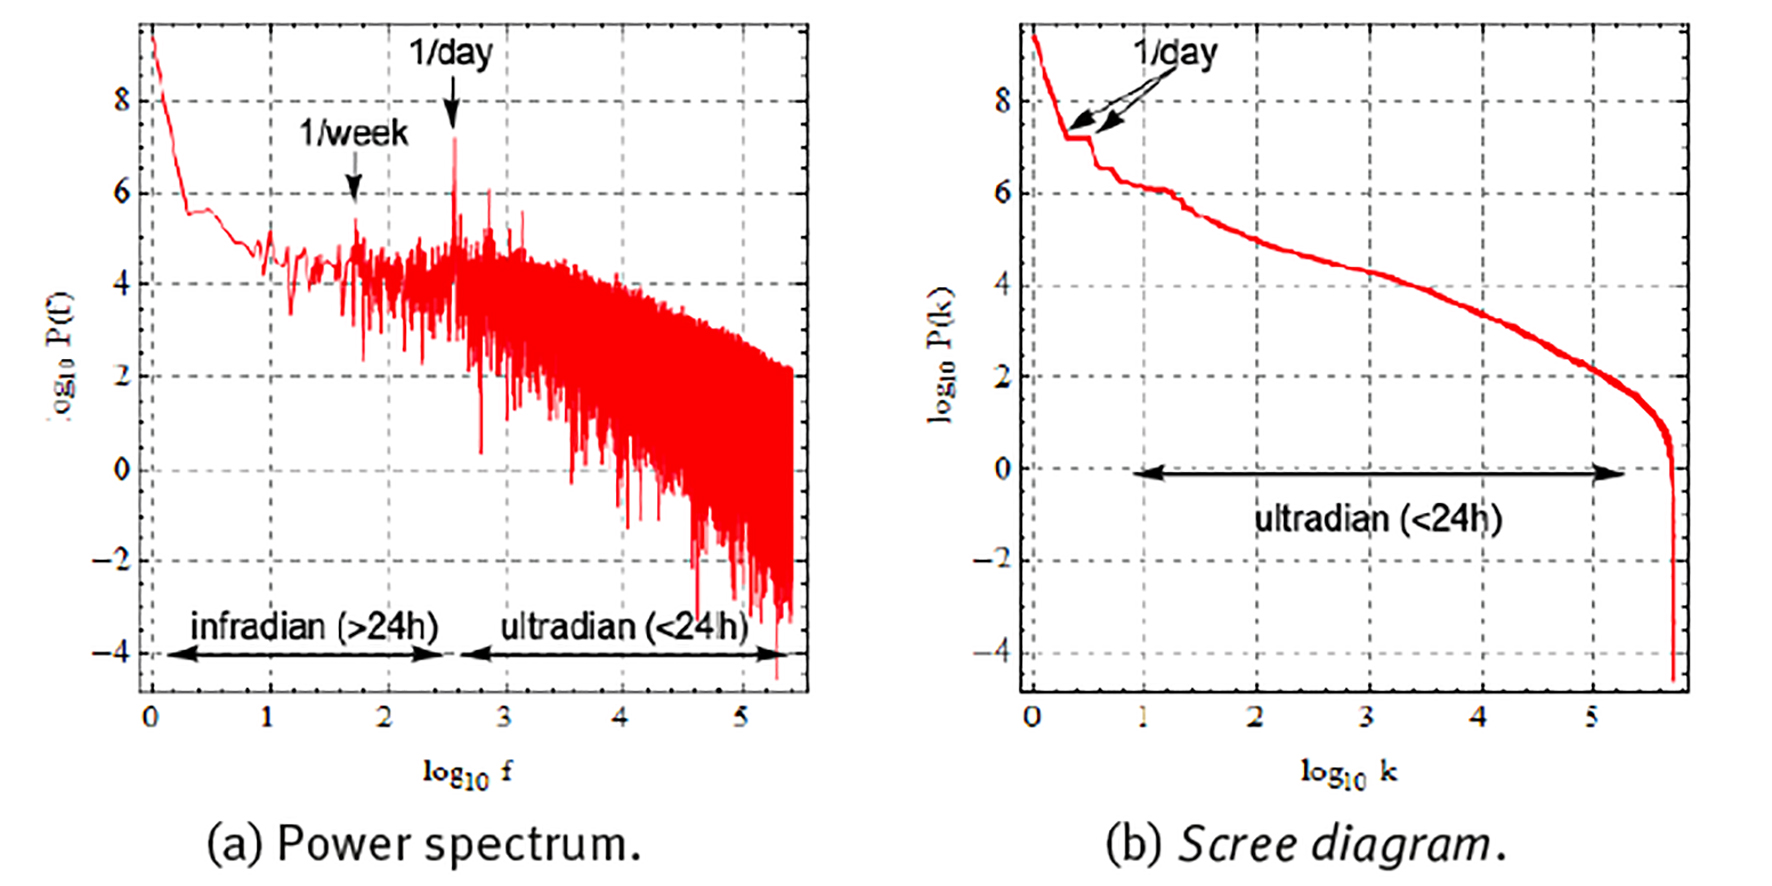
Note: Represented as (a) power spectrum with components ordered according to frequency, and (b) scree diagram with components ordered according to magnitude. Frequency in units of number of oscillations during the whole time series.
Source: Created by the authors.
Figure 5 Fourier spectral analysis of the 1-year heart rate (HR) time series of Figure 4 (c) .
each component with frequency f is responsible for a partial variance P(f) of the total variance σ 2 of the original time series (Zapata-Fonseca et al. 2016; Fossion et al. 2017b). Spectral analysis is one way to quantify several of the aspects of the time series that we observed using visual inspection in the previous paragraph. Panel (a) shows the Fourier power spectrum, where the components have been ordered according to frequency f and the power spectrum is represented in double logarithmic scale. There is a dominant peak at f = 1/day (and higher harmonics f = 2/day, 4/day, etc.), at least 2 orders of magnitude larger whatever other component of the power spectrum, and it corresponds to the circadian rhythm. There is another, but less dominant, peak at f = 1/week, corresponding to the periodic rhythm of the week-weekend cycle. There appear to be 2 different scaling regions, one at infradian scales, 1/year < f < 1/day, which behaves as a power law P(f) ∝ 1/f β with β = 0, and is suggestive of white noise, and another scaling region at ultradian scales, f > 1/day, which behaves as a power law with β = 1, and might indicate random but complex correlations (1/f noise). Fourier power spectra of experimental time series can be quite noisy and it might not be straightforward to realize a linear fit in log-log scale to extract the power-law exponent β. A useful alternative is to represent the results of the spectral analysis in a so-called scree diagram or Zipf plot P(k), see panel (b), where the components are ordered according to magnitude, and the graph is usually represented in double logarithmic scale. Here also, the dominant components to the left- hand side tend to correspond to large time scales (small frequencies), and the less dominant components to the right-hand side tend to correspond to small time scales (high frequencies). The “steps” at the dominant side of the scree diagram indicate periodicities; at least 2 steps are visible, the first one corresponds to the circadian cycle and the second one to a higher harmonic. The linear parts of the scree diagram in log-log scale correspond to power laws, with similar behaviour as in the power spectrum representation, but now with less dispersion.
Let us now compare the statistics of different physiological variables. Figure 6 (a) compares the Fourier scree diagrams for heart rate, skin temperature, sweating and steps. The steeper slope of the scree diagrams of heart rate and skin temperature suggests the presence of strong correlations, whereas the almost flat behaviour of the scree diagrams of steps and sweating is suggestive of an almost absence of correlations at most time scales. Figure 6 (b) shows the probability distribution of the fluctuations X’ of time series X around its average μ and expressed as a percentage of μ,
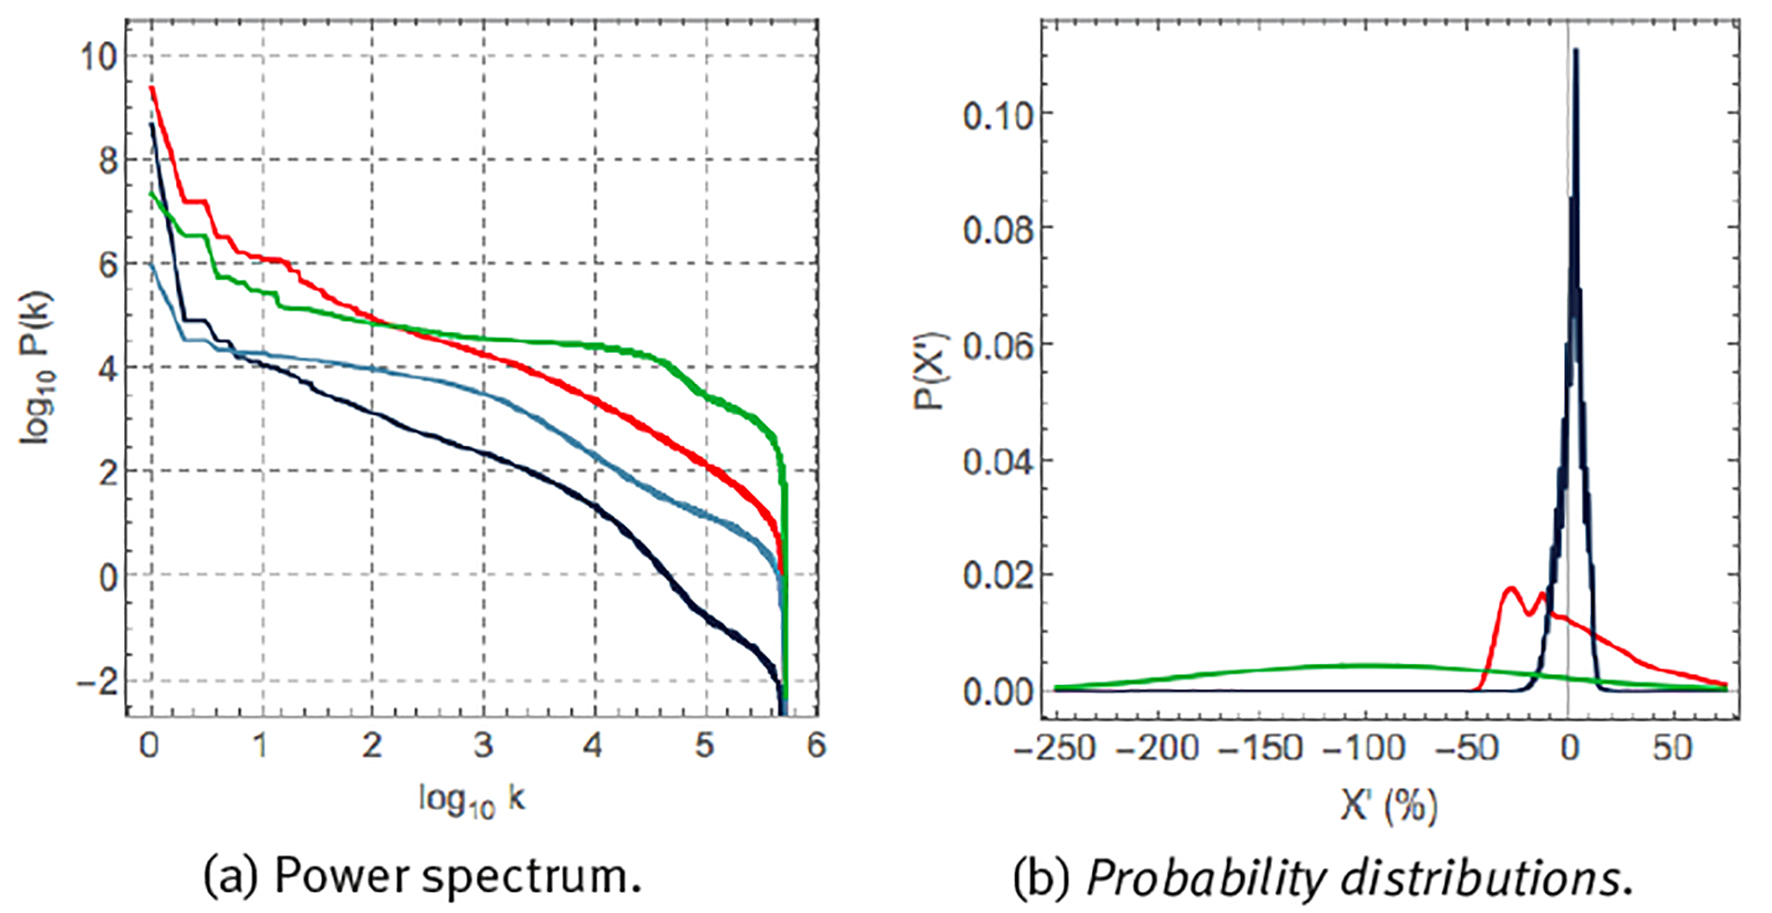
Note: (a) Scree diagram of Fourier spectral analysis, P(k), and (b) probability distribution P(X´) of fluctuations. X´ according to eq. (6). Units, colours, variables and sample rate as explained in Figure 3.
Source: Created by the authors.
Figure 6 Statistics of 1-year time series of the variables of Figure 4 (c).
for heart rate, skin temperature and step rate. These variables are characterized by very different probability distributions. Skin temperature corresponds to a narrow probability distribution with small fluctuations around the mean. Heart rate corresponds to a very asymmetric distribution with a tail towards large heart rate accelerations. Step rate corresponds to a wide Gaussian distribution and large fluctuations around the mean.
The previous paragraphs have illustrated that the phenomenology of physiological time series is very rich, depending on the specific variable and on the particular time scales that are studied. The rest of the present contribution will be dedicated to explore the general patterns that may explain part of this phenomenology.
Time-series analysis to explore the dynamics of homeostatic regulation mechanisms
Living organisms in general, and animals in particular, are embedded in two environments: an internal and an external one. Claude Bernard proposed the constancy of the internal environment as a means for the organism to gain independence from the external environment. These notions, although they might suggest a static description of life, are quite the opposite. Cannon proposed that living organisms are constantly adapting to perturbations from the external and the internal environment, at different temporal and spatial scales, to preserve the property of being alive (Boron & Boulpaep 2012). This multi-scale character is characteristic for human physiology, as well as in the misbehaviour of it, i.e., human pathology. For instance, the human body comprises different organ systems, which in turn are composed of individual organs made of tissues, defined as conglomerates of specialised cells. At an even smaller level, the cells also show hierarchical organisation ranging from subcellular structures to the very basic molecules that conform the genome. Therefore, clinical medicine has developed many areas of specialisation for studying the different elements of this complex physiological system. However, the human body is anything but fragmented. It is rather an integrated living system, in which regulatory process are continuously exchanging information across many levels, and it is precisely when such interactions are disrupted that disease is brought forth. The dynamics of these homeostatic regulatory processes have been thoroughly studied by physiologists and it is a concept present in the everyday medical practice. For example, a common way for assessing the integrity of the human body functioning are the so-called vital signs, which are proxies of the physiological state of the vital parameters controlled by different homeostatic mechanisms. Consistent with the different scales that were mentioned before, homeostasis can also occur at different levels. At the largest scale (the whole body), one of the most important regulation are those of the blood volume and blood pressure, both vital parameters. Otherwise, the blood would not reach all the tissues of all the organs and systems, leading to a state of shock, clinically defined as a life-threatening condition that occurs when the body is not getting enough blood flow. Such lack of blood flow implies a reduction of the homeostatic supply of the oxygen and nutrients, components that all tissues from all the organs and systems require for functioning properly (Boron & Boulpaep 2012). Another scale of analysis is the one that Bernard called the internal environment (currently known as the extracellular fluid). Here, the tightly controlled vital parameters include: body core temperature; plasma levels of oxygen, glucose, potassium ions, calcium ions, and hydrogen ions (Boron & Boulpaep 2012). At the microscopic level (the single cell), homeostatic processes are also constantly happening, such as the regulation of the intra-cellular volume, and the concentration of many inorganic ions (e.g. Na+, Ca2+, H+), and energy levels (e.g. ATP) (Boron & Boulpaep 2012).
According to control theory and physiology, physiological variables that participate in homeostatic regulatory mechanisms can be divided into 2 types, see Table 1 and Figures 7 & 9 and the corresponding references. Regulated variables, such as blood pressure and core body temperature, are to be maintained within a restricted range around a predefined setpoint. Effector variables and the corresponding physiological responses, such as heart rate and skin temperature, adapt to or oppose perturbations from the environment aiming to maintain the regulated variables as constant as possible. The main anatomical difference between both types of variables is that the regulated variables have their own specialized sensors that measure at each time point the value of that variable x and the error signal of the deviation from the setpoint e(t) = x(t)-x 0 which activates physiological responses from the effector variables if the error e(t) grows to large. Effector variables, on the other hand, do not have specialized sensors that participate in the control mechanism. In the following, we will illustrate the dynamics of blood pressure homeostasis and body temperature homeostasis using time series of the associated variables.
Table 1 Homeostatic regulation mechanisms consist of a regulated variable that is to be maintained within a restricted range around a setpoint and one or more effector variables that oppose perturbations from the environment.
| Homeostatic mechanism |
Regulated variable |
Normal range/value |
Sensor (location) |
Control centre (location) |
effectors | Effector response |
| Blood pressure homeostasis | Systolic blood pressure (SBP) & diastolic blood pressure (DBP) | 90-120 mmHg (SBP) 60-80 mmHg (DBP) | Mechanosensors (carotid sinus and aortic arch) | medulla | Heart Blood vessels | Heart rate, peripheral resistance, stroke volume, cardiac contractility |
| Body emperature homeostasis | Core body temperature | 36-37.5°C | Thermosensor (hypothalamus) | hypothalamus | Blood vessels, sweat glands, skeletal muscles | Peripheral resistance, sweating rate, shivering |
Source: Created by the authors based on Model et al. (2015) and Fossion et al. (2018a, 2018b).
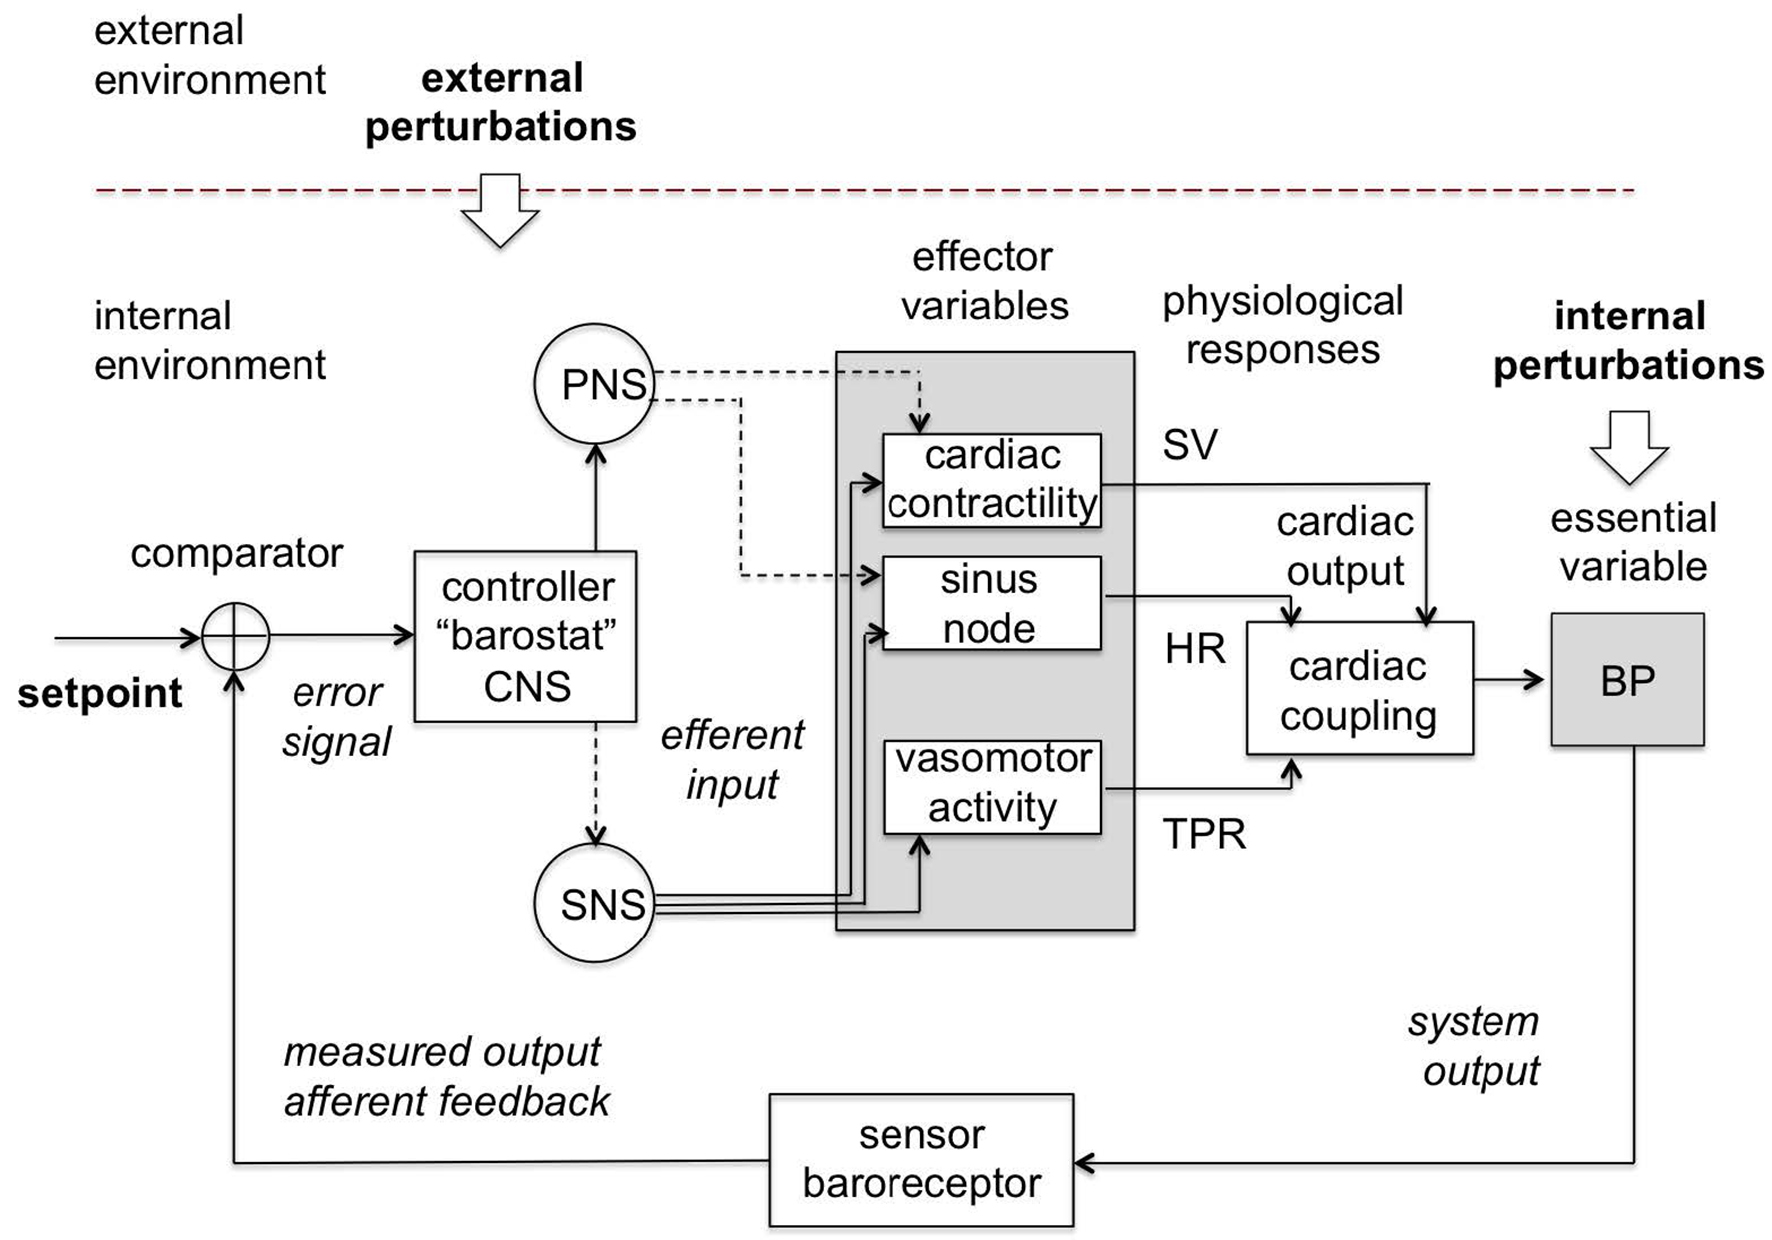
Note: The control centrum is located in the central nervous system (CNS) which passes commands through the sympathetic (SNS) and parasympathetic (PNS) branches of the autonomous nervous system (ANS) to the effector variables (and the corresponding physiological responses) such as cardiac contractility (stroke volume, SV), sinus node (heart rate, HR) and vasomotor activity (total peripheral resistance, TPR), which act together to maintain blood pressure (BP) in a restricted homeostatic range around the setpoint as measured by the baroreceptor. Continuous lines are excitatory and dashed lines are inhibitory.
Source: Created by the authors based on Fossion et al. (2018a, 2018b), Billman (2013) and Modell et al. (2015).
Figure 7 Blood pressure homeostatic control loop or barostat.
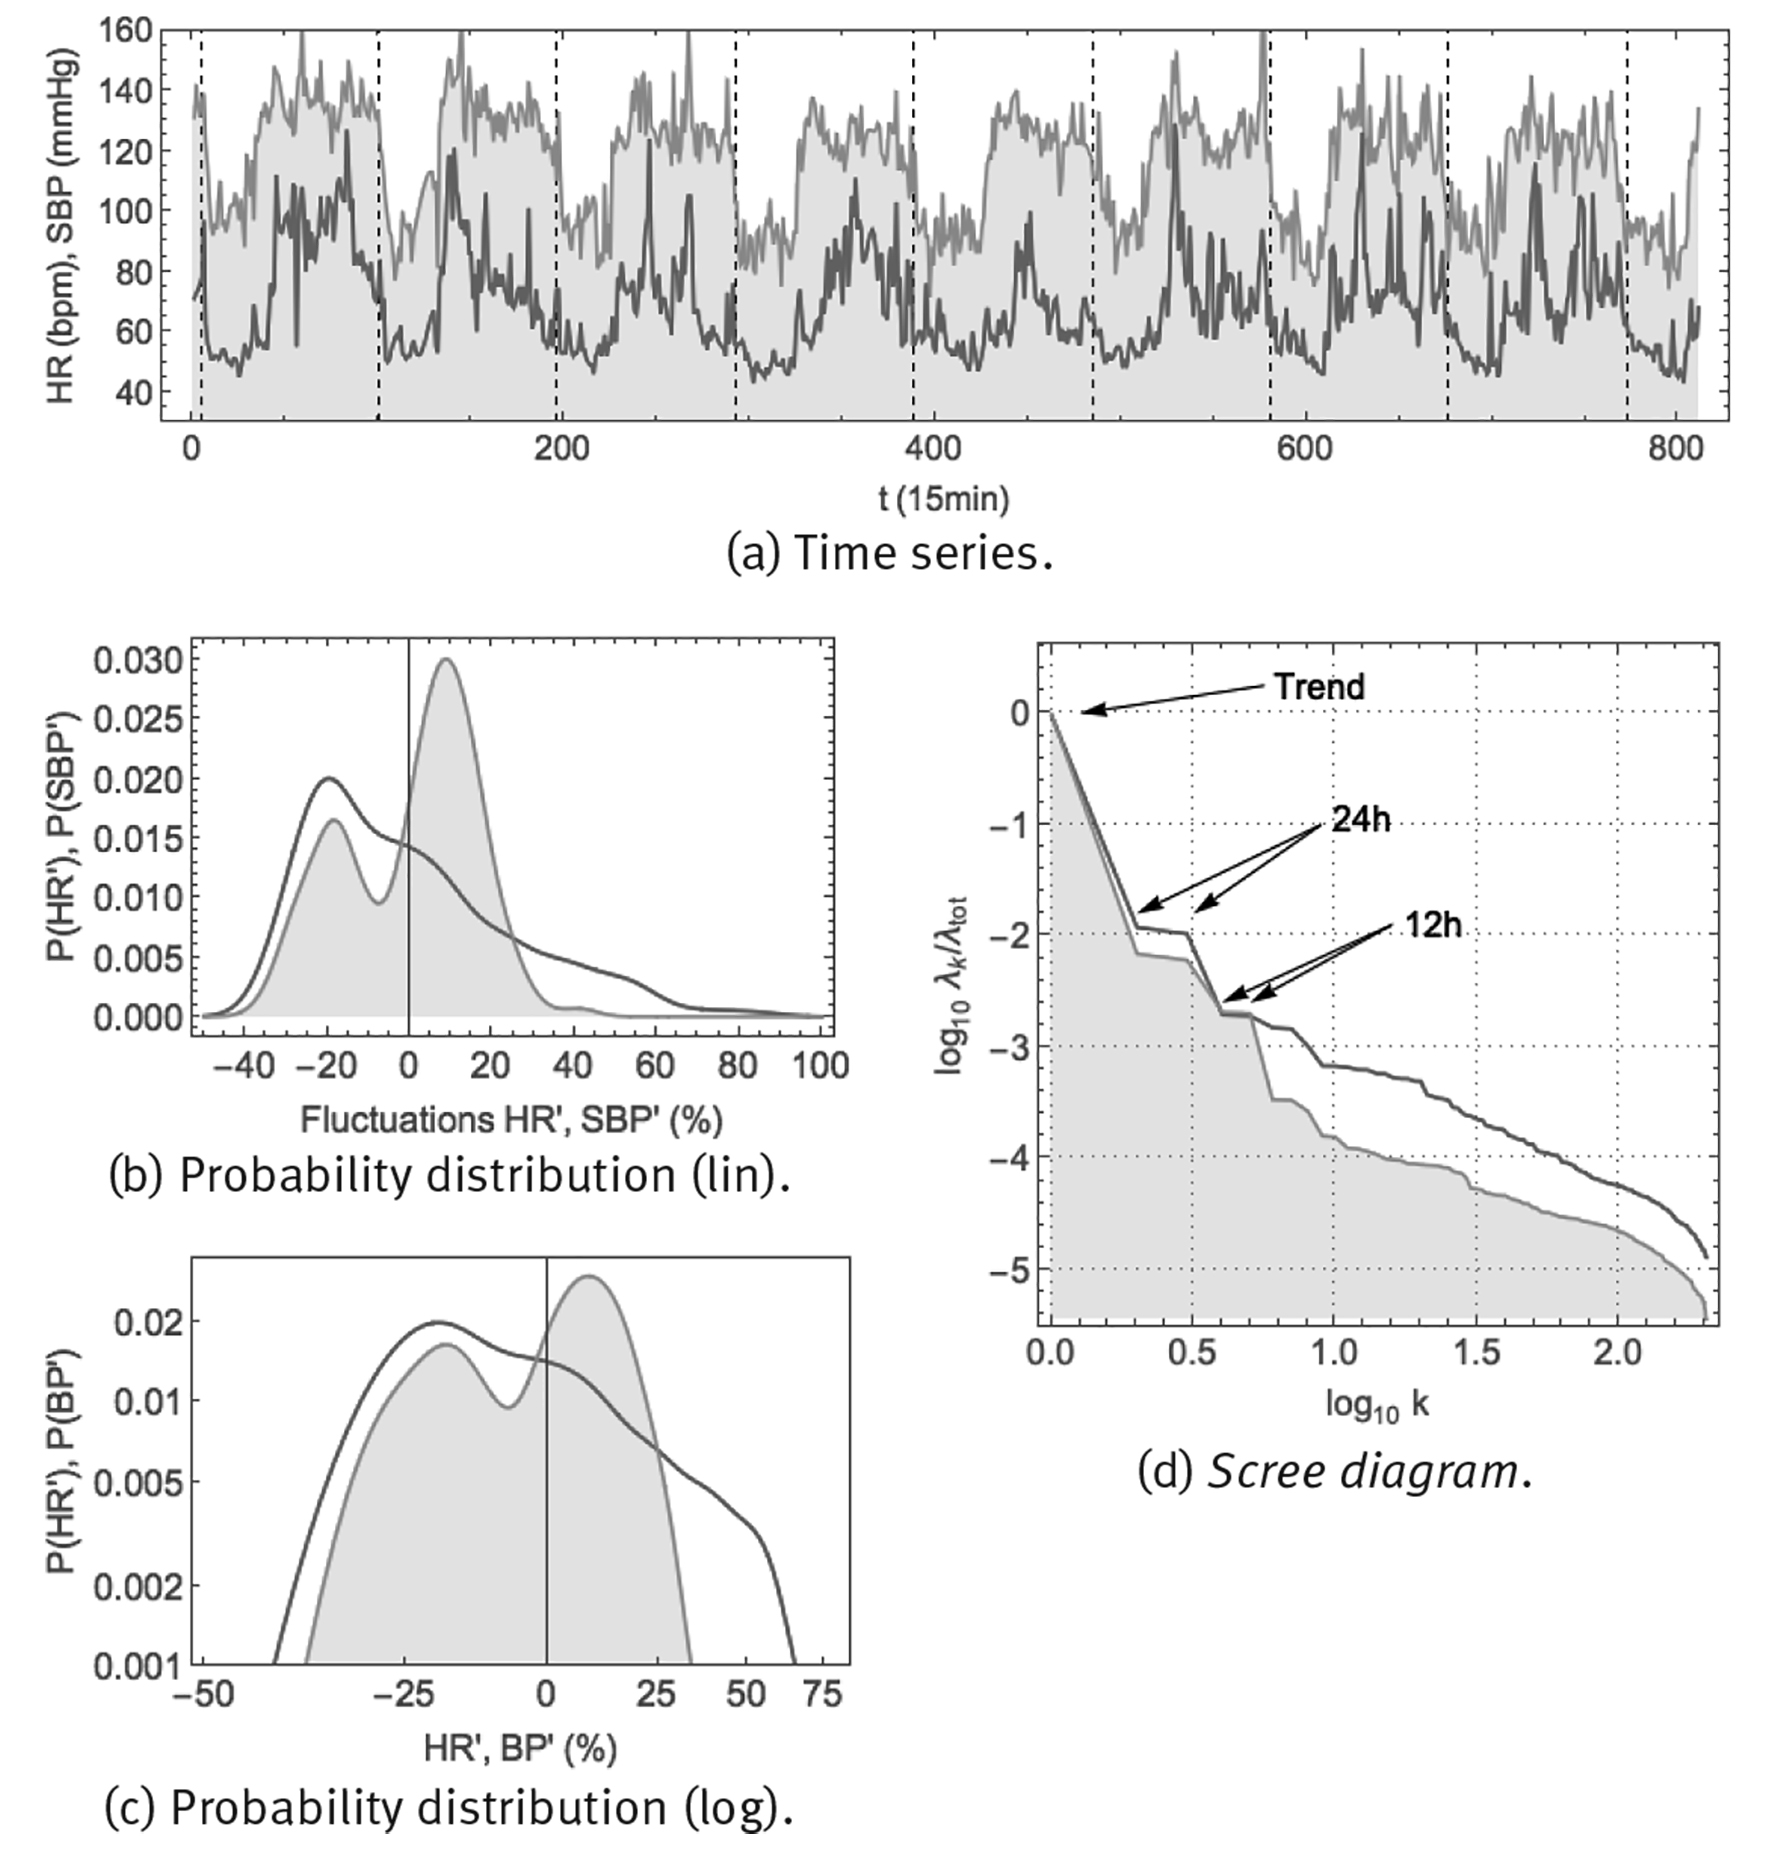
Note: Shown are: (a) time series using a 1/15 min sample rate, vertical gridlines at midnight, (b) probability distribution of fluctuations according to Eq. (6) in linear-linear scale, (c) probability distribution of fluctuations according to Eq. (6) in double-logarithmic scale and (d) SSA scree diagram of ordered fractional partial variances λ k /λ tot.
Source: Created by the authors.
Figure 8 Continuous monitoring of heart rate HR (red curve) and systolic blood pressure SBP (orange curve, shaded) over 8 successive days using the ambulatory blood pressure monitor CONTEC ABPM50.
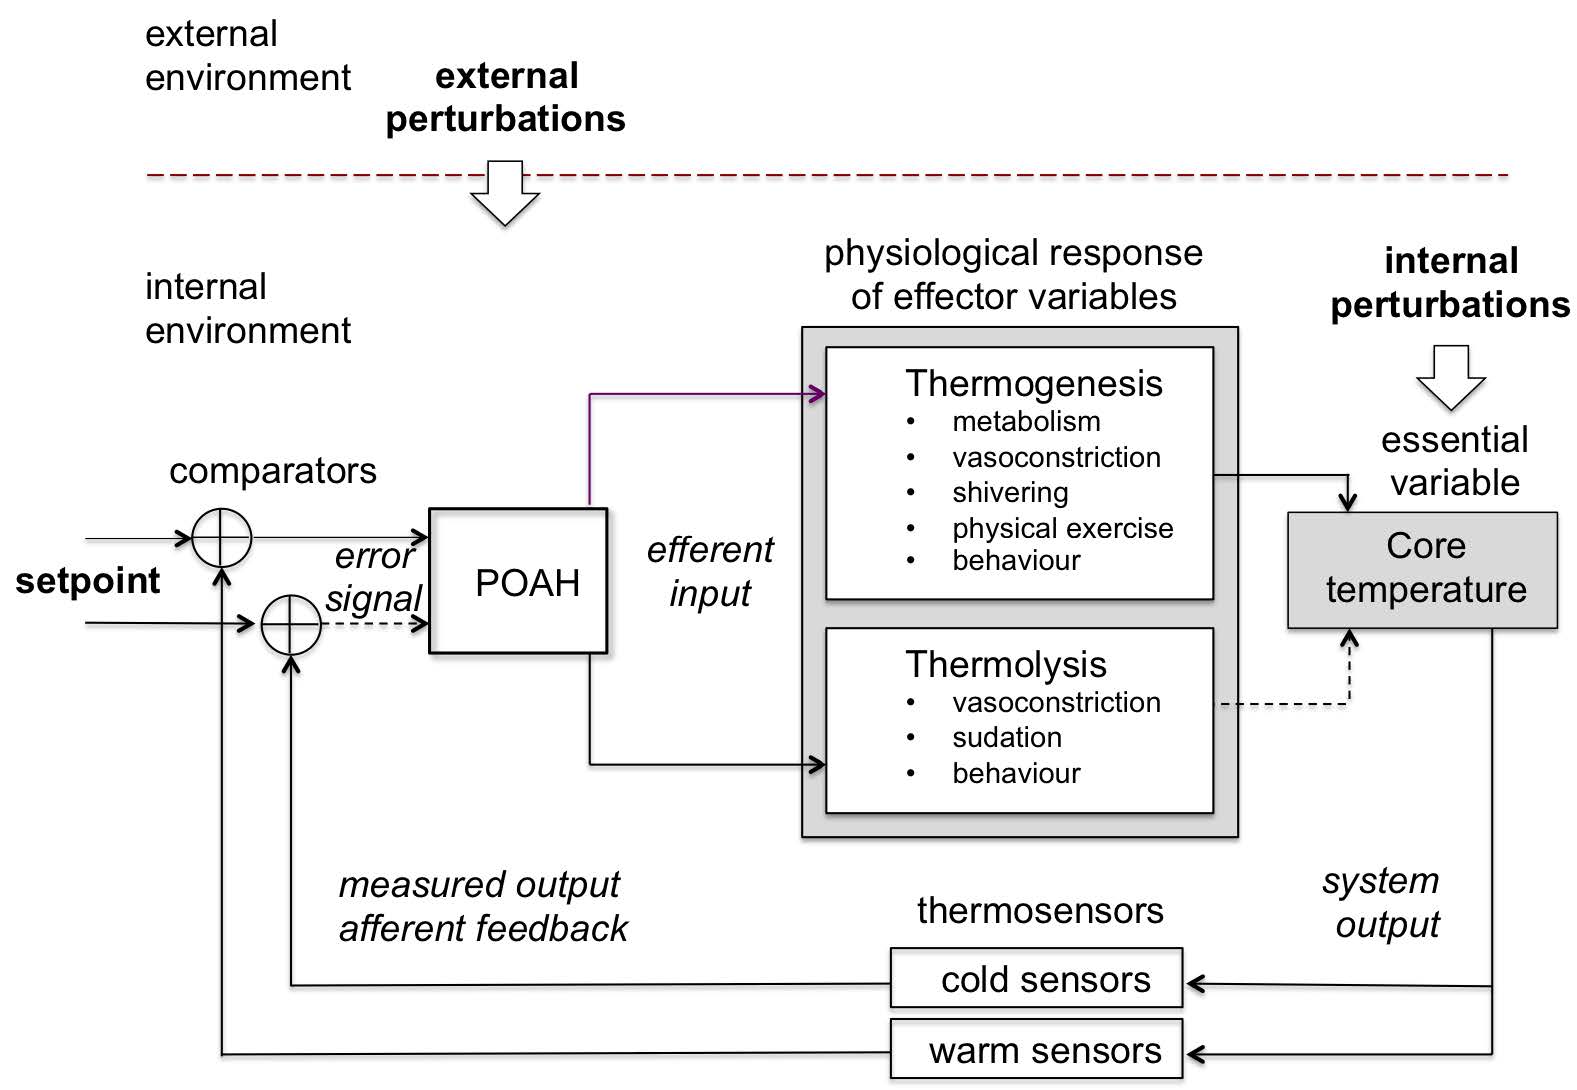
Note: Skin and visceral neurons act as thermoreceptors and carry the information of the internal and external temperature to the preoptic anterior hypothalamus (POAH) which passes commands through the sympathetic (SNS) and parasympathetic (PNS) branches of the autonomous nervous system (ANS) to the effector components to produce (thermogenesis) or eliminate heat (thermolysis) such as sweat glands, blood vessels, brown adipose tissue and skeletal muscle. All these modulate the production and transfer of heat by constantly interacting with the internal and external environments.
Source: Created by the authors based on Fossion et al. (2018a, 2018b), Billman (2013) and Modell et al. (2015).
Figure 9 Body temperature homeostatic control loop or thermostat.
Example 1: Blood pressure homeostasis
From the homeostatic standpoint, blood pressure (henceforth, BP) is an example of a controlled variable which must be maintained within a restricted range of values near a setpoint of 120 mmHg (for the systolic BP), and 80mmHg (for the diastolic BP). Blood pressure is one of the so-called vital signs given that its adequate regulation is mandatory for proper organ perfusion (amount of oxygen delivered to the tissues). Blood pressure is defined as the force of the blood against the walls of the arteries. Importantly, blood volume (intravascular liquid) is crucial for such pressure to exist. Additionally, the heart is responsible for pumping the blood through the network of vessels in such a way that the exerted force of the blood against the walls of the vessels is sufficient for blood pressure to be tightly controlled. Moreover, arterial vessels are constantly adjusting their diameter to maintain the blood pressure under control, and ultimately supply the organs with adequate amounts of blood; therefore, vasoconstriction and vasodilation are dynamical mechanisms that also play a crucial role for the regulation of blood pressure. The regulatory mechanism of blood pressure and volume has different components that act at different time scales and through different modalities (Boron & Boulpaep 2012; Clancy & McVicar 2013), (Figure 7).
Short-term (seconds to minutes): there are specialized mechanoreceptors in the carotid sinus and aortic arch, called baroreceptors, that are sensitive to the stretching of the walls of the blood vessels. When stimulated (usually by a blood pressure increase or decrease), they send a signal via nerves of the autonomous nervous system (ANS) to the brainstem, where a neuronal integration process is carried out to elicit by neural activity (electrical pulses) a proper response to the effector organs (heart, vessels and adrenal medulla).
Intermediate and long-term (hours to days): regulated via humoral pathways that targets either arteries and veins to modulate the vasomotor tone (using vasoactive hormones), or the kidneys to modulate the extracellular fluid volume that produces proportional changes in the intravascular volume (using non-vasoactive hormones).
Heart rate time series can be obtained easily, using whatever electronic electrocardiogram (ECG). Blood pressure is more difficult to measure, at least non-invasively and in a continuous way. One method is an ambulatory blood pressure measurement device, such as the CONTEC ABPM50 (Figure 2 (a)), consisting of an arm cuff which inflates at periodic time intervals to make a measurement of blood pressure (BP) and heart rate (HR). Both systolic blood pressure (SBP), the maximum blood pressure just after a heartbeat, and diastolic blood pressure (DBP), the minimum blood pressure just before a new heartbeat, are measured. Arterial blood pressure and heart rate were monitored continuously, every 15min over 8 successive days, in a healthy male young adult (38yo). Resulting time series and corresponding statistics are shown in Figure 8. The time series of panel (a) show that both heart rate and blood pressure are characterized by a circadian response to the day-night cycle, with higher values for heart rate and blood pressure during the day than during the night. Blood pressure appears to fluctuate around a specific setpoint during the day and around another setpoint during the night. For heart rate, there could be a resting-state average value, apparent especially during night-time, but during the day there does not seem to be a representative value. Panels (b) and (c) show the probability density distributions for the fluctuations according to Eq. (6). Blood pressure would seem to correspond with a superposition of 2 Gaussian distributions, corresponding to small fluctuations around the day and night setpoints. On the other hand, heart rate might correspond to a Gaussian distribution at low values, corresponding to small fluctuations around the resting-state heart rate, but at higher values it corresponds to a heavy-tailed distribution with large fluctuations and no single representative value. Panel (d) shows the scree diagram of a spectral analysis according to the method of singular spectrum analysis (SSA), for technical details see Fossion et al. (2017b). Blood pressure has distinguishable 24 h and 12 h periodic components which are responsible for the major part of the variance of the time series, whereas ultradian fluctuations are less important by 1 order of magnitude. Heart rate only has a 24 h periodic component, fluctuations take up an important part of the variance of the original time series and are much more important than in the case of blood pressure. Fluctuations of both variables would seem to follow an approximate 1/f power law.
Example 2: Body temperature homeostasis
Humans are a homeotherms species so its body temperature does not depend on the environmental temperature. Rather it relies on a tight controlled mechanism that considers the internal chemical reactions, as well as the environmental conditions. Body temperature refers to the core temperature (internal) and under healthy conditions it ranges from 36 ºC to 37.5 ºC. This controlled variable depends on many factors, from which the most important are thermoregulatory network in the central nervous system (CNS) (circadian rhythm, etc.) and the metabolic rate (aging, etc.). Core body temperature is the result of the sensitive balance between heat production and heat elimination (Boron & Boulpaep 2012), (Figure 9).
Heat production (thermogenesis): the inefficiency of chemical reactions in the body (losing some energy of the reaction, mostly in the form of heat) relates the two concepts of energy consumption or metabolic rate on the one hand, and heat production on the other hand. These two contributions vary a lot throughout age, different moments of the day, during exercise, etc. The resting metabolic rate (RMR) is the energy consumption necessary to maintain the basal functions of resting cells, as well as the activity of the cardiac and respiratory muscles that are necessary for the survival of the organism. On top of the RMR all the energy consumption adds up (exercise, age, circadian phase, habitat, phylogeny, etc.) consequently building the overall metabolic heat production.
Heat elimination (thermolysis): the metabolic heat production is rather variable and sometimes it can be too high (as in extreme exercise) such that the human body needs to dissipate the excess of heat preventing noxious states as hyperthermia and heat stroke. The way in which the body dissipates the core heat is by transporting it to the skin so that it can be transferred to the environment by various mechanisms (radiation, convection, evaporation and conduction). Such heat movement requires the activity of both blood and blood vessels. The former collects the heat from all around the body by convection, whereas the latter conduct the warm blood to the skin and radiation to the environment can be controlled by modifying their diameter through the ANS activity.
Skin temperature is monitored easily, where a measuring device such as the Thermochron iButton of Figure 2 (b) can be fixed to the skin using medical tape; core temperature on the other hand is more difficult to measure and the measurement device must be introduced into a body orifice. Core temperature and skin temperature were monitored continuously, every 3 min over 7 successive days, in a healthy male young adult (38yo), measuring anal temperature and skin temperature at the wrist. Time series and corresponding statistics are shown in Figure 10. The time series of panel (a) show that both core and skin temperature are characterized by a circadian response to the day-night cycle, with core temperature being higher and skin temperature being lower during the day (when vasoconstriction predominates), and vice versa during the night (when vasodilatation predominates). Core temperature would seem to fluctuate around some constant value during the day and around another value during the night, called the day and night setpoints. On the other hand, for skin temperature, only during the night there would seem to be an average value around which skin temperature fluctuates, whereas during the day there would not seem to be a representative value. Panels (b) and (c) show the probability density distributions for the fluctuations according to Eq. (6). Core temperature would seem to correspond with a superposition of 2 narrow normal distributions, corresponding to small fluctuations around a night setpoint and small fluctuations around a day setpoint. On the other hand, skin temperature appears to follow a broad normal distribution at high values, corresponding to fluctuations around a night-time average value, but at lower values it corresponds to a heavy-tailed distribution with large excursions to low temperatures. Panel (d) shows the scree diagram of a spectral analysis SSA (Fossion et al. 2017b). There is a clear circadian component in core temperature, which is somewhat less dominant for skin temperature. Ultradian fluctuations are 1 order of magnitude smaller than the circadian component for core temperature, but are of comparable intensity for skin temperature, which means that the fluctuations hardly contribute to the variance of core temperature, whereas they constitute the major part of the variance of skin temperature. There appear to be 2 scaling regions for the ultradian components, with a power law P(k) ∝ 1/k γ with γ ≈ 1 at larger ultradian scales 0.5 < log(k) < 1.5, both for core and skin temperature, and another power law at smaller ultradian scales log(k) > 1.5, with γ ≈ 2 for skin temperature and γ ≈ 4 for core temperature.
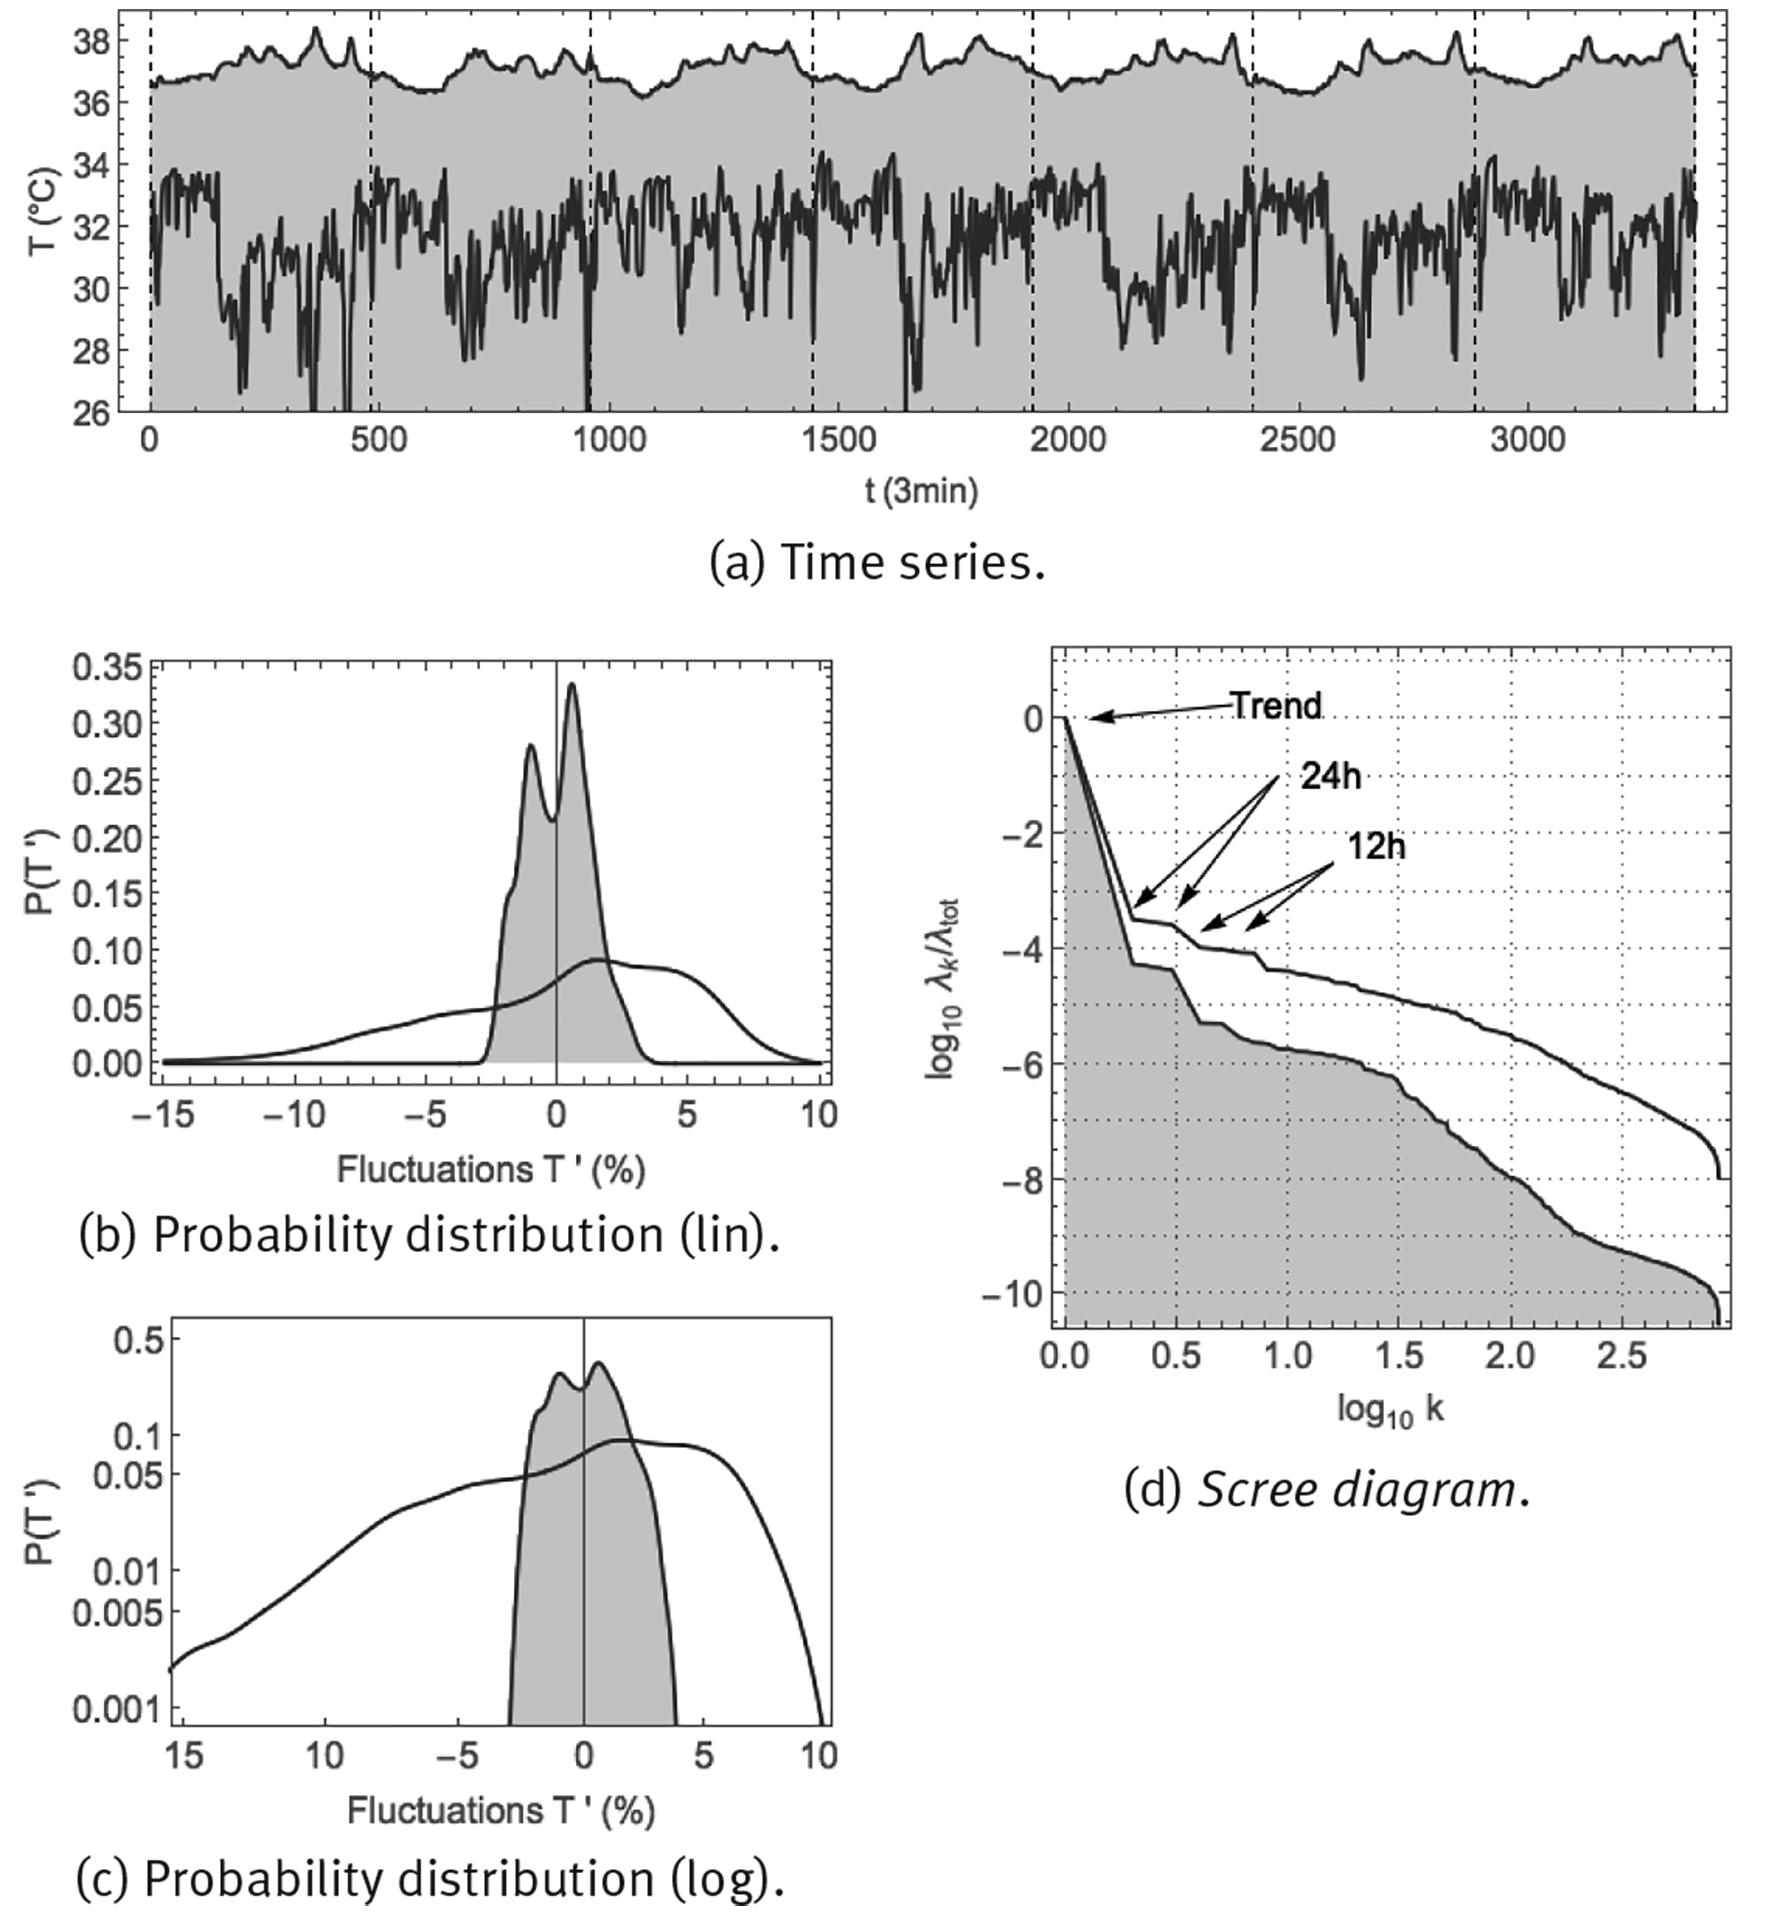
Note: Shown are: (a) time series sampled at 1/3 min; (b) probability distribution of fluctuations according to Eq. (6) in linear-linear scale, and, (c) probability distribution of fluctuations according to Eq. (6) in double-logarithmic scale, and (d) SSA scree diagram of ordered fractional partial variances λ k /λ tot.
Source: Created by the authors.
Figure 10 Continuous monitoring of skin temperature (purple curve) and core temperature (purple curve, shaded) over 8 successive days using the Thermochron iButton.
Discussion
Regulated and effector variables play very different roles in homeostatic regulation (Table 1). Negative feedback loops act to maintain regulated variables (such as blood pressure and core temperature) as close as possible to a predefined setpoint, whereas effector variables and the associated physiological responses (such as heart rate and skin temperature) serve to correct for perturbations from the environment.
Using physiological time series of a healthy young adult corresponding to blood pressure homeostasis and body temperature homeostasis, we have illustrated that “static” statistical properties such as the probability distribution of the fluctuations of the time series reflect these different roles in the homeostatic regulatory mechanisms. Regulated variables are characterized by a Gaussian distribution, which describes small fluctuations of one single scale (of the order of a standard deviation) around a representative average value, which makes sense for a variable that is to be maintained in a restricted range around a setpoint. Effector variables and physiological responses, on the other hand, are characterized by heavy-tailed distributions with large fluctuations, which possibly reflect the wide range of physiological responses to adapt to perturbations from the outer environment. Although the effector variables are not controlled directly by the homeostatic regulatory mechanism, their dynamics does not appear to be without correlations, and we speculate that they may be self-organized, which is a process where some overall order arises from the local interactions between the parts of the complex system, and/or exhibit self-organized criticality, which is a property of dynamical systems that have a critical point as an attractor, and which is considered to be one of the mechanisms by which complexity arises in Nature (Bak 1996; Muñoz 2017). There is indeed evidence that heart rate might be self-organized to converge continually to a critical state that constitutes an intricate balance between the antagonistic activity of the sympathetic and parasympathetic nervous systems (Kiyono et al. 2004; Struzik et al. 2004; Kiyono et al. 2005). In scientific divulgations, homeostasis is sometimes described as a “zen-like property of constancy through change” (Sapolsky 2004), and the results presented in the present contribution suggest that this statement does not need to be taken philosophically, but can be interpreted in a literal way, where the regulated variables define in some way the stability of an organism and the effector variables its adaptability, and both properties are necessary for an organism to be resilient or non-frail. On the other hand, in the previous contribution Fossion et al. (2018a, 2018b), we have demonstrated that with ageing and chronic degenerative disease, homeostatic control mechanisms may degenerate, such that effector variables lose adaptive capacity and their time series become less variable, corresponding to the loss of complexity hypothesis, and consequently regulated variables get out of control and become more variable, corresponding to the paradigm of early-warning signals (Table 2).
Table 2 Intuitive interpretation of the variability of physiological variables depending on the role they play in the homeostatic regulatory mechanisms.
| Type of variable | Regulated variable | Effector variable |
| Synonyms | Directly controlled | Indirectly controlled, regulating self-organized |
| Statistics in optimal conditions |
|
|
| Statistics in adverse conditions |
|
|
| Theoretical paradigm | Early-warning signals (Scheffer 2009) |
|
Source: Created by the authors.
Also, the “dynamical” statistical properties of a time series can be studied, e.g., using spectral analysis with Fourier or SSA. The study of the relation between the fractal properties of a time series and the type of control of homeostatic regulatory mechanisms is the topic of, e.g., West (2009), where the advanced technique of fractional calculus is employed. In young healthy subjects, in the case of multi-day time series, the dominant component is the periodic circadian cycle which reflects the physiological response to the single dominant stimulus that exists at that time scale which is the alternation of day and night.
At ultradian scales, partial variances of time series components seem to scale according to a power law, see Eq. (4), meaning that the behaviour is fractal in time. The interpretation may be that at time scales of < 24h many different stimuli coexist where each stimulus requires a specific physiological response, and all these responses may go in different directions, resulting in a time series where it is not possibly to identify individual components with a specific time scale, but a fractal time series where all these time scales coexist. It is possible that the power law exponent reflects certain properties of the specific control mechanism at play. In the case of blood pressure homeostasis of Figure 8 (d), both heart rate and blood pressure would seem to correspond approximately to a 1/f power law (γ ≈ 1) at all ultradian time scales, which might indicate that in this case the same control mechanisms play a role at all these time scales. In the case of body temperature homeostasis of Figure 10 (d), skin temperature and core temperature would seem to correspond to a 1/f power law (γ ≈ 1) only a larger ultradian scales, whereas at smaller ultradian scales the slope of the power law would seem to become much steeper, with γ ≈ 2 for skin temperature and γ ≈ 4 for core temperature, which might indicate that different control mechanisms play a role at longer and shorter time scales, and that these are different for core and skin temperature. The spectral exponent β or γ of the power law quantifies the intensity of the correlations present in the time series and may reflect the strength of the control of the underlying regulatory mechanism, where γ ≈ 0 would correspond to white noise or absence of control and γ ≈ ∞ to a periodic cycle or absolute control.
Conclusion
One of the great present-day scientific challenges is to quantify the resilience or fragility of complex dynamical systems and to predict a possible collapse. Especially in the context of population ageing and the growing prevalence of chronic degenerative disease, an adequate quantification of the global health state of a person is a pre-requisite to move from a curative to a preventive medicine. One of the challenges is how to quantify “systemic” properties that emerge from and are not contained in the properties of the individual components, for which the time-series analysis of some of the key variables associated to the complex system might offer a solution. One of the unsolved questions in time-series analysis is why in some cases variability is an indicator of good health whereas in other cases it can be interpreted as a risk factor. Also, in literature, frameworks that have been proposed to explain the phenomenology of time series of complex systems, such as the loss of complexity hypothesis and self-organized criticality on the one hand, and the paradigm of early-warning signals on the other hand, are in apparent contradiction. In the present contribution, we were inspired by control theory and physiology, to distinguish between regulated and effector variables, that play very distinct roles in homeostatic regulatory mechanisms. Using experimental time series, we showed that regulated variables such as blood pressure and core body temperature obey Gaussian statistics with small fluctuations around a representative average value, which is compatible with their physiological role of regulation within a restricted range around a setpoint, whereas effector variables such as heart rate and skin temperature obey distributions with heavy tails and large fluctuations that span various scales, which may be associated with the wide range of physiological responses that adapt to or oppose perturbations from the environment with the objective to maintain the regulated variables as constant as possible. Exceptions to the above rules may be resting conditions with a minimum of stimuli where effector variables and the associated physiological responses also may fluctuate around a characteristic resting value according to a Gaussian distribution, and the single dominant stimulus of the alternation of day and night which induces a periodic cycle in both regulated and effector variables. Regulated variables may represent the stability properties of a complex dynamical system, and effector variables the adaptive properties, which together constitute the resilience of the system. Although the above results were derived for physiology, they might be applicable in general to dynamical complex systems where regulatory mechanisms are at work.

