


 nueva página del texto (beta)
 Inglés (pdf)
 Artículo en XML
 Referencias del artículo
 Enviar artículo por email
 Citado por SciELO
  Similares en
SciELO
Similares en
SciELO 
 Permalink
Introduction
Molecules with electron donating properties can associate with those acting as electron acceptors to form charge transfer (CT) complexes, in which partial electron transfer gives rise to interesting and useful electronic and optical properties (Goetz et al., 2014). These complexes can also often form cocrystals, with either stacks of alternating donor and acceptor molecules, or adjacent stacks of each molecule. One characteristic of CT complexes is the appearance of a new absorption peak (or peaks) at a lower energy than the lowest energy peak in either of the constituents (Mulliken, 1939). This peak is due to a new excited state arising from the charge transfer.
A simple example of a CT complex is that of hexamethylbenzene (HMB) as the donor and chloranil (CA) as the acceptor, the structures of which are shown in Figure 1 (Harding and Wallwork, 1955). The two form a complex with parallel molecular planes. The complexes can then form crystals with alternating donor and acceptors stacked along the axis perpendicular to their molecular plane (Harding and Wallwork, 1955; Hunter and Norfolk, 1969; Jones and Marsh, 1962; Le Magueres et al., 2001). The formation is accompanied by the appearance of a charge transfer peak at a wavelength of 520 nm (Foster et al., 1956; Le Magueres et al., 2001).
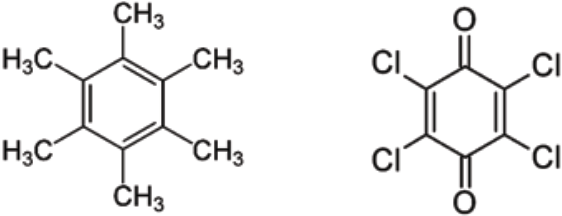
Source: Creation of the authors.
Figure 1 Molecular structure of hexamethylbenzene (left) and chloranil (right).
One method for forming crystals from solution is through anti-solvent addition, in which a miscible poor solvent is added to a solution (Horn and Rieger, 2001). This method has been developed for the synthesis of nanoparticles, and is known by several names, including micronization (Horn, 1989) and the reprecipitation method (Kasai et al., 1992). The addition of the poor solvent causes the solute to become supersaturated, which eventually gives rise to crystal nucleation and growth. While the method has been extensively studied, the details of the crystal formation and growth are not completely understood. Crystallization of CT complexes using this method is particularly interesting since the association (complexation) of the molecules prior to the formation of large scale crystals can be monitored through the CT absorption peaks, and in some cases, long range order in these crystals can give rise to further changes in the optical properties. This enables real time characterization of the solution crystallization process (Li et al., 2019; Van Keuren and Nishida, 2010).
The rapid mixing required to achieve particles with sizes on the order of 10~100 nm and narrow distributions can be achieved in a number of ways. Prud’homme’s group pioneered the use of a confined impinging jet mixer (Johnson and Prud’homme, 2003) or a vortex mixers (Liu et al., 2008) to achieve this rapid mixing in a controlled manner in a method they called flash nanoprecipitation. This method has been used to synthesize nanoparticles of small molecules as well as polymers (Van Keuren, 2004).
Here we use several types of mixers, including a 3D printed vortex mixer, a double impinging jet mixer, and a single jet mixer to synthesize nanocrystals of the charge transfer compound HMB:CA. For all three processes, the UV-Vis absorption spectra were used to determine the time scale for the formation of the crystals. This data, along with similar measurements of the particle size after mixing using dynamic light scattering, sheds light on the crystallization of the nanoparticles.
Materials and methods
Sample preparation
Chloranil (TCI) and hexamethylbenzene (Acros), both with purity >98%, were dissolved in ethanol at concentrations of 4.0 mM, then mixed together just before reprecipitation. For all three mixers, this solution was mixed with DI water at a 1:10 (solution:water) volume ratio. As both compounds have poor solubility in water, they became highly supersaturated in the mixture, inducing aggregation/crystallization.
For manual reprecipitation, 0.3 ml of the solution was injected through an 18 gauge needle (0.838 mm ID) into 3.0 ml of DI water at a rate of 1.0 ml/ sec, followed by agitation of the mixture for several seconds. The sample was contained in a cuvette and immediately placed into the spectrometer for measurement of the spectra as a function of time after mixing. A minimum time after mixing of 1 minute could be achieved in this process.
For samples prepared in the vortex mixer, the ethanol solution was loaded into a 1.0 ml syringe and a 10 ml syringe was filled with DI water. Both syringes were attached to a dual syringe pump (Hamilton). The solution and water were injected into the vortex mixer with a flow rate of 0.04 ml/s for the solution and 0.4 ml/s for the water. The outlet of the mixer was fed directly into a cuvette, where the absorption spectra were monitored. A minimum time after mixing of approximately 0.5 seconds could be achieved from the vortex mixer.
In order to achieve even shorted times between mixing and measurement of spectra, we used the double jet mixer/continuous flow chamber. A 20 ml syringe was filled with DI water and a 2 ml syringe filled with the ethanol solution. Both syringes were operated simultaneously using a dual syringe pump (KD Scientific). The water was injected at a rate of 1.1 ml/s and the solution at 0.11 ml/s. A minimum time of approximately 90 ms after mixing could be characterized with this apparatus.
Vortex and impinging jet mixers
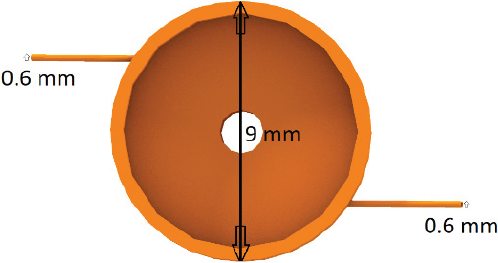
The vortex mixer was produced using a 3D printer (Leapfrog), with polylactic acid (PLA) as the printing material. The design was created using Tinkercad software. Unlike the four inlet vortex mixer described by Liu (Liu et al., 2008), the mixer had two inlets. The vortex mixer chamber had a radius of 9 mm and a depth of 4 mm. Two inlet holes were made in the side of the chamber and metal nozzles with 0.6 mm inner diameter were inserted and sealed into the mixing chamber (see Figure 2). The metal nozzles were connected by tubing to syringes controlled by a syringe pump (KD Scientific). A glass plate was sealed to the top of the mixer, which allowed for the solution inside to be imaged to insure that complete mixing of the two streams occurred inside the chamber.
The double impinging jet mixer was constructed of two rectangular plates of glass, sandwiching a 2 millimeter Teflon® sheet into which the inlet nozzles, mixing chamber and continuous flow chamber had been machined. The mixing chamber was a cylindrical region 4 mm in diameter and 2 mm thick, with two diametrically opposed input nozzles (ID 0.5 mm). A 2 mm long output channel with a 1 × 2 mm2 cross section at the bottom of the mixing chamber emptied into a 100 mm long channel with a 5 × 2 mm2 cross section. During continuous flow, the optical transmission through this channel could be monitored as a function of distance from the outlet of the mixing chamber, enabling the spectrum to be measured as a function of time after mixing. At the maximum injection rates through the input nozzles, the sample could be probed at times ranging from ~100 ms to 1 second after mixing.
UV-Vis absorption spectra
Spectra of the samples prepared by manual injection were measured using a Cary 5000 UV-Vis-NIR spectrometer (Agilent). The duration of each scan was approximately 30 seconds. For the samples prepared in the vortex or double jet mixers, the absorption was measured using an Ocean Optics spectrometer (Chem, 2000) with wavelength range 190 to 890 nm.
Dynamic light scattering
Particle sizes were measured using dynamic light scattering (DLS). The apparatus was assembled from discrete optical components. The incident light was from a 4 mW HeNe laser with wavelength 632.8 nm. The beam was incident on the sample in a 1 cm2 cross section sample cuvette. As in the measurements of the spectra, the output of the vortex mixer flowed directly into the cuvette. Light scattered at 90° to the incident beam was collected by a single mode optical fiber. The fiber was connected to a photon counting avalanche photodiode (EG&G), whose signal was processed by an ALV5000 (ALV GmbH) hardware autocorrelator. The data was analyzed using the method described by Frisken, which directly uses the autocorrelation function (not its square) and takes into account an arbitrary background signal (Frisken, 2001). Nonlinear fits to the autocorrelation function data gave values for the first moment of the distribution of decay times, which were used to calculate the size of the particles. More details on the analysis can be found in Van Keuren et al. (2008). Errors bars on the data were determined by repeated time dependent measurements of samples prepared under the same conditions.
Results and discussion
Figure 3 shows the absorption spectra of the pure components HMB and CA. Measurement of the spectrum of the two components mixed together in ethanol did not show any evidence of complex formation in at the concentrations used in ethanol. Figure 4 shows the spectra of the HMB:CA ethanol/water mixture from the manually mixed samples at times ranging 1 to 30 minutes. The overlapping peaks from HMB and CA are apparent near 300 nm, and shift slightly to longer wavelengths over this time period. The CT peak at 525 nm is immediately visible in the spectrum, indicating that complexation occurs over times less than 1 second. There is a slight increase over time in overall absorbance that is likely due to scattering by the particles, and the red-shift and broadening of the peak at 525 nm. We have observed similar effects in other CT nanocrystals (Li et al., 2019) and attributed it to the formation of longer range order in the crystals.

Source: Creation of the authors.
Figure 3 Absorption spectra of 0.1 mM ethanol solution of HMB (solid line) and CA (dotted line).

Source: Creation of the autors.
Figure 4 Spectra of the HMB-CA crystals vs. time after mixing prepared using manual injection.
Figure 5 shows similar spectra vs. time for the sample prepared in the vortex mixer. The absorption peaks of the individual components at 273 nm (CA) and 285 (HMB) were too strong at these concentrations and could not be resolved, but the CT peak at 525 nm is immediately visible in the spectrum, even at the shortest times after mixing. This sets the time scale for the formation of the complex at less than the sum of the residence time in the mixer and the measurement duration, or about 500 ms total. Gaussian fits to the spectra after removing the background show a slight shift in the CT peak from 527 nm to 539 nm. In addition, the peaks increase slightly in intensity (0.13 to 0.18) and broaden (FWHM changes from 118 nm to 139 nm). It is also somewhat less pronounced than in the spectra in Figure 4, and there is a larger increase in the background scattering. Both effects may be due to differences in the details of the mixing for the two samples.
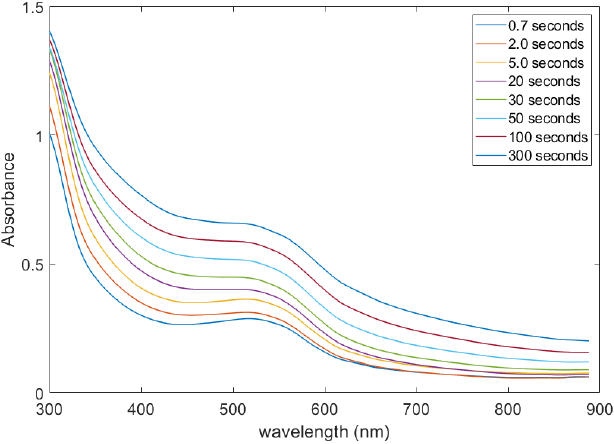
Note: The spectra were smoothed with a Gaussian filter.
Source: Creation of the autors.
Figure 5 Spectra of the HMB-CA nanocrystals vs. time after mixing for samples prepared in the vortex mixer.
Particle sizes from this sample were measured by DLS and are shown in Figure 6. Since the measurements require sampling times of 15 seconds, we are unable to determine the sizes at very short times. The data do show that particle formation is rapid, with an initial radius around 50 nm that increases to 100 nm within 30 seconds and then increases more slowly over about 15 minutes. This correlates with the fact that the CT peaks in the spectra appear almost immediately after mixing. Similar behavior in the size vs. time was observed in the formation of anthracene nanoparticles using reprecipitation, and was attributed to diffusion of single molecules to the particle surfaces (Van Keuren et al., 2003).
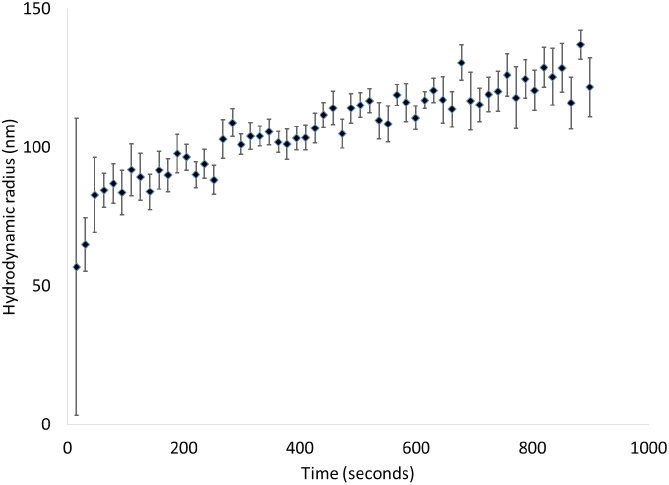
Note: Error bars were determined from repeated measurement of the particle size vs. time.
Source: Creation of the authors.
Figure 6 DLS measurements of particles size vs. time after mixing.
The more gradual change in the CT peak at 525 nm seen in Figures 4 and 5 occurring in the first ten minutes after mixing is likely due to either the slower growth of the particles as more molecules diffuse to the surface, or internal molecular rearrangement in the particles creating larger crystal grains. The similar time scales for the changes in spectra and particle sizes from DLS suggest that the former is at least partly responsible for both effects. The absorption energies of the electrons along the crystal axis may be affected by the delocalization length, which could depend on either particle size or crystalline order. If the change is due to the latter effect, it would suggest that two-step nucleation, in which a solid phase forms initially, followed by molecular rearrangement into crystals, may play a role in the cocrystal formation. (Erdemir et al., 2009; Nishida and Van Keuren, 2011).
Finally, Figure 7 shows spectra obtained at several positions along the continuous flow chamber after mixing in the double impinging jet mixer. Even at the shortest times that could be probed (90 ms), the CT peak is already prominent, and does not change significantly over the time frame that could be accessed with this apparatus. This indicates that the time scale for complexation is within the residence time in the mixing chamber. Similar rapid formation times in reprecipitation have been measured in other single component systems (Mori et al., 2009).
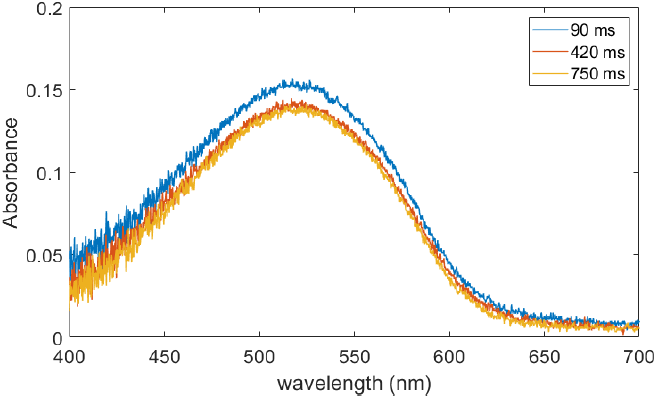
Source: Creation of the autors.
Figure 4 Short-time absorption spectra at several times after exiting the mixing chamber in the continuous flow apparatus.
These results all paint a similar picture for particle formation during reprecipitation. Complexation (dimerization) occurs on time scales less than 100 ms. The fluid mixing that is at the heart of reprecipitation occurs at various length scales, often referred to as macromixing, mesomixing and micromixing (Baldyga and Pohorecki, 1995). The latter will occur via molecular diffusion over length scales on the order of the average intermolecular spacing in the solution. Even at the concentrations in the diluted (post-reprecipitation) solutions, the average distance between donor and acceptor molecules in our samples is on the order of 10’s of nm. For a typical molecular diffusion coefficient of 2 × 10⁻¹⁰ m2/s, the corresponding diffusion times would be on the order of 10’s of microseconds. This matches well the fact that the peaks do not change significantly on times scales of 100’s of ms, and suggests a nearly complete complexation of donors and acceptors has occurred.
This complexation is followed rapidly by the growth of particles to sizes on the order of 10’s of nm within the first minute, followed by a slower growth, likely due to Ostwald ripening. (Kabalnov, 2001) This slower growth is also accompanied by red shifts in the absorption maximum. Since the CT band is associated with localized charge transfer from donor to acceptor, the red shift may be due to molecular reorganization leading to slight decreases in the donor-acceptor spacing in the cocrystals, thereby increasing the Madelung energy and decreasing the CT energy, as observed in pressure dependent spectra of numerous CT compounds (Torrance et al., 1981).
Conclusion
We demonstrated the formation of nano cocrystals of the charge transfer complex hexamethylbenzene:chloranil using the reprecipitation method. The rapid mixing required to form submicron sized particles was achieved using single jet injection, a 3D printed multi-inlet vortex mixer and a double impinging jet mixer. The time scales of the particle formation determined from DLS and the changes in the absorption spectra indicate that nonclassical nucleation is occurring: complexes formed on time scales shorter than 100 ms, while particles with sizes on the order of 100 nm radius formed within 30 seconds, and a slower rearrangement of the crystal leading to a red shift of the absorption maximum occurred over times on the order of 5 to 10 minutes.

