


 nova página do texto(beta)
 Inglês (pdf)
 Artigo em XML
 Referências do artigo
 Enviar este artigo por email
 Citado por SciELO
  Similares em
SciELO
Similares em
SciELO 
 Permalink
Introduction
Intra-abdominal infections are the second most frequent cause of sepsis worldwide, only surpassed by pneumonia. These infections can be classified as uncomplicated or complicated depending on their severity. Uncomplicated intra-abdominal infections seldom cause critical illness. On the contrary, complicated intra-abdominal infections, also referred to as “abdominal sepsis,” lead to localized or diffuse peritonitis and subsequent sepsis1. Determinants of complicated infections include patient susceptibility, age, and comorbidities, among others2.
Abdominal sepsis is distinguished by a systemic response to infection which initially develops within the organs of the abdominal cavity3. Up to ~5% of patients admitted to an intensive care unit (ICU) due to infectious diseases ultimately have abdominal sepsis4,5. Worldwide, it is a major cause of non-trauma deaths in emergency departments6 with mortality rates being as high as 40%7. Therefore, prompt recognition of the infection site and early antimicrobial therapy are essential to reduce mortality8. A control on the source of infection should occur within 6-12 h after diagnosis since each hour of delay is associated with higher mortality rates9.
Various scoring systems have been developed and validated to predict mortality in patients with abdominal sepsis, such as the Simplified Acute Physiology Score II (SAPSII), Modified Shock Index (MSI), and Mannheim Peritonitis Index (MPI), all of which allow for identification of patients at high mortality risk (e.g. MPI > 25 points)10. MPI is a mortality prediction index that assesses eight risk factors, with scores ranging from 0 to 47 points. Its sensitivity and specificity are deemed at 95.9% and 80%, respectively11,12.
In addition, numerous biomarkers such as procalcitonin, neutrophil-to-lymphocyte ratio, and C-reactive protein have also been assessed as potential mortality predictors. Most studies have addressed them separately, and few studies have addressed them concurrently13-17. On the other hand, the role of acid-base disturbances, though considered important predictors of adverse outcomes in sepsis18-20 since they reflect impairment at different levels of organ systems, has seldom been explored in the specific context of intra-abdominal infections, with the exception of serum lactate21,22.
For the above reasons, the interaction between different scoring systems and laboratory parameters, as well as their weight on mortality in patients with abdominal sepsis, has not been extensively studied. Furthermore, laboratory tests that assess acid-base balance are vast in number, making the identification of those that better explain mortality a priority. Thus, the goal of this study was to assess the association of laboratory parameters, SAPSII, MSI, and MPI scores with in-hospital mortality among ICU patients with abdominal sepsis.
Material and methods
Study design and patients
We conducted a single-center case–control study at the ICU of Hospital No. 14, Unidad Medica de Alta Especialidad (UMAE), Instituto Mexicano del Seguro Social (IMSS) in Veracruz, México, from May 2015 to May 2020. Inclusion criteria were patients ≥ 18 years with diagnosis of abdominal sepsis, defined as evidence of organ dysfunction characterized but not limited to oliguria, and delayed capillary refill and hypotension with an increase in Sequential Organ Failure Assessment (SOFA) score ≥ 2 points compared to baseline at admission, due to intra-abdominal infection regardless of etiology23 who were admitted to the ICU, on invasive mechanical ventilation, and vasopressor support with norepinephrine. Patients with incomplete medical records, a diagnosis of non-abdominal sepsis, a do-not-resuscitate order, and pregnant patients were all excluded from the study. Consecutive convenience sampling of patients was performed.
All patients were managed according to Surviving Sepsis Campaign guidelines24 and current Mexican Clinical Practice Guidelines25. The study protocol was approved by the Local Institutional Review Board (approval number: R-2019-1001-18) and the Mexican Federal Commission for the Protection against Sanitary Risks (COFEPRIS) (approval number: 17_CI_11020_146).
Definitions of outcomes, exposures, cases, and controls
The primary outcome was in-hospital death. Thus, cases were defined as patients who died in-hospital, whereas controls were patients who survived until discharge. Both cases and controls identified amid the entire study period were ascertained through review of patient records. Exposures were defined as presenting with an MPI > 25 points at admission, as well as increasing SAPSII and MSI scores, and the interaction between blood gases and serum laboratory parameters.
Source of data
Data were collected by a Critical Care medicine specialist and a postgraduate year four (PGY-4) General Surgery resident physician. Baseline characteristics (age, sex, and body mass index [BMI]), comorbidities (diabetes mellitus, hypertension [HTN], chronic kidney disease, chronic heart disease), laboratory parameters (arterial pH, arterial partial pressure of oxygen [PaO2], venous partial pressure of oxygen [PvO2], arterial partial pressure of carbon dioxide [PaCO2], venous partial pressure of carbon dioxide [PvCO2], arterial oxygen saturation [SaO2], central venous oxygen saturation [ScvO2], lactate, bicarbonate [HCO3], base excess [BE], venous-to-arterial carbon dioxide difference [DvaCO2], arterial oxygen content [CaO2], venous oxygen content [CvO2], serum anion gap [AG], corrected serum anion gap [cAG], apparent strong ion difference [SIDa], effective strong ion difference [SIDe], strong ion gap [SIG], hemoglobin [Hb], chloride [Cl−], sodium [Na+], albumin [Alb], alactic base excess [alactic BE], creatinine [Cr], urea [Ur], brain natriuretic peptide [BNP], procalcitonin [PCT]), norepinephrine dose (mcg/kg/min), and PaO2/FiO2 (arterial partial pressure of oxygen/fraction of inspired oxygen ratio) were collected at ICU admission. MSI, MPI (Supplementary Table 1), and Simplified Acute Physiology Score II (SAPSII) (Supplementary Table 2) were calculated for all patients. Cutoff value for MPI was deemed at < 25 for statistical purposes10. Formulae for calculation of clinical and laboratory parameters (such as BMI, AG, SIDa, SIDe, SIG, alactic BE, PaO2/FiO2 ratio, PvCO2, CaO2, CvO2, and MSI) are shown in supplementary Table 3. Age and sex were considered as confounding variables.
Table 1 Baseline characteristics of the study sample and comparison between survivors and non-survivors
| Name of Variable | Total simple (n = 60) | Survivors (n = 31) | Non-survivors (n = 29) | p-value |
|---|---|---|---|---|
| Age, years* | 57.7 (16.7) | 55.6 (17.3) | 60 (16) | 0.31 |
| Age categories** | ||||
| < 20 | 3 (5) | 2 (6.5) | 1 (3.4) | 1.0 |
| 21–39 | 3 (5) | 2 (6.5) | 1 (3.4) | 1.0 |
| 40–59 | 25 (41.7) | 14 (45.2) | 11 (37.9) | 0.57 |
| > 60 | 29 (48.3) | 13 (41.9) | 16 (55.2) | 0.30 |
| Female** | 37 (61.7) | 17 (54.8) | 20 (69) | 0.26 |
| Male** | 23 (38.3) | 14 (45.2) | 9 (31) | |
| Weight (kilograms)* | 77.3 (19.7) | 81.4 (19.5) | 72.5 (19.2) | 0.06 |
| Height (meters)* | 1.63 (0.9) | 1.63 (0.09) | 1.63 (0.09) | 0.87 |
| Body mass index, kg/m2** | ||||
| < 29.9 (normal) | 37 (61.7) | 15 (48.4) | 22 (75.9) | 0.02 |
| 30–34.9 (obesity class I) | 13 (21.7) | 9 (29) | 4 (13.8) | 0.15 |
| 35–39.9 (obesity class II) | 5 (8.3) | 4 (12.9) | 1 (3.4) | 0.35 |
| > 40 (obesity class III) | 5 (8.3) | 3 (9.7) | 2 (6.9) | 1.0 |
| Comorbidities | ||||
| Diabetes mellitus** | 21 (35) | 8 (25.8) | 13 (44.8) | 0.12 |
| Hypertension** | 27 (45) | 10 (32.3) | 17 (58.6) | 0.04 |
| Chronic kidney disease** | 6 (10) | 2 (6.5) | 4 (13.8) | 0.41 |
| Chronic heart disease** | 6 (10) | 1 (3.2) | 5 (17.2) | 0.09 |
| Laboratory parameters at admission | ||||
| pH * | 7.29 (0.08) | 7.31 (0.07) | 7.27 (0.08) | 0.07 |
| < 7.35** | 44 (73.3) | 20 (64.5) | 24 (82.8) | 0.11 |
| Arterial partial pressure of oxygen (PaO2), mmHg* | 120.7 (54.4) | 110.9 (56.4) | 131.2 (51) | 0.14 |
| Venous partial pressure of oxygen (PvO2), mmHg* | 39.7 (9.4) | 38.5 (8.1) | 40.9 (10.7) | 0.35 |
| Arterial partial pressure of carbon dioxide (PaCO2), mmHg* | 33.9 (7.2) | 35 (5.1) | 32.7 (9) | 0.24 |
| < 60 mmHg** | 4 (6.6) | 4 (12.9) | 0 (0) | 0.11 |
| Venous partial pressure of carbon dioxide (PvCO2), mmHg* | 39.6 (7.3) | 40.8 (5.3) | 38.2 (8.9) | 0.19 |
| Arterial oxygen saturation (SaO2), %* | 96.8 (3) | 96.2 (3.4) | 97.4 (2.5) | 0.13 |
| Central venous oxygen saturation (ScvO2), %* | 66.3 (12.7) | 65.8 (11.3) | 66.8 (14.3) | 0.77 |
| Lactate, mmol/L* | 4.1 (2) | 3.6 (1.5) | 4.7 (2.3) | 0.03 |
| Bicarbonate (HCO3), mmol/L* | 16.3 (3.5) | 17.1 (3.4) | 15.4 (3.6) | 0.07 |
| Base excess (BE), mmol/L* | −9.5 (5.2) | −8.1 (5.5) | −11.1 (4.3) | 0.02 |
| Venous-to-arterial carbon dioxide difference (DvaCO2), mmHg* | 5.6 (3.1) | 5.8 (2.2) | 5.5 (3.9) | 0.73 |
| Arterial oxygen content (CaO2), O2 ml per 100 ml of blood* | 12.3 (2.4) | 12.2 (2.3) | 12.3 (2.5) | 0.95 |
| Venous oxygen content (CvO2), O2 ml per 100 ml of blood* | 8.2 (2.1) | 8.1 (1.5) | 8.3 (2.6) | 0.68 |
| Serum anion gap, mmol/L* | 14.8 (6.4) | 13.8 (4.4) | 15.9 (7.9) | 0.21 |
| Corrected serum anion gap, mmol/L* | 19.8 (6.6) | 18.8 (4.4) | 21 (8.3) | 0.19 |
| Apparent strong ion difference (SIDa), mmol/L* | −3.8 (5.1) | −4 (3) | −3.5 (6.8) | 0.74 |
| Effective strong ion difference (SIDe), mmol/L* | 4.2 (1.5) | 4.2 (1.4) | 4.3 (1.6) | 0.68 |
| Strong ion gap (SIG), mmol/L* | −8 (5.4) | −8.2 (3.7) | −7.9 (6.8) | 0.84 |
| Hemoglobin (Hb), mg/dl* | 9.2 (1.9) | 9.2 (1.9) | 9.1 (1.9) | 0.78 |
| < 7.0** | 8 (13.3) | 4 (12.9) | 4 (13.8) | 1.0 |
| Chloride (Cl−), mmol/L* | 109.5 (6) | 110.1 (5.2) | 108.8 (6.7) | 0.41 |
| Sodium (Na+), mmol/L* | 140.7 (5.7) | 141.1 (5.5) | 140.2 (6) | 0.57 |
| Albumin (Alb), gr/dl* | 24.8 (6.1) | 25.1 (5.8) | 25.5 (6.4) | 0.68 |
| Alactic BE, mmol/L* | −13.7 (6.3) | −11.7 (6.4) | −15.8 (5.6) | 0.01 |
| Creatinine (Cr), mg/dl* | 2.8 (2.5) | 2.7 (2.2) | 3 (2.8) | 0.58 |
| > 1.2** | 46 (76.7) | 23 (74.2) | 23 (79.3) | 0.63 |
| Urea (Ur), mg/dl* | 97.3 (55.2) | 86.7 (50.7) | 108.5 (58.4) | 0.12 |
| Brain natriuretic peptide (BNP), ng/ml* | 679.7 (836.6) | 527 (614.4) | 842.9 (1008.4) | 0.15 |
| Procalcitonin (PCT), ng/ml* | 26.3 (23.9) | 26.5 (26.7) | 26 (21) | 0.93 |
| Scores at admission | ||||
| Modified shock index (MSI)** | ||||
| > 1.3 | 50 (83.3) | 26 (83.9) | 24 (82.8) | 0.90 |
| Mannheim peritonitis index (MPI)** | 0.001 | |||
| ≤ 25 | 36 (60) | 26 (83.9) | 10 (34.5) | |
| > 25 | 24 (40) | 5 (16.1) | 19 (65.5) | 0.19 |
| Simplified acute physiology score II (SAPSII)** | 0.73 | |||
| 41–52 | 6 (10) | 5 (16.1) | 1 (3.4) | 0.11 |
| 53–64 | 10 (16.7) | 6 (19.4) | 4 (13.8) | |
| 64–77 | 44 (73.3) | 20 (64.5) | 24 (82.8) | |
| Other characteristics | ||||
| Arterial partial pressure of oxygen/fraction of inspired oxygen ratio (PaO2/FiO2)** | ||||
| Mild | 36 (60) | 15 (48.4) | 21 (72.4) | 0.05 |
| Moderate | 22 (36.7) | 15 (48.4) | 7 (24.1) | 0.05 |
| Severe | 2 (3.3) | 1 (3.2) | 1 (3.4) | 0.96 |
| Norepinephrine, mcg/kg/min** | 0.39 (0.25) | 0.43 (0.25) | 0.34 (0.24) | 0.16 |
| ICU length of stay, days* | 5.8 (4.2) | 6.7 (3.7) | 4.9 (4.6) | 0.10 |
| Duration of mechanical ventilation, days* | 4.9 (4) | 4.9 (3.4) | 4.9 (4.6) | 0.99 |
*Mean, (standard deviation);
**Frequency, (percentage).
FiO2: fraction of inspired oxygen; ICU: intensive care unit; kg: kilogram; m2: square meter; mmHg: millimeters of mercury; O2: oxygen; PaO2: arterial partial pressure of oxygen.
Table 2 Univariate logistic regression analysis
| Model | β | OR | 95% CI | p-value |
|---|---|---|---|---|
| MPI | 2.290 | 9.87 | 3.07-36.61 | 0.0002 |
| SAPSII | 0.071 | 1.07 | 1.01-1.14 | 0.01 |
| MSI | −0.164 | 0.84 | 0.23-3.07 | 0.80 |
| PC1 | 0.759 | 2.13 | 1.12-4.76 | 0.04 |
| PC2 | −0.232 | 0.79 | 0.46-1.32 | 0.38 |
| PC3 | 0.191 | 1.21 | 0.73-2.05 | 0.46 |
| PC4 | −0.061 | 0.94 | 0.56-1.57 | 0.81 |
| PC5 | 0.067 | 1.06 | 0.64-1.80 | 0.79 |
| PC6 | −0.347 | 0.70 | 0.40-1.19 | 0.20 |
| PC7 | 0.051 | 1.05 | 0.63-1.77 | 0.84 |
| PC8 | 0.52888 | 1.69 | 1.00-3.07 | 0.06 |
OR: odds ratio, 95% CI: 95% confidence interval; MPI: Mannheim peritonitis index; SAPSII: simplified acute physiology score II; MSI; modified shock index; PC: principal component.
Table 3 Multivariate logistic regression analysis
| Model | Variable | β | OR | 95% CI | p-value |
|---|---|---|---|---|---|
| MPIa | MPI | 2.318 | 10.1 | 3.03-40.06 | 0.0003 |
| Sex | −0.78 | 0.45 | 0.12-1.04 | 0.22 | |
| Age | 0.007 | 1 | 0.94-1.04 | 0.67 | |
| SAPSIIb | SAPSII | 0.069 | 1.07 | 1.01-1.14 | 0.02 |
| Sex | −0.687 | 0.5 | 0.16-1.51 | 0.22 | |
| Age | 0.0104 | 1.01 | 0.98-1.04 | 0.54 | |
| PC1c | PC1 | 0.661 | 1.93 | 1.01-4.44 | 0.08 |
| Sex | −0.319 | 0.72 | 0.23-2.25 | 0.57 | |
| Age | 0.011 | 1.01 | 0.98-1.04 | 0.48 |
All models were adjusted by sex and age.
aHosmer and Lemeshow = 0.40, AUC = 0.79, AIC = 73.37;
bHosmer and Lemeshow = 0.70, AUC = 0.70, AIC = 82.9,
cHosmer and Lemeshow = 0.33, AUC = 0.66, AIC = 84.82.
AIC: Akaike information criterion; AUC: area under the curve; MPI: mannheim peritonitis index; SAPSII: simplified acute physiology score II: MSI; modified shock index; PC: principal component.
Statistical analysis
Sample size was calculated according to mortality risk estimates in patients with abdominal sepsis according to the MPI score since a relative risk of 3.62 has been reported for this scoring system26. We considered a mortality rate of 29.1% in the population of interest27, obtaining a final sample size of 41 individuals, allowing for a possible loss of 20%, with an alpha of 0.05 and a statistical power of 80%.
Quantitative continuous variables were presented as median and interquartile range or as mean and standard deviation (SD) where applicable, whereas dichotomous variables were presented as absolute frequency and percentage (%). For comparison between survivors and non-survivors, the Mann–Whitney U test or Student's t-test was applied for quantitative continuous variables, while Chi-square (χ2) or Fisher's exact test was applied for qualitative (categorical) variables.
A correlation analysis was also applied between laboratory variables by developing a correlation matrix with corresponding Spearman's rank correlation coefficients. Subsequently, an anti-image correlation matrix was applied to determine Kaiser–Meyer–Olkin measure of sampling adequacy (KMO).
A principal component analysis (PCA) was performed to reduce the laboratory dataset dimension and to increase interpretability. In addition, extraction communalities were estimated to acknowledge the proportion of explanation of the variance of each variable in the factor analysis; variables were considered important when they showed communality values > 0.9. Thereafter, principal components (PCs) were analyzed to obtain those that best explained total variance – defined as PC with eigenvalues > 1 and that altogether explained above 70% of the total variance. Similarly, a component score coefficient analysis was performed, defining high correlation components as those with absolute values > 0.5.
To determine the association of SAPSII, MSI, MPI, and PC with mortality, several logistic regression models were developed, considering each score and each PC as independent variables. MPI was introduced in the regression model as a binary variable (< 25 and > 25 points), while SAPSII and MSI were introduced as quantitative variables. Univariate analyses were performed followed by multivariate logistic regression models which were adjusted for age and sex to avoid model overfitting; variables were introduced by the Enter method. Collinearity assumptions were verified to assess that there was no collinearity of variables to create the multivariate models. Results are presented as regression coefficients (b) or Odds Ratios (OR) and 95% confidence intervals (95% CI). Model assumptions were verified by influential values of Cook's distance values (top 3 largest values) and standardized residuals. Goodness of fit of the multivariate logistic regression models was evaluated through Hosmer and Lemeshow test. Model performance was evaluated using the area under the curve (AUC) and Akaike information criterion (AIC). Statistical significance was defined as p < 0.05. All analyses and figures were performed using R studio V.1.0.153 and SPSS V.25.
Results
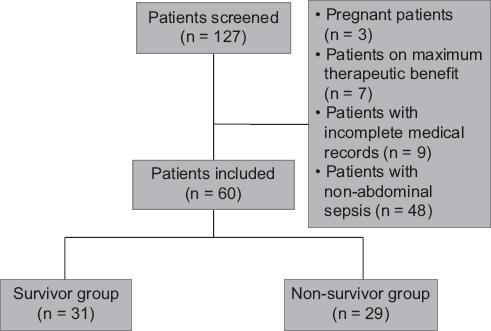
Out of 127 potentially eligible patients identified during the entire study period, 60 patients who met inclusion criteria were included for analyses (Fig. 1). Patient characteristics are shown in Table 1. Thirty-seven patients (61.7%) were female and mean age was 57.7 (SD: 16.7) years. Most patients were located in the > 60 years category (n = 29, 48.3%). HTN was the most frequent comorbidity (n = 27, 45%). Forty-four (73.3%) patients had a pH < 7.35 and 46 (76.7%) had a serum Cr > 1.2 mg/dl. Fifty (83.3%) patients had a MSI > 1.3 and 36 (60%) had an MPI score < 25 at admission. The most frequent SAPSII category was 64–77 points (n = 44, 73.3%). The mortality rate in the sample was 48.3% (n = 29). The non-survivor group had a higher frequency of HTN, higher lactate levels, and higher MPI scored, but lower BE and alactic BE levels. Comparison of characteristics of survivors against non-survivors is shown in table 1.
Correlation coefficients among laboratory variables are shown in Figure 2. Highly positive correlation occurred between SIDa and SIG (p = 0.96), AG and cAG (p = 0.97), CaO2 and Hb (p = 0.98), BE and alactic BE (p = 0.96), and PaCO2 and PvCO2 (p = 0.91), whereas perfect negative correlation was solely noted between SIDe and albumin (−1). The anti-image correlation matrix shows KMO values > 0.5 in all variables, which implies that all of the latter are suitable for PCA (Supplementary Table 4).
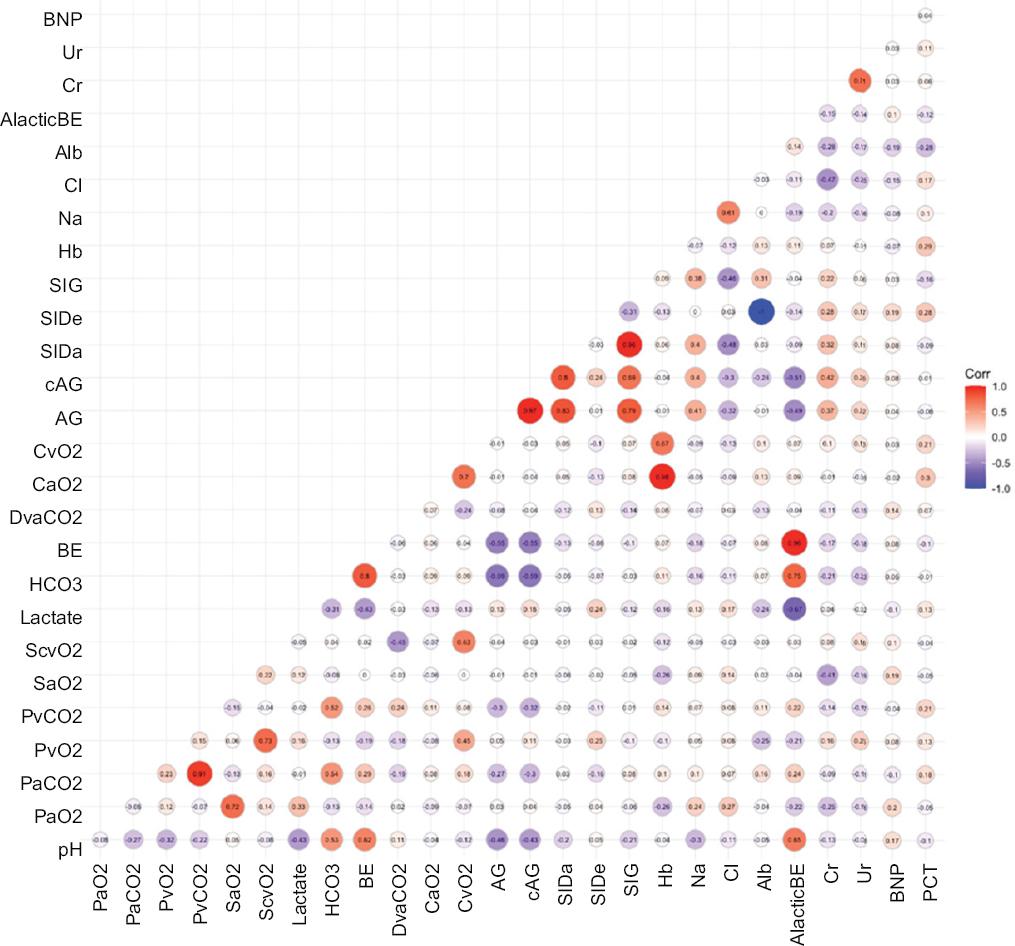
Figure 2 Heat map. Red color indicates a positive correlation between variables, while blue color indicates a negative correlation.
PCA retrieved 8 PC with the following eigenvalues: PC1 = 5.4, PC2 = 3.6, PC3 = 2.9, PC4 = 2.8, PC5 = 2.3, PC6 = 2.1, PC7 = 1.9, PC8 = 1.2 (Supplementary Table 5), and explaining: 20%, 13%, 11%, 10%, 9%, 8%, 7%, and 5% of the total variance, respectively. Altogether, the 8 PC explain 83% of the total variance, with a cumulative proportion of 93%. Table S6 shows laboratory variables that display high loading for PC: PC1: pH (−0.59), AG (0.9), cAG (0.92), alactic BE (−0.76), HCO3 (−0.77), and BE (−0.78); PC2: PaO2 (−0.46), lactate (−0.45), CaO2 (0.51), SIDa (0.60), SIG (0.67), Hb (0.58), and Cl− (−0.58); PC3: PvO2 (0.40), PaCO2 (0.69), CvO2 (0.68), and PCT (0.51); PC4: SIDe (−0.59), Na+ (0.56), Alb (0.59), Cr (−0.59), and Ur (−0.51); PC5: ScvO2 (0.69) and DvaCO2 (−0.47); PC6: PvCO2 (0.63); and PC7: SaO2 (0.45) and BNP (0.48). Table S6 also shows that variables PaO2, PvO2, PCT, Cr, ScvO2, Ur, PvCO2, SaO2, and BNP contributed the least in terms of variation to factor analysis since they showed extraction values of 0.78, 0.85, 0.80, 0.84, 0.88, 0.55, 0.85, 0.82, and 0.77, respectively.
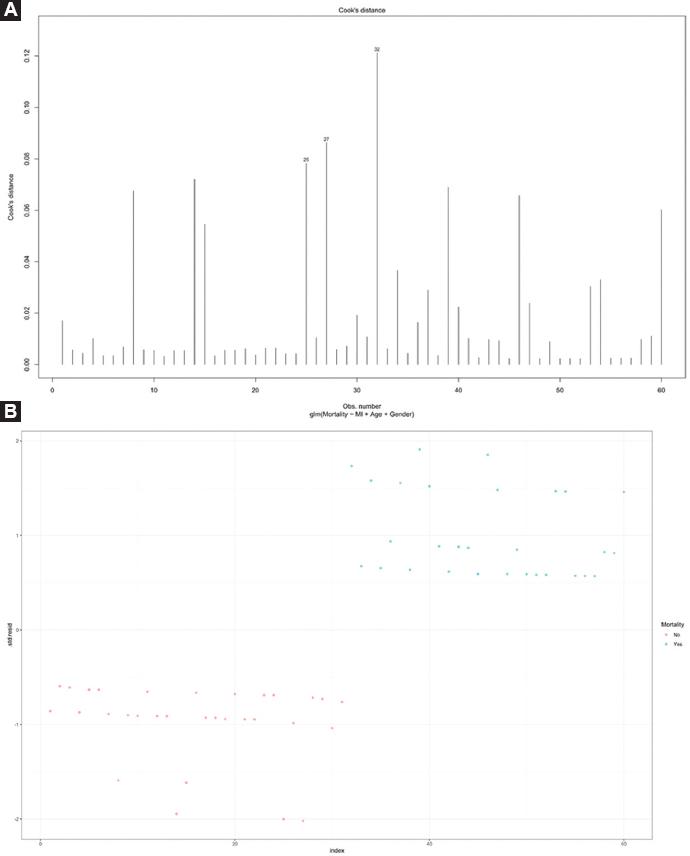
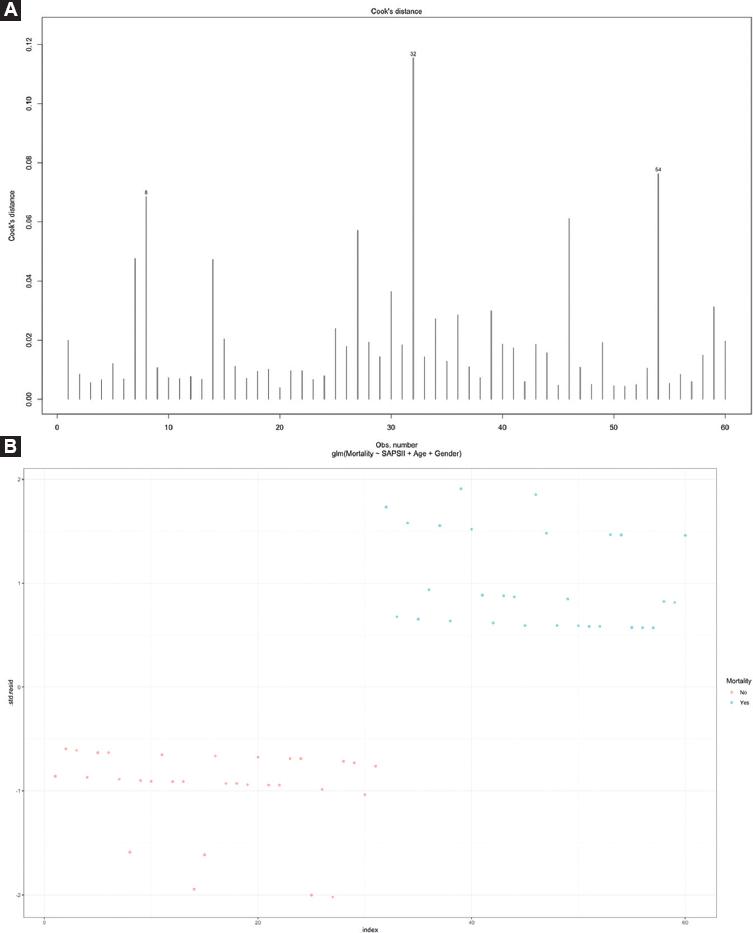
On logistic regression univariate analyses, MPI (OR = 9.87, 95% CI: 3.07-36.61, p = 0.0002), SAPSII (OR = 1.07, 95% CI: 1.01-1.14, p = 0.01), and PC1 (OR = 2.13, 95% CI: 1.12-4.76, p = 0.04) were significantly associated with patient in-hospital mortality (Table 2), whereas only MPI (OR = 10.1, 95% CI: 3.03-40.06, p = 0.0003) and SAPSII (OR = 1.07, 95% CI 1.01-1.14, p = 0.02) were significantly associated with mortality after adjusting for age and sex (Table 3). Both models MPI (Hosmer and Lemeshow = 0.40, AUC = 0.79, AIC = 73.37) and SAPSII (Hosmer and Lemeshow = 0.70, AUC = 0.70, AIC = 82.9) showed higher performance in comparison to PC1 (Hosmer and Lemeshow = 0.33, AUC = 0.66, AIC = 84.82). Model assumptions for MPI and SAPSII are shown in figures 3 and 4, respectively.
Discussion
We hypothesized that the scoring systems and laboratory parameters have different associations with in-hospital mortality in patients with abdominal sepsis. In logistic regression models, MPI, SAPSII, and PC1 were significantly associated with in-hospital mortality. Nevertheless, after adjusting for age and sex, only MPI, and SAPSII remained significantly associated with in-hospital mortality. In addition, we found that non-survivors showed a higher frequency of HTN, higher lactate levels, and higher MPI scores but lower BE and alactic BE levels.
To the best of our knowledge, this is the first study to simultaneously evaluate various scoring systems and biomarkers in abdominal sepsis patients. Our findings could suggest that initial and follow-up assessments of patients be based on the markers that were indeed associated with mortality. In that manner, the choice of a handful of relevant parameters could pave the way for a personalized medical approach in patients with abdominal sepsis. Nonetheless, it is also important to note that our findings are merely observational; hence, they should be viewed as hypotheses generators for future clinical studies, in which relevant markers are assessed as potential therapeutic targets.
Although PC1 – a linear combination of variables pH, AG, cAG, alactic BE, HCO3, and BE – was not statistically significantly associated with the outcome after adjusting for confounders, acid-base disturbances still play an important role in abdominal sepsis-associated mortality and their prognostic value should not be underestimated. Acidemia (pH < 7.35) remains a potentially fatal condition, mainly due to its effect on the cardiovascular system. The classification of acidemia on various subtypes such as metabolic (BE < −2 mEq/L and PaCO2 ≤ 42 mmHg), respiratory (BE ≥ −2 mEq/L and PaCO2 > 42 mmHg), and mixed (BE < −2 mEq/L and PaCO2 > 42 mmHg) acidemia is of paramount importance when determining appropriate treatment and prognosis. In fact, mortality in metabolic acidemia is as high as 11% when BE is < 6.7 mEq/L; in respiratory acidemia, it is of 6% when PaCO2 is > 51 mmHg, and in mixed acidemia, it is of 13% when pH is < 7.2328. A persistent state of metabolic acidosis harbors negative consequences on patient outcomes and it may also indicate progression of underlying causes. A standard base deficit clearance < 11% (within the first 24 h of ICU admission) increases the risk of mortality in patients with septic shock (< 11% = 65.1% mortality and > 11% = 36% mortality)29. A negative value of alactic BE indicates worsening of the renal function and, therefore, an impairment on the clearance of unmeasured anions and lactate. Thus, the more negative the alactic BE is, the greater the renal impairment and, most likely, the worse the prognosis30. Increased AG occurs mainly due to accumulation of unmeasured anions. Its highest utility is achieved when used on the differential diagnosis of metabolic acidosis, although it bears prognostic value as well. A recent study found that the greater the AG, the greater the mortality risk: AG ≥ 13 mEq/L (OR 1.02, 95% CI 0.75-1.40, p = 0.891), AG ≥ 15 mEq/L (OR 1.40, 95% CI 1.03-1.91, p = 0.031), and AG ≥ 17 mEq/L (OR 2.78, 95% CI 2.12-3.63, p < 0.001)31.
Even though PCT helps predict the occurrence of intra-abdominal infections after definitive surgery for intestinal fistulae32, infected necrotizing pancreatitis33, and it is also an early biomarker of intra-abdominal infections in post-operative patients with gastrointestinal malignancies34, this biomarker might not be as useful when used as a predictor of mortality in patients with abdominal sepsis, based on our findings.
We would like to draw attention to the fact that out of all the laboratory parameters included in PC1, HCO3 is also coincidentally an item in one of the scores associated with mortality (SAPSII). Although the statistical significance of PC1 was lost during multivariate analysis, this finding suggests that there might be room for including new laboratory parameters into the existing scoring systems that could further improve mortality risk estimates35,36.
In accordance with their AIC values, we conclude that MPI and SAPSII scoring systems are both equally associated with mortality. Differences observed in OR values are due to the taxonomy of the variables themselves, but the strength of association with mortality is not any different among them (Table 3). In our study, we considered MPI cutoff values as reported on the original paper37, proving significant association with in-hospital mortality, which is consistent with the literature38. Nonetheless, other studies have used cutoff values of > 21, while displaying sensitivity of 97.5% and AUC of 0.976.39 In addition, SAPSII showed optimal performance, in similar fashion to that reported by Sánchez-Casado et al.40 Besides association with mortality, SAPSII has also been associated with overall length of hospital stay41.
Finally, we want to emphasize that our findings are consistent with the literature regarding the relationship between HTN and adverse outcomes in sepsis patients since non-survivors showed a higher frequency of HTN. A recent study by Garg et al. showed that male gender, HTN, SOFA > 9, and increased creatinine were predictors for mortality in adult patients with diagnosis of sepsis requiring ICU care42. Moreover, it appears that HTN, along with other chronic medical conditions, might increase the risk of incident sepsis episodes43.
Limitations of our study include its retrospective nature, as well as potential sampling bias due to convenience sampling, and having used a selective study cohort, which limits generalizability of results. Since this study was developed in a low-resource hospital in Mexico, we were unable to assess important predictors which were unavailable (i.e., C-reactive protein, interleukin-6), whereas other variables were not presented since they are already included in the scores (i.e., leukocytes and bilirubin). In addition, we did not evaluate specific causes of abdominal sepsis. Another limitation is that even when the sample size was calculated to encounter differences in the main outcome according to MPI scores, it is possible that the study was underpowered to detect differences according to PCA groups. Furthermore, PCA is a technique for reducing the dimensionality of large datasets which can be challenging to interpret; for instance, it is difficult to acknowledge the most important characteristics of the dataset after calculating PC. Although reduction of dimensionality is useful, it does not come without a cost, given that the loss of information is a necessary part of this type of analysis. Balancing dimensionality reduction and loss of information are mandatory when applying PCA.
Conclusion
MPI and SAPSII are both equally associated with in-hospital mortality in abdominal sepsis patients admitted to the ICU. Acid-base disturbances play an important role in abdominal sepsis-related mortality, although they were not significantly associated with in-hospital mortality in our study when adjusting for age and sex. Larger studies are needed to confidently evaluate the association of pH, AG, cAG, alactic BE, HCO3, and BE with mortality in these patients to better understand pathophysiology of abdominal sepsis.

