


 nova página do texto(beta)
 Inglês (pdf)
 Artigo em XML
 Referências do artigo
 Enviar este artigo por email
 Citado por SciELO
  Similares em
SciELO
Similares em
SciELO 
 Permalink
Introduction
Septic arthritis (SA) is a rapidly destructive joint disease. It is a medical emergency with a high health-care burden that has been increasing over the past years1. The estimated incidence is around 2-10 per 100,000 inhabitants2,3. This disease is usually secondary to hematogenous bacterial spread to the joint. It first causes a local encapsulated infection leading to rapid cartilage degradation and subchondral bone loss4. The main risk factors for SA include preexisting joint disease, such as rheumatoid arthritis, and other diseases, such as diabetes5. The most common causative agent in all ages is Staphylococcus aureus in almost half of the cases6. However, it has been stated that the pathogen cannot be identified in almost 40% of cases7, this scenario has been associated with a longer hospital stay and increased mortality8. Rapid identification of the infected joint is essential for preserving joint function and to avoid a wide number of complications related to the disease. However, sometimes, both clinical presentation and laboratory testing parameters are not clear enough for an accurate diagnosis9. The most frequently used parameters besides the clinical presentation of the disease are C-reactive protein (CRP), the erythrocyte sedimentation rate (ESR), the white blood cell (WBC) count, and bacteria culture10, which can be performed in synovial fluid (SF) and blood. Recent studies have shown the probable diagnostic capability of certain SF biochemical markers during SA, such as glucose and leukocyte esterase11-13. Healthy SF and blood contain an almost equivalent glucose concentration14. During an inflammatory infectious process, immune cells demand a greater consumption of nutrients, such as glucose for their metabolism15. Granulocytes, such as neutrophils, contain large glycogen deposits that can be used as intracellular fuel when extracellular glucose levels are limited16. Due to this fact, and that some bacteria, such as S. aureus, have unique carbohydrate transporters that facilitate maximal uptake of host sugars17, the SF glucose concentration might be a reflection of high bacteria metabolism. In this study, we assessed whether biochemical markers in SF such as glucose, leukocyte esterase, and pH could be useful, fast, and inexpensive additional diagnostic parameters for bacterial SA.
Materials and methods
Study group
Adult patients with SA were prospectively enrolled in the emergency and orthopedics department between July 2018 and October 2019. Rapid onset clinical manifestations such as pain, joint warmth, swelling, and a decreased ability to move the joint were evaluated by a physician. Elevated levels of acute-phase reactants such as CRP, ESR, and/or an elevated WBC count were used as inclusion criteria. Exclusion criteria were patients under 18 years of age and patients treated with antibiotics and/or steroids 2 weeks before recruitment. Low quality and quantity of samples and an incomplete medical record were used as elimination criteria. Adults with knee osteoarthritis, meniscus injuries, or knee ligament lesions with no other comorbidity were enrolled as a control group, and samples were collected during the programmed surgery.
Informed consent was obtained from patients and control subjects who participated in this study. A review of the medical history of all subjects and patients enrolled in this study was performed. The local research and ethics in research committees approved this study (IN18-00004).
SF sample collection
SF samples were obtained from the affected joints by arthrocentesis/arthrotomy. Samples collected from each patient and control subject were transferred to the laboratory within 30 min of collection in a sterile tube for microbiological analyses, and in a potassium oxalate/sodium fluoride tube for biochemical assays.
Microbiological analysis
Samples were transported in a sterile tube for microbiological processing. Two different culture methods were used to detect bacterial growth in the samples. For the traditional technique, 1-3 mL of SF were aseptically inoculated in Brucella broth (Difco, Detroit, MI, USA) blood culture vials. Inoculated vials were incubated at 37°C for 72 h or earlier in case turbidity was evident. Finally, an aliquot of 1 mL was taken from the vial for bacterial culture and direct Gram stain.
Samples were also processed in parallel in an automated culture system using the BD BACTEC FX40 instrument (Becton Dickinson). Briefly, 1-3 mL of SF were aseptically inoculated in BD Peds Plus medium culture vials (Becton Dickinson, Berkshire, United Kingdom), according to the manufacturer’s instructions. Inoculated vials were incubated in the instrument following the standard protocol of 7 days. If microbial growth, in terms of fluorescence readings, was detected by the instrument in a particular vial, an alarm was activated, and the vial was removed for subsequent analysis. At the end of the incubation period, and without alarms activated, the remaining vials were removed from the instrument and reported as negative. A 1 mL aliquot was taken from the positive vials at the moment of detection for bacterial culture and direct Gram stain.
For both microbiological culture methods, all aliquots were centrifuged at 4000 rpm for 10 min. Supernatants were safely discharged and the pellets were suspended in 250 mL of sterile saline. Finally, 50 mL of each bacterial suspension was streaked onto blood agar (BA), azide BA, chocolate agar (CHA), and eosin methylene blue agar. Inoculated plates were incubated at 37°C for 72 h, with 10% CO2 only for BA and CHA. Bacterial isolates were identified by conventional biochemical systems and were stored as frozen stocks at −20°C in nutritive broth supplemented with 20% glycerol.
Cellular and biochemical SF analysis
SF glucose levels, pH, and leukocyte esterase were measured as biochemical parameters using a glucometer (LifeScan OneTouch UltraEasy, Milpitas, California) and colorimetric test strips (Erba Mannheim Dekaphan Laura, London, United Kingdom), following the manufacturer’s instructions. Giemsa stain was also performed to determine the differential WBC count, especially the percentage of polymorphonuclear leukocytes (PMNs).
Blood analysis
Peripheral blood samples were collected from patients and control subjects to measure inflammatory, infection, and biochemical parameters such as CRP, ESR, and WBC count; glucose concentrations were determined as routine laboratory tests.
Statistical analyses
Statistical analyses were performed using Prism GraphPad 8 (San Diego, California). The Mann–Whitney non-parametric Gaussian distribution test was used between two groups of data. For analyzing more than 2 groups, the non-parametric Kruskal–Wallis and Dunn’s multiple comparison tests were used. Fisher’s exact test was used to compare automated and traditional microbiological culture systems. A ROC curve was made to compare different biochemical parameters in SF and blood samples. p < 0.05 was considered statistically significant.
Results
Demographic and clinical characteristics of the patients
Thirty-two patients with suspected SA were included in this study. Twenty patients met the criteria for continuing in the research protocol. Furthermore, 19 control subjects were enrolled as the non-infective group in which knee ligament lesions in 8 (42%), meniscus lesions in 6 (31.5%), and osteoarthritis in 5 (26.3%) were observed. Twelve control subjects (63.15%) were men with a median age of 39.50 years; women’s median age in control subjects was of 62 years. Thirteen SA patients (65%) were men with a median age of 54 years, while women presented a median age of 79 years. Diabetes mellitus was the most common disease found in the medical history of the patients (50%) followed by hypertension (25%). A median body mass index (BMI) of 27 and 24 was observed in male and female patients, respectively. The clinical evolution of the disease in the patients had a median of 11.50 days. All the patients had a monoarticular disease and the affected joints were the knee in 17 patients (85%), the shoulder in 2 patients (10%), and the elbow in 1 patient (5%) (Table 3).
Table 1 Characteristics of patients and controls subjects
| Controls | Patients | |
|---|---|---|
| n | 19 | 20 |
| Male | 12 (63.15%) | 13 (65%) |
| Female | 7 (36.8%) | 7 (35%) |
| Age in years (median, IQR) | 46 (22-62) | 55 (42.75-78) |
| Male age in years (median, IQR) | 39.50 (21.25-47.50) | 54 (36.50-67.50) |
| Female age in years (median, IQR) | 62 (50-72) | 79 (54-84) |
| BMI (median, IQR) | 28 (24-30) | 27 (22.31-29) |
| Male BMI (median, IQR) | 27 (23.25-31.50) | 27 (23.62-29) |
| Female BMI (median, IQR) | 29 (27-30) | 24 (19-29) |
| Pathological history | Knee ligament lesion, 8 (42.1%) Meniscus lesion, 6 (31.5%) Osteoarthritis, 5 (26.3%) |
None 3 (15%) Single pathological history, 5 (25%) Multiple pathological history, 12 (60%) DM, 50% HTN, 25% Others (OA, RA, asthma, COPD, and pneumonia), 25% |
| Alcohol users | 15% | 15% |
| Smokers | 5% | 15% |
| Drugs users | 0% | 10% |
| Clinical course days (median, IQR) | N/A | 11.5 (5.5-30) |
| Affected joint | N/A | Knee 17 (85%) Shoulder 2 (10%) Elbow 1 (5%) |
| Outerbridge classification | N/A | I-4 (20%) II-11 (55%) III-1 (5%) IV-4 (20%) |
| Positive synovial fluid culture | 0 | 12 (60%) |
| Negative synovial fluid culture | 19 (100%) | 8 (40%) |
Table 2 Microorganisms isolated from SF of patients with SA
| Monoinfection | Coinfection | ||
|---|---|---|---|
| Bacterium | No. of patients | Bacteria | No. of patients |
| Staphylococcus aureus | 7 (58.3%) | Staphylococcus aureus/ coagulase-negative staphylococci/ Streptococcus mitis | 1 (8.3%) |
| Methicillin-resistant Staphylococcus aureus | 1 (8.3%) | Staphylococcus aureus/Citrobacter freundii/Citrobacter diversus/Pseudomonas aeruginosa | 1 (8.3%) |
| Staphylococcus epidermidis | 1 (8.3%) | ||
| Micrococcus spp. | 1 (8.3%) | ||
| Total | 10 (83%) | Total | 2 (17%) |
*Percentage based on positive culture patients.
Table 3 Laboratory peripheral blood WBC values in patients with SA and controls
| WBC type | Controls median (25-75% percentiles) | Patients median (25-75% percentiles) | Mann–Whitney p-value |
|---|---|---|---|
| Neutrophils, K/mL | 4.42 (3.79-5.42) | 9.47 (6.71-16.78) | < 0.0001 |
| Neutrophils, % | 57.60 (50.40-65) | 78.95 (69.63-84.35) | < 0.0001 |
| Lymphocyte, K/mL | 2.22 (2.01-2.91) | 1.69 (1.14-2.45) | 0.0188 |
| Lymphocyte, % | 29.60 (25.40-36.60) | 12.40 (7.06-18.43) | < 0.0001 |
| Monocyte, K/mL | 0.55 (0.44-0.63) | 0.73 (0.62-1.36) | 0.0026 |
| Monocyte, % | 7.49 (5.80-8.17) | 6.23 (5.07-8.58) | 0.3541 |
| Eosinophils, K/mL | 0.15 (0.12-0.23) | 0.05 (0.01-0.13) | 0.0036 |
| Eosinophils, % | 2.36 (1.48-2.85) | 0.27 (0.07-1.38) | < 0.0001 |
| Basophils, K/mL | 0.06 (0.05-0.08) | 0.11 (0.06-0.25) | 0.0501 |
| Basophils, % | 0.01 (0.72-1.14) | 0.71 (0.24-0.93) | 0.0074 |
| Total WBC | 7.78 (7.17-8.58) | 12.40 (10.73-19.18) | < 0.0001 |
Controls, n = 19, patients, n = 20. P < 0.05 was considered statistically significant. The values are shown as medians and IQR. Mann–Whitney U-test. WBC: white blood cell, SA: septic arthritis.
Staphylococcus aureus was the most common isolated organism in SA patients
Twelve of the SF cultures (60%) of the SA patient group were positive, while in the rest of the cultures (40%) of this group, isolation and identification of the pathogen were not possible (Table 1). One etiological agent was found in 10 cases, which represents the 83% of the positive cultures, while multiple pathogens were detected in 2 cases (17%). S. aureus was the most frequently isolated organism, identified in more than the half of the monoinfection cases and in all of the coinfection cases. Methicillin-resistant S. aureus (MRSA), Staphylococcus epidermidis, and Micrococcus spp. were found equally in 8% of the monoinfection cases (Table 2). All subjects in the control group were negative for SF microbiological cultures as shown in Table 1. Regarding the comparisons between the BACTEC automated culture system and the traditional culture technique, data showed that the pathogen was isolated and identified in 35% and 55% of the cases, respectively (p > 0.05), as shown in figure 1. In 25% of the cases, the pathogen was only identified by the traditional culture technique compared to 5% with BACTEC. Both systems were able to detect coinfections in the cultures. The general congruency between traditional and automated cultures was 70%.

Figure 1 Comparison between traditional culture technique and the BACTEC automated system. The traditional culture showed 55% (11 cases) positive culture results and 45% negative cultures. Automated culture results were 35% positive (7 cases) and 65% negative (13 cases). Fisher’s comparison test showed p > 0.05.
Bacterial SA patients showed higher levels of WBC, CRP, and ESR
Our results showed that the serum WBC of patients with SA was almost 2 times higher than the values of the control group (p < 0.0001). SA patients doubled the amount of blood neutrophils (p < 0.0001) and had almost 22% more of these cells in the PMNs differential count (p < 0.0001). SA patients presented almost half of the lymphocytes number and almost half percentage of these cells when compared to the control subjects’ values (p < 0.05) (Table 3).
In addition, patients with a positive culture showed almost 10% more neutrophils (p = 0.0496) and nearly 8% fewer lymphocytes (p = 0.0473) when compared to the patients with a negative culture. On the other hand, eosinophils and basophils percentage was almost 1% higher in those patients with a negative SF culture (p < 0.05), table 4.
Table 4 Laboratory peripheral blood WBC values in patients with and without an isolated organism
| WBC type | Patients with negative SF culture median (25-75% percentiles) | Patients with positive SF culture median (25-75% percentiles) | Mann–Whitney p-value |
|---|---|---|---|
| Neutrophils, K/mL | 9.10 (6.47-9.55) | 13.60 (6.71-18.28) | 0.2083 |
| Neutrophils, % | 73.25 (68.83-79.80) | 82.95 (71.28-86.50) | 0.0496 |
| Lymphocyte, K/mL | 1.81 (1.19-2.71) | 1.61 (0.91-2.36) | 0.5208 |
| Lymphocyte, % | 16.50 (12.15-21.60) | 9.14 (5.70-15.05) | 0.0473 |
| Monocyte, K/mL | 0.73 (0.61-0.84) | 0.74 (0.62-1.65) | 0.5714 |
| Monocyte, % | 6.32 (5.07-10.14) | 6.23 (4.20-8.41) | 0.8065 |
| Eosinophils, K/mL | 0.08 (0.04-0.25) | 0.02 (0.004-0.079) | 0.0670 |
| Eosinophils, % | 1.12 (0.27-2.09) | 0.09 (0.02-0.67) | 0.0121 |
| Basophils, K/mL | 0.10 (0.07-0.14) | 0.12 (0.04-0.34) | 0.7770 |
| Basophils, % | 1.02 (0.78-1.13) | 0.34 (0.14-0.72) | 0.0002 |
| Total WBC | 12.05 (12-12.68) | 16.25 (9.90-19.55) | 0.3830 |
Patients with a negative SF culture n = 8; patients with a positive SF culture, n = 12. The values are shown as medians and IQR. P < 0.05 was considered statistically significant.
Mann–Whitney U-test
WBC: white blood cell, SF: synovial fluid.
Blood CRP and ESR showed higher concentrations in SA patients when compared to those of the control group (p < 0.0001 and p = 0.0011, respectively) (Fig. 2A and B). Moreover, the patients with a positive SF culture had the highest levels of CRP (p < 0.0001) and ESR (p = 0.0025) (Fig. 2C and D). Interestingly, a positive correlation was found between the BMI of the patients with a positive SF culture and the ESR levels (p = 0.0377) (Fig. 3).

Figure 2 Peripheral blood ESR and CRP values in control subjects and SA patients with and without an isolated organism. A: erythrocyte sedimentation rate in control subjects and SA patients. B: C-reactive protein in control subjects and SA patients. C: erythrocyte sedimentation rate in control subjects and SA patients with and without isolated agent. D: C-reactive protein in control subjects and SA patients with and without isolated agent. Top and bottom horizontal lines of the boxplots indicate 75th and 25th percentiles, respectively; lines within the box indicate median values. Control subjects, n = 19. SA patients with a negative SF culture, n = 8, SA patients with a positive SF culture, n = 12. A and B: Mann–Whitney U-test. C-D: Kruskal–Wallis; Dunn’s multiple comparison. p < 0.05 was considered statistically significant. SA: septic arthritis.

Figure 3 Correlation between BMI and ESR in septic arthritis patients with a positive culture. Spearman’s correlation with a 95% confidence interval of 0.04008-0.8821.
An elevated neutrophil percentage was found in the SF of SA patients (p < 0.0001). This value was 75% higher in patients when compared to the control group which had not detectable neutrophils (Table 5). However, regardless of the fact that the difference was evident between the patients with no isolated microbiological agent and the control group (p = 0.0008), no difference was observed between the patients with and without positive cultures as shown in figure 4. In contrast, monocytes were more abundant and showed a major difference (p = 0.0069) in the control group when compared to the SA patients (Table 5).
Table 5 Cell count percentage in SF from patients with SA and controls
| Cell count % | Controls median (25-75% percentiles) | Patients median (25-75% percentiles) | Mann–Whitney p-value |
|---|---|---|---|
| Neutrophils | 0 (0-0) | 75 (35-82) | < 0.0001 |
| Eosinophil | 0 ± 0 | 0 (0-1) | 0.0080 |
| Basophil | 0 ± 0 | 0 (0-1) | 0.0031 |
| Monocyte | 50 (10-60) | 11 (7-36) | 0.0069 |
| Lymphocyte | 30 (10-50) | 13 (8-21) | 0.2030 |
Controls n = 19, patients n = 20. The values are shown as medians and IQR. P < 0.05 was considered statistically significant. Mann–Whitney U-test
SF: synovial fluid, SA: septic arthritis.

Figure 4 Cell count with differential shows the percentages in SF from controls subjects and SA patients with and without an isolated organism. A: neutrophils. B: eosinophils. C: monocytes. D: basophils. E: lymphocytes. Top and bottom horizontal lines of the boxplots indicate 75th and 25th percentiles, respectively; lines within the box indicate median values. Control subjects n = 19. SA patients with a negative SF culture, n = 8; SA patients with a positive SF culture n = 12. p < 0.05 was considered statistically significant. Kruskal–Wallis–Dunn’s multiple comparison. SA: septic arthritis; SF: synovial fluid.
Bacterial SA patients showed lower levels of glucose in SF
SA patients showed almost half of the SF glucose levels compared to the control group (p = 0.0018) (Fig. 5A). Patients with SA and a positive culture had the lowest SF glucose concentration (p = 0.0004),(Fig. 5B). Blood and SF glucose levels were compared, our data showed that control subjects and patients with a negative SF culture had no significant difference in glucose levels (p = 0.1428 and p = 0.2050, respectively) (Fig. 5C and D). On the other hand, this comparison showed a statistically significant difference with almost 4 times less concentration of SF glucose in those patients with a positive SF culture (p < 0.0001), figure 3E. In the ROC curve analysis, SF glucose levels in those patients with a positive culture showed an area under the curve (AUC) of 0.91, 95% CI 0.7927-1, (p = 0.0001), figure 4E.
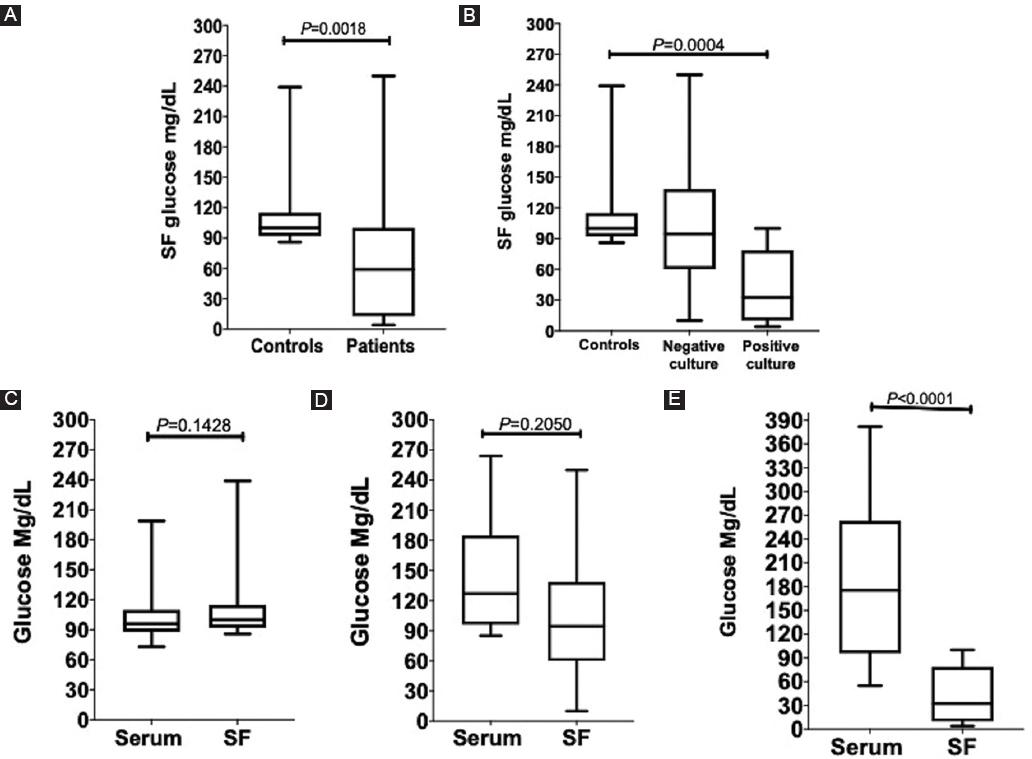
Figure 5 SF and serum glucose levels comparisons in controls and patients. A: control subjects and septic arthritis SA patients. B: control subjects and SA patients with a negative and positive culture. Glucose levels comparisons between serum and SF. C: control subjects. D: SA patients with a negative culture. E: SA patients with a positive culture. Mann–Whitney U-test and Kruskal–Wallis–Dunn’s multiple comparison; p < 0.05 was considered statistically significant. Top and bottom horizontal lines of the boxplots indicate 75th and 25th percentiles, respectively; lines within the box indicate median values. Control subjects, n = 19. SA patients with a negative SF culture, n = 8; SA patients with a positive SF culture, n = 12. SA: septic arthritis; SF: synovial fluid.
Higher levels of leukocyte esterase and a more acidic microenvironment were seen in SF of SA patients
SA patients showed higher LE values (p < 0.0001) when compared to the control group, in which this parameter was not detected (Fig. 6A). Patients with a positive culture showed the highest LE values (p < 0.0001) (Fig. 6B). However, SF-negative culture patients also presented a higher LE concentration than the control group (p = 0.0007) (Fig. 6B). No statistically significant difference was observed in the LE concentration between the SF-positive and -negative culture groups.

Figure 6 Comparison between SF, LE, pH, and glucose levels with serum CRP and ESR. LE levels in SF. A: control subjects and SA patients; B: control subjects and SA patients without and with an isolated agent; pH levels in SF. C: control subjects and SA patients. D: control subjects and SA patients without and with an isolated agent. E: ROC curve analysis between serum CRP, serum ESR, SF glucose, and SF pH levels in SA patients with positive SF culture. Mann–Whitney U-test and Kruskal–Wallis–Dunn’s multiple comparison; p < 0.05 was considered statistically significant. Top and bottom horizontal lines of the boxplots indicate 75th and 25th percentiles, respectively; lines within the box indicate median values. Control subjects, n = 19; SA patients with a negative SF culture, n = 8; and SA patients with a positive SF culture, n = 12. LE: leukocyte esterase; SA: septic arthritis; SF: synovial fluid.
Regarding the pH, SA patients had a more acidic level in SF than the control group (p < 0.0001) (Fig. 6C). This phenomenon was observed in both patients with positive and negative SF culture (Fig. 6D).
SF glucose levels as a novel infection marker
SF glucose concentrations showed an AUC of 0.91 with a strong statistical significance (p = 0.0001). The best cutoff value, < 85.5 mg/mL, showed a sensibility of 83.33% (95% CI: 55.20-97.04%) with a 100% (95% CI: 83.18-100%) of specificity. At its best cutoff value of > 2.95 mg/L, CRP serum levels AUC was 1 (p < 0.0001), at which the level of sensibility and specificity was 100% (95% CI: 75.75-100%) and 100% (95% CI: 83.18-100%), respectively. Despite this, SF glucose might still be more accessible due to its easy, quick, and reliable results. SF pH also showed a strong statistical significance (p < 0.001) with an AUC of 0.92 and a sensibility of 91.67 (95% CI: 64.61-99.57%) and a specificity of 84.21 (95% CI: 62.43-94.48%) at its best cutoff value, < 7.5. ESR presented the weakest results with an AUC of 0.84 (p = 0.0016), a sensibility of 100% (95% CI: 75.75-100%), and specificity of 73.68% (95% CI: 51.21-88.19%) at its best cutoff value of >30.50 mm/h; however, this is still a statistically significant parameter to be considered, figure 4E.
Discussion
In patients with a rapid atraumatic joint effusion with functional joint limitations, a prompt exclusion of an intra-articular infective etiology is necessary to prevent excess morbidity and mortality18,19. However, because laboratory and clinical findings are sometimes misleading, and bacterial isolation and identification are not always possible, we assessed if biochemical parameters such as glucose, LE, and pH might be used as rapid and inexpensive additional diagnostic criteria for SA.
The majority of our SA patients (65%) were men, as reported in the previous studies20-24. No scientific explanation for this phenomenon was found by our team; however, a reasonable justification would be that usually more men are involved in certain activities that could lead to direct inoculation of bacteria into the joint. Women were more commonly affected at an older age than men probably due to the genomic differences between sexes, which have been reported to increase after 65 years of age with a higher innate and pro-inflammatory immune response in men than in woman25. Several risk factors or medical conditions might be associated with an increased risk of developing SA. Half of our patients had a medical history of diabetes mellitus, which by itself increases susceptibility not just for joint infections but for all types of infections due to the effects of hyperglycemia in the body; these could also affect the immune system where it has been found to cause defects on phagocytosis, neutrophil migration, and impaired intracellular killing of microorganisms, among other effects like decreased vascular dilation which affects the initial inflammatory response26. Probably, because the knee is the largest joint in the human body, it is also the most commonly affected, as shown in our patients. However, another explanation would be based on the fact that bacteria, especially S. aureus, have certain tropism for various body tissues. This is thought to be due to the presence of microbial surface components recognizing adhesive matrix molecules (MSCRAMMs), which are surface proteins that enable bacteria to attach to extracellular matrices, among these, collagen, elastin, and fibrinogen27,28, which are major components of the joints and more abundant in larger joints. A delay with a median of 11.5 days was observed in the patients until they arrived at our hospital for medical attention. This may be attributed to the need of traveling long distances, low socioeconomic status, lack of education, and treatment with alternative methods.
It is well known that in approximately half of the SA cases, the etiologic agent might not be identified29. As shown in our results, in 40% of our SA patients, the detection and isolation of the bacteria were not possible. We must consider that a negative culture does not always mean that a SA diagnosis was incorrect. There might be several factors which can affect the isolation and identification of bacteria, such as the use of antibiotics before sampling, to the fact that maybe the pathogen was not present in the joint or was already eliminated at the moment of sampling, where toxins and superantigens might have a prominent role30,31 or inadequate culturing conditions for non-common bacterial joint infections.
More than half of our patients had S. aureus as the infective agent, either as the only etiological agent or in the presence of other pathogens in polymicrobial infected joints. It is well known that this pathogen is the most common cause of all three major classes of osteoarticular infections (native joint SA, osteomyelitis, and periprosthetic joints infections)32. This probably is due to the special characteristics mentioned above which make it have a special tropism for this type of tissue. We decided to compare two different microbe detection methods, the traditional technique, and the automated culture system. This, using the BD BACTEC FX40 instrument with 1-3 mL of SF, inoculated in BD Peds Plus medium culture vials. We used this type of vials because of their accepted inoculum size, 1-3 mL, which was approximately the quantity of SF obtained from our patients. In our results, both methods were able to detect or not the infective agents without a significant statistical difference with a total congruency of 70%. This, unlike the only other study making this comparison involving SF and SA found by our team, which indicates a superior performance of the BACTEC system over traditional culture methods33. However, we must take into consideration the sample size difference, which was smaller in our study.
Conventionally, SF WBC counts have been used as a diagnostic parameter for SA but due to its lack of sensitivity34, we decided to specifically use the % of PMNs, which has been demonstrated to be a more sensitive marker for joint infection than the SF WBC35. Neutrophils are indispensable cells that form the first line of defense against invading pathogens in the early stages of infection36. It is no surprise that these were the most abundant cells in SF from our SA patients. These cells probably have a dual role in the evolution of the disease, being the most crucial immune cells for better survival rates and a less severe disease as demonstrated in an experimental model37, but also by being a cause of collateral joint damage during or after pathogen clearance36. The fact that the patients without an isolated microbiological agent had also more neutrophils than the control group may lead us to think that not all the negative cultures always mean a lack of infection or pathogen. The role of monocytes during a sterile inflammation has not been fully studied; however, this type of cells can be critical in inflammatory processes for an adequate healing and tissue recovery38. All our control subjects were negative for culture and had a non-infectious inflammatory disease or lesion. Nevertheless, we must consider that the elevated monocyte percentage in the control group could also be due to the fact that patients with OA were also included, a disease in which monocytes are the dominant cells39.
It has been demonstrated that peripheral blood WBC, ESR, and CRP levels by themselves have a poor diagnostic potential for SA40,41. Essentially, ESR and CRP are inflammation markers that may be present in high concentrations due to many inflammatory processes. Among these, obesity, which has been described to correlate with inflammation through adipose tissue42 and probably the reason why we found a positive ESR correlation with the BMI of our patients.
An infection will consequently cause an inflammatory process that will increase the levels of these acute-phase reactants as shown in our patients. While these inflammatory markers were higher in our SA patients, they are not recommended to be used as reliable tests for changing or making decisions on the patients’ management41 and definitively not as an infection marker. Although our SA patients with a positive culture showed the highest levels of CRP and ESR when compared to the control group, no difference was found when compared to the negative culture patient group.
Because the most common etiological agents of SA are glucose-consuming bacteria, we evaluated the clinical usefulness of measuring SF and serum glucose levels. Glucose measurement during infective joint processes has been little appreciated. We found that SF glucose concentrations in the control group were higher to those in the SA group and this difference was even higher when compared to the positive culture patient group, supporting the validity of other studies11,43. To verify that this glucose decrease was indeed due to bacterial and local metabolism, we compared the SF glucose concentration with the patients’ serum concentrations. Our findings showed that the quantitative measurement of this parameter was impaired in patients with a positive culture. To the best of our knowledge, there is no other medical joint condition that can cause this drastic impairment of glucose levels, not even non-infectious inflammatory conditions such as those in our control group. These findings were supported at the moment of determining the SF leukocyte esterase, which presented the highest concentration in patients with a positive culture indicating an active infective inflammatory process. Since SA is associated with a high local glucose consumption and WBC counts the local microenvironment will be affected, into an acidic pH44. This last was corroborated in our study in which a more acidic pH was found in those patients with a positive culture. This change in the SF pH could have clinical implications by affecting the efficacy of antibiotics45, inhibiting the chemotaxis and bactericidal mechanisms of polymorphonuclear cells, as well as lymphocyte proliferation and cytotoxic activity46,47.
As with the majority of studies, the design of the present research is subject to limitations. One possible limitation was the number of patients included in the research which needs to be bigger for making more objective conclusions. Another limitation is regarding the control subjects. We avoided unethical behavior and difficulties from obtaining SF from healthy people without pathologies or injuries, which is a painful procedure and ironically may cause SA. That is why besides the inflammatory control group of osteoarthritis, we decided to consult with joint diseases experts and opted to include patients with meniscus tears and knee ligament lesions, whose SF is probably the closest to normal and had a programmed surgery for taking SF samples.
Conclusion
The determination of SF glucose and leukocyte esterase levels may be considered as helpful biochemicals parameters for clinical diagnosis of bacterial SA. With the clinical evaluation of the patient, these parameters could be potentially considered as valid added values for supporting joint infection diagnosis.

