


 text new page (beta)
 English (pdf)
 Article in xml format
 Article references
 Send this article by e-mail
 Cited by SciELO
  Similars in
SciELO
Similars in
SciELO 
 Permalink
Introduction
Liver cancer is the fifth most common cancer in the world, and liver cancer is the main cause of death in patients with liver cirrhosis1,2. Hepatocellular carcinoma is one of the common malignant tumors in our country, with a high incidence in the southeast coastal areas. The median age of liver cancer patients in our country is 40-50 years old, and it is more common in men than women. Under normal circumstances, the immune system can recognize and eliminate tumor cells in the tumor microenvironment. However, to survive and grow, tumor cells can adopt different strategies to suppress the body’s immune system and not be killed normally3. Therefore, research on the pathogenesis and detailed molecular mechanisms of liver cancer is very important, and research in this area has been a hot spot for many years4.
Regulatory T cells (Tregs) are a type of T cell subgroup that controls autoimmune reactivity in the body and were also called suppressor T cells in the early stage5. Regulatory T cells are one of the important factors for maintaining immune tolerance of the body. They are secreted by thymus, exported to the periphery, and inhibit the potential self-reactivity existing in the normal body through active regulation. The activation and proliferation of T cells regulate the body’s immunity6,7. At present, the immunosuppressive function of tumor-related Treg cells is the main obstacle to improving the effectiveness of immunotherapy8.
T helper2 cell (Th2) is a subset of T cells that can secrete Th2-type cytokines (such as interleukins [IL-4], IL-5, IL-10, and IL-13). These cytokines can promote the proliferation of Th2 cells and inhibit the proliferation of Th1 cells, and, at the same time, assist B cell activation and exert humoral immunity9. T helper cells play a central role in the regulation of immune responses. In addition to effector cells, Th cells are also regulated by regulatory T cells10.
Cytotoxic T Lymphocyte Associated Protein-4 (CTLA-4) is a protein receptor that acts as an immune checkpoint and downregulates the immune response. CTLA-4 is constitutively expressed in regulatory T cells but is only upregulated in conventional T cells after activation and this phenomenon is particularly pronounced in cancer11. When it binds to CD80 or CD86 on the surface of antigen presenting cells, it acts as a “off” switch. CTLA-4 is the target gene of the transcription factor Forkhead Box P3 (FOXP3) and a protein on the surface of T lymphocytes, which plays an important role in downregulating the immune response12. CD28 is a specific glycoprotein on the surface of T cells, involved in inducing T cell activation, T cell proliferation and cytokine production, and promoting T cell survival13.
Both CD28 and CTLA-4 can bind ligands CD80 and CD86 to regulate the function of T cells. Therefore, in the liver cancer microenvironment, the balance between the expression of CTLA-4 and CD28 on the surface of T cells determines the immune surveillance of T cells14.
This work collected 20 blood samples from patients with clinical hepatocellular carcinoma without metastasis, 20 blood samples from patients with metastatic hepatocellular carcinoma, and 20 blood samples from healthy subjects. Flow cytometry (FCM) was used to analyze the content of Tregs and Th2 cells in each group of blood samples. Immunofluorescence was used to analyze the relative expression of CTLA-4 and CD28 in lymphocytes of each group of blood samples. Western blot was used to analyze the T cell surface protein CTLA-4, CD28, GATA-binding protein 3 (GATA3), FOXP3 expression in each group of blood samples.
Materials and methods
Experiment design
Twenty blood samples were collected from patients with clinical hepatocellular carcinoma without metastasis (Ca-N-M), 20 blood samples from patients with metastatic hepatocellular carcinoma (Ca-M), and 20 blood samples from healthy subjects (NC). The content of Treg and Th2 cells in each group of blood samples was detected by FCM. The relative expression of CTLA-4 and CD28 in lymphocytes of each group of blood samples were analyzed by immunofluorescence technology. Finally, the expression of T cell surface proteins CTLA-4, CD28, GATA3, and FOXP3 in each group of blood samples was determined by Western Blot analysis.
FCM analysis
The single cell suspension was added to a 2 ml centrifuge tube, centrifuged at 1500 rpm for 5 min, and the supernatant was discarded. Use 4% paraformaldehyde (PFA) to fix at 4°C for 30 min, and then use 0.1% Triton X-100 to fix at room temperature for 10 min. Add 200 ul of the primary antibody diluted with PBA, incubate at 4°C for 2 h, then centrifuge to remove the supernatant and wash with PBS. Add 200 ul of fluorescein-labeled secondary antibody diluted with PBA, and incubate for 30 min at 4°C in the dark. Finally, the cells were re-suspended in 500 ul PBS, placed in a flow tube, and detected by FCM.
Immunofluorescence analysis
Select the appropriate fluorescein-labeled antibody to stain CTLA-4 and CD28 in the lymphocytes of each group of blood samples, and then use DAPI to stain the nuclei in dark environment and observe through a fluorescence microscope.
Western blot analysis
Collect T cells from each blood sample group, and add 200 ml of cell lysate to each six-well plate. After sonication, the cells were lysed on ice for 1 h. The lysed cell sample was centrifuged at 12,500 rpm for 15 min at 4°C. Then, transfer the supernatant in the centrifuge tube to a clean centrifuge tube. BCA protein quantification kit was used to quantify protein concentration. The measured protein samples were stored at −80°C. In Western blot electrophoresis, the protein loading concentration was 50 mg per well. After SDS-PAGE electrophoresis, the membrane was transferred and blocked. CTLA-4, CD28, GATA3, FOXP3, and B-actin (1: 500, anti-human, Abcam, USA) primary antibody were diluted to the concentration which can be used. The samples were incubated overnight on a shaker at 4°C. After washing with PBS, the samples were incubated with the secondary antibody (1: 1000, anti-human, Abcam, USA) for 30 min at room temperature in the dark. Finally, the developer was used for development and photography.
Results
The content of Treg and Th2 cells
The data obtained by FCM showed that the content of Treg and Th2 cells showed different trends among the three groups. The content of Treg cells in the three groups from large to small was Ca-M group, Ca-N-M group, and NC group. The content of Th2 cells in the three groups from large to small was Ca-N-M group, Ca-M group, and NC group (Fig. 1).

The flow cytometry results of The content of Treg and Th2 cells. The data of NC group are all equivalent to that of healthy people. A: Treg cells (first row) and Th2 cells (second row) of NC, Ca-N-M, and Ca-M group. B: The percentage of target cells (Treg and Th2 cells) in total cells. The symbol ** means p < 0.01, *** means p < 0.001, **** means p < 0.0001 (compared to the NC group).
Relative expression of CD28 and CTLA-4
Immunofluorescence analysis technology was used to determine the relative expression of CTLA-4 and CD28 in lymphocytes of each blood sample group, and the results are shown in figure 2. It can be seen from the figure that the relative expression of CTLA-4 in Ca-M group is higher than that in Ca-N-M group, while the expression in Ca-N-M group is higher than NC group. For CD28, the relative expression in Ca-M group is lower than Ca-N-M group and at the same time higher than NC group.

Figure 2 The immunofluorescence results of relative expression of CTLA-4 and CD28. All pictures have the same magnification scale, and the scale bar is shown in A. The average fluorescence intensity was calculated by the software ImageJ. The data of NC group are all equivalent to that of healthy people. A: Relative expression of CTLA-4 in NC, Ca-N-M, and Ca-M group. B: Relative expression of CD28 in NC, Ca-N-M, and Ca-M group. C: The average fluorescence intensity of CTLA-4 (Red) in three groups. D: The average fluorescence intensity of CD28 (Red) in three groups. The symbol * means p < 0.05, ** means p < 0.01, *** means p < 0.001 (compared to the NC group).
The expression level of CD28, CTLA-4, GATA3, and FOXP3
The expression level of CD28, CTLA-4, GATA3, and FOXP3 was obtained from Western blot analysis. B-actin was the internal reference protein in this Western blot analysis experiment (Fig. 3). For Ca-N-M group compared to NC group, the expression level of CTLA-4 and FOXP3 is higher, while that of CD28 and GATA3 are much higher. For Ca-M group, the expression level of CD28 and GATA3 is higher than that of NC group, and while that of CTLA-4 and FOXP3 is much higher.
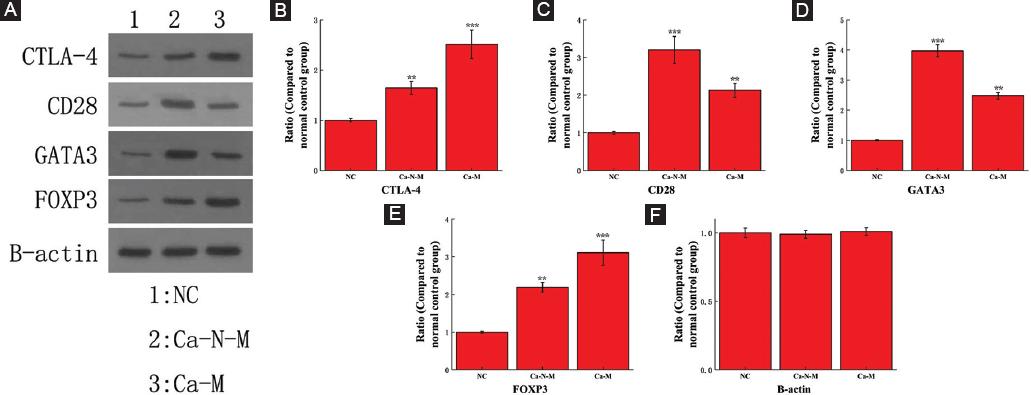
Figure 3 The Western blot analysis results of protein CTLA-4, CD28, GATA3, and FOXP3. The data of NC group are all equivalent to that of healthy people. A: Original gel electrophoresis image. B-F: The ratio of protein CTLA-4, CD28, GATA3, and FOXP3 expression compared to NC group. The symbol ** means p < 0.01, *** means p < 0.001 (compared to the NC group).
Discussion
For Tc and Th cells, costimulatory signal transduction lowers the threshold of T cell activation and promotes the proliferation and differentiation of T cells. In the absence of CD28 co-stimulation, naive T cells will not be activated and will not respond15. The co-stimulation of CD28 has many important molecular effects: 1. Induces the expression of IL-2 receptor (IL-2R) on the surface of T cells, thereby allowing cells to receive the third signal; 2. Make Th cells begin to secrete a large number of cells Factors and chemokines; and 3. Induces and upregulates the expression of other co-stimulatory and regulatory molecules in Th and Tc cells16,17.
CTLA4 is homologous to the T cell costimulatory protein CD28, and these two molecules, respectively, bind to CD80 and CD86 (also known as B7-1 and B7-2) on antigen presenting cells. Compared with CD28, CTLA-4 has a higher affinity for CD80 and CD86, which makes it perform better than CD28 ligand. CTLA4 transmits inhibitory signals to T cells, while CD28 transmits stimulation signals18. CTLA4 is also present in regulatory T cells (Treg cells), which contributes to its inhibitory function. T cell activation through T cell receptors and CD28 leads to the increased expression of CTLA-419.
FOXP3 is a member of the fork-head transcription factor family and is considered to be a marker molecule of regulatory T cells (Treg)20,21. Mutations of FOXP3 gene can cause serious autoimmune diseases. Therefore, FOXP3 plays a key role in regulating the body’s immune stability. As a transcriptional regulatory factor, FOXP3 regulates the activity of Treg by directly regulating a variety of genes22. FOXP3 cannot only be used as a marker molecule of CD+4T and CD+25T cells, but also a key factor that determines the function of CD+4T and CD+25T cells. FOXP3 secretes TGF-b and IL-10 for CD-127T, CD+4T, and CD+25T cells, which two are related to its immunoregulatory function23.
The transcription factor GATA3 is a key factor regulating cell differentiation and cytokine expression and is a specific transcription factor for Th2 cells24. Th2 cells express IL-4, IL-5, IL-13, and other cytokines, promote the production of antibodies, mediate humoral immune response, fight against pathogens outside the cell, and inhibit the function of anti-tumor immunity. GATA3 is critical in regulating the expression of cytokines in T cells and is limited in the expression of Th2 cells25.
Conclusions
CTLA-4, CD28, GATA3, and FOXP3 are all critical factors in regulating the expression level of Treg and Th2 cells. The expression of CD28 and GATA3 in the blood of patients with hepatocellular carcinoma without metastasis is obviously higher than that of patients with metastasis of hepatocellular carcinoma, which is contrary to the expression trend of CTLA-4 and FOXP3 and corresponds to the content ratio of Treg and Th2 cells, thus verifying the relationship between Treg/Th2 ratio and metastasis of hepatocellular carcinoma. The results indicate that in the microenvironment of hepatocellular carcinoma, the ratio of Treg/Th2 will increase significantly, thereby promoting the metastasis of hepatocellular carcinoma.

