


 nueva página del texto (beta)
 Inglés (pdf)
 Artículo en XML
 Referencias del artículo
 Enviar artículo por email
 Citado por SciELO
  Similares en
SciELO
Similares en
SciELO 
 Permalink
Introduction
The landmark analysis of 335 emerging infectious diseases from 1940 to 2004 reported that 60% of them were zoonoses and 25% were viruses1, along with the 2009 A-H1N1 Influenza outbreak. They remind us that the days when highly lethal pathogens emerged through periodic outbreaks in remote parts of the world but remained geographically isolated are over. Substantial progress has been made in developing surveillance systems for acute severe infections with epidemic potential to support public health, in spite of our deficient clinical infrastructure and the limited surge capacity of our stressed health care systems. It remains uncertain if a sporadic zoonosis restricted to a certain area will become a global pandemic or something in between. Therefore, epidemiological surveillance systems for acute severe infections with epidemic potential must not rely only on the number of cases reported and their temporal-spatial distribution in a determined geographical area or region to elicit an early alarm. Ideally, they should also rely on sociodemographic factors, such as public transportation, livestock production, and vaccinated population, because it is well known that these factors are part of the epidemiological substrate for a potential outbreak and its possible route of dissemination. Nowadays, a person can be infected in one continent and be in another 10 h later. Therefore, this is a challenge that must be faced by surveillance systems for severe infections with pandemic potential1,2 because it is one of the main reasons that dissemination of outbreaks is identified too late. The spread of a severe infection with epidemic potential starts with the net of contacts of the first infected patient (index case)3 and the replication of this net among the population. These facts, combined with the virulence of the pathogen and some sociodemographic factors, outline its pandemic potential. On the one hand, early warning system will give precious time to the Health Authorities to promote the appropriate intervention to minimize the spread of the outbreak, for example, A - H1N1 Influenza (2009) in Mexico4 and Middle East Respiratory Syndrome (2015) in Korea5. On the other hand, when there is a late warning, the population is severely affected in terms of both the number of fatal victims and the economic cost involved, as was the case of the Ebola outbreak in 2014 in Liberia, Guinea, and Sierra Leone6. Confirming an outbreak requires the clinical evidence of a number of infected subjects related in time and place and this task takes time. It is expected that an epidemiological surveillance system will identify specific symptomatic cases of an infectious process as soon as possible; this requires a predictive element to foresee with a probability index of possible occurrences in the time and place of the infectious process, which will enable the authorities to take preventive measures in a particular region.
Surveillance systems today are designed to emit alerts from confirmed cases and not from predicted cases. These warnings have been opportune; however, in some cases, the unexpected has happened, as was the case with the latest infectious outbreak of Ebola virus in Liberia (2014) that resurged6 in less than a month. We believe that some of the main factors that undermine the effectiveness of the warnings are the ever-growing and increasingly efficient modes of transportation, and the many mild diseases, for example, cold, which may lead to symptoms such as fever. Actual surveillance systems are strongly based on the number of cases verified by the laboratory7; the warnings, although real, sometimes are also late because monitoring is based on the assumption that a symptomatic individual will attend a medical clinic. However, if the transmissibility and/or lethality of the virus are very high, or if there are limited medical facilities in the area, the index patient and some of his contacts will probably die before receiving medical care, making it even more difficult to trace back its net of contacts, which will continue growing. In addition, the number of doctors and clinics available is frequently less than optimal, as happens in developing countries, where the population does not usually seek medical advice for a variety of reasons.
Improvements to such surveillance systems are likely to generate a lot of false positives and, in practice, cannot be handled easily, but the answer can come from a change in paradigm. Instead of waiting for symptomatic individuals to attend the clinics, it would be more efficient to look for them in the affected areas. This would involve the use of thermal cameras8,9 that identify individuals with fever. Thus, doctors will focus on symptomatic cases to disregard other infectious, neoplastic, and rheumatic diseases. With this approach, it will be possible to decrease the net of contacts of affected cases. Nevertheless, this would require the individuals' consent for scrutiny.
There is another approach: a mixed model of epidemiological surveillance, the StochCum Method. Its time and space warnings come from weighting three clinical indicators, that is, critically ill patients and mechanical ventilators in the Emergency Rooms of a net of hospitals in a determined area, and non-clinical indicators, such as demographics and socioeconomic information, among others. The model would issue warnings that consider these indicators and would have a census in real-time from symptomatic or confirmed patients who attend the hospitals or clinics. The model is a deterministic-stochastic and non-retrospective approximation: (i) it considers only the physical counting of critically ill patients and mechanical ventilator demand associated with the ongoing infectious process; (ii) it reports 24/7, in real-time, the over-saturation of Emergency Rooms; (iii) it has a simple algorithm adaptable to different regional indicators from the area, state, or country implementing it; (iv) it also randomly weights the clinical indicators (Table 1) and non-clinical indicators (Table 2); and (v) it reports the early warning to a higher hierarchy of physicians in the health system responsible for issuing the warning10 to inform all users about the saturation of the Emergency Rooms while waiting for the laboratory verification of the possible cases. Not using this approach is probably the reason why other predictive models only simulate past events11,12 that cannot be used for real-time monitoring. A mixed model always emits warnings considering the clinical elements, so this model could be the prototype that makes a difference because: (a) its prediction is based on counting the cases at the time of the early warning and (b) it informs all users, in real-time, of the over-saturation of the Emergency Rooms.
In this work, we introduce a computer program developed by us named StochCum Method. The nature of its algorithms can be considered a deterministic-stochastic model since the processing of the variations of the clinical indicators taken from the Emergency Rooms (Table 1) is performed by a deterministic function, while the non-linear indicators (Appendixes section) are processed by a stochastic function. Both functions feedback to issue (or not) an epidemiological alert. The StochCum Method collects the clinical indicators of all Emergency Rooms subscribed to the program, so the more Emergency Rooms subscribing, the greater the reliability. This program always depends on the number of Emergency Rooms; however, this is not required for the non-clinical indicators, which must only comply with representing the corresponding states, provinces, or regions of the country where the StochCum Method is applied. The testing and validation of this program were carried out with the non-clinical indicators corresponding to Mexico (Appendixes section), which are accessible to everyone. However, the clinical indicators correspond only to Hospital Juarez de Mexico, which is a public hospital.
Tabla 1 Clinical variables
| # | Concept | Description |
|---|---|---|
| 4 | Critically ill patients | The number of patients attending a hospital unit with fever and/or a sore throat who, at the time of the census, are requiring intensive monitoring owing to the severity of his/her condition and the comorbidity associated with it. |
| 5 | Hemodynamic monitors | The number of usable hemodynamic monitors in a hospital facility. |
| 6 | Mechanical ventilators | The number of usable ventilators in a hospital facility. |
Description of the clinical variables used for the StochCum Method® to determine the deterministic index (2.1.1 Deterministic Index section). Note: the variables and descriptions are taken from13,14. These variables are strongly associated with an influenza outbreak and they were analytically determined.
Tabla 2 Non-clinical variables
| # | Symbol | Concept | Direct proportionality | Appendix | Reference |
|---|---|---|---|---|---|
| 1 | C1 | Passengers by traveling | † | A | 16, 17 |
| 2 | C2 | Illiterate indigenous population | † | B | 19 |
| 3 | C3 | Indigenous population | † | B | 19 |
| 4 | C4 | Bovine production | † | C | 20 |
| 5 | C5 | Porcine production | † | C | 20 |
| 6 | C6 | Avian production | † | C | 20 |
| 7 | C7 | Immigrant population | † | D | 21 |
| 8 | C8 | People age 60 and over | † | E | 23, 26 |
| 9 | C9 | People in extreme poverty | † | E | 22 |
| 10 | C10 | Dwellings with dirt floor | † | F | 18 |
| 11 | C11 | Dwellings without piped water | † | F | 24, 25 |
Conditions associated with non-clinical variables (sociodemographic factors) by State (2.1.2 Stochastic Index section). Direct proportionality: variable that favors the epidemic process.
Materials and methods
The deterministic-stochastic model StochCum Method oriented to predict an epidemic outbreak of serious acute infections was implemented based on two previous deterministic computer models: the Modified Overcrowd Index (ISM)13 and the Overcrowd-Severe-Respiratory-Disease-Index Model (OSRDI)14. These two systems register seven and five clinical variables, respectively13,14, (Table 1), associated with the over-saturation of the Emergency Rooms. From these clinical variables, both systems ISM and OSRDI measure the over-saturation of a net of Emergency Rooms and, by considering the speed at which the Emergency Rooms get over-saturated, they can predict an epidemic outbreak. Both systems, the ISM and OSRDI, are deterministic types and their metrics support the forecast of the real demand of medical supplies, for example, beds, doctors, and equipment, though the OSRDI gives priority to the demand of hemodynamic monitors and mechanical ventilators, over the other clinical variables. However, depending only on the clinical variables of these methods to predict an epidemic outbreak of serious acute infections is not enough. Therefore, the StochCum Method was designed. This model considers two components of different nature that make it possible to predict, with a certain degree of probability, an epidemic outbreak for acute severe infections. To facilitate the understanding of the algorithms used in the StochCum Method, each section has a numerical explanation whenever necessary.
Deterministic-stochastic model
The StochCum Method is a computational system that has two mathematical approaches: a deterministic profile (Deterministic Index) from the daily count of three clinical variables (Table 1), related to Eq. 1; and a stochastic profile (Stochastic Index) taken from eleven non-clinical variables (Table 2)16-26, related to Eq. 2 (these equations are defined in subsections, 2.1.1-2.1). With these two indexes, a third index is built called the StochCum Index, whose metric is expressed in Eq. 3; finally, the latter index is normalized (Eq. 4) to obtain the Normal StochCum Index (Eq. 5). These four indexes form the metric of the StochCum Method. The three clinical variables (Table 1) are strongly associated with the signs and symptoms of an epidemic outbreak of serious acute infections and are also associated with the over-saturation of the Emergency Rooms. On the other hand, the eleven non-clinical variables (Table 2) are usually regarded as sociodemographic indicators of a developed or undeveloped country or region and are secondary factors in the dissemination of an outbreak; therefore, they are not directly taken into account in the algorithms used to know the over-saturation of an Emergency Room.
Here, each one of these indexes is explained in detail with some examples; later, some "example cases" will be given to show how they work in different epidemiological scenarios.
DETERMINISTIC INDEX
The deterministic index is the quotient of the number of critically ill patients and the smaller number of mechanical ventilators and hemodynamic monitors found at the time of the census (Eq. 1). Although these variables were considered in our previous articles13,14, they were not used in any index described here.
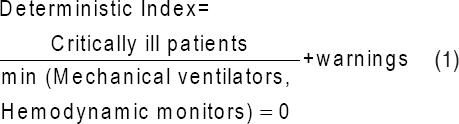
Note 1: If, at the time of the census, there is a microbiological confirmation of a case of infection, then the "warning" will have the value of "1," otherwise, it will be zero. If the denominator of the Deterministic Index (Eq. 1) is zero, then the denominator will have the value of "1."
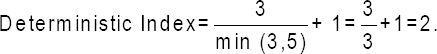
Example 1. Suppose that in an Emergency Room census, there are three critically ill patients, five hemodynamic monitors, and three mechanical ventilators and that any of those three patients have a microbiological confirmation for influenza. From Eq. 1:
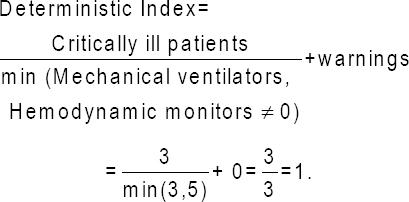
In this example, if any of the critically ill patients had a microbiological confirmation for influenza, then the warning would be "1." Note that the warning can have a value of "0" or "1:"
STOCHASTIC INDEX
The "Stochastic Index" was built as a Hidden Markov Model (HMM)15. An HMM is a mathematical algorithm that makes it possible to predict the behavior of a variable based on other variables that are not apparently associated with the characteristic studied. From the mathematical point of view, an HMM assumes that the probability of observation at time i depends on Ci-1. As a consequence, the number of past events is reduced to Cn ⊗ Cn-1. The HMM algorithm receives the geographical location from the Deterministic Index, and it calculates the "Stochastic Index" represented by the series (Eq. 2), where Ci is the 11 conditions (Table 2).

Note 2: A HMM (or probabilistic directed acyclic graphical model) is a compilation of all possible routes that can be taken to achieve a goal, subject to certain restrictions. An HMM algorithm builds the network associating a probability value to each route since an HMM is essentially a probabilistic model and not a deterministic one. In the field of Mathematical Epidemiology, HMMs are useful to identify factors that trigger an outbreak.
Example 2. Now, suppose we want to determine condition C1 (Table II, first row) for a particular state in Mexico, where the number of passengers traveling to the state during the year was 456,600, and the total number of passengers traveling to Mexico the same year was 85,510,569. Then, C1 is the quotient:
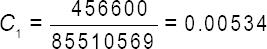
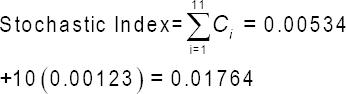
The other ten conditions are calculated the same way (Table 1). To give an example of how the Stochastic Index works (Eq. 2), let us assume that the other ten conditions Ci have a value of 0.00123, then:
STOCHCUM INDEX
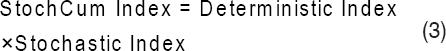
The StochCum Method determines the StochCum Index as a function of the Deterministic Index (2.1.1 Deterministic Index section) and the Stochastic Index (2.1.2 Stochastic Index section). Thus, both indexes (deterministic and stochastic) feedback to each other (Eq. 3).
This way the feedback of these indexes helps to determine a new index named the StochCum Index. This index has the feature of magnifying, either positively or negatively, each profile. A deterministic index > "1," combined with a Stochastic Index smaller than "1" will decrease the value of the Deterministic Index, that is, StochCum Index < Deterministic Index; this can be interpreted as a case of influenza in a socioeconomic environment of low risk, and the value of the StochCum Index will be low. On the one hand, a case of influenza in a socioeconomic environment of high risk will increase the value of the StochCum Index, that is, StochCum Index > Deterministic Index. Note that this criterion will always be influenced by the non-clinical variables.
Note 3: The StochCum index is a non-linear function, the non-linearity of the index is due to the multiplication of the Deterministic Index by the Stochastic Index.
Example 3: Let the Deterministic Index = "1.1" and two different values of the Stochastic Index, "0.98710" and "1.09876", so the effect will be:
NORMAL STOCHCUM INDEX
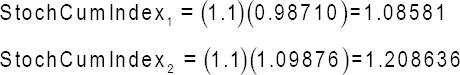
The StochCum Index (2.2.1 StochCum Index section) is normalized with the maximum value of the StochCum Index that the method accumulates and whose iterations will not exceed 150 entries (operating as a data pipeline); this last index will be named Normal StochCum Index (Eq. 4).

Note 4. The normalization of the StochCum Index, that is, the Normal StochCum Index of the list of 150 StochCum Indexes, will show thoroughly the behavior of the index in a closed interval [0,1] (Eq. 4), without affecting its regularity.
Example 4. Suppose that the 150 automatically accumulated values of the StochCum Method have the maximum value of 1.63669 and that we want to determine the value of the Normal StochCum from the StochCum Index = 0.99875, then:
Test plan
HOSPITAL CENSUS
During July 2016, there were 125 admissions (Appendix H, Supplementary Materials section) at the Emergency Room of Hospital Juarez de Mexico, located in Mexico City. In each case, the time of arrival and the medical evaluation of the patients were registered, as well as the supposedly confirmed cases of influenza. In each census, the number of critically ill patients, the hemodynamic monitors, and the mechanical ventilators used were reported. Once the information was verified and the readings were correct, the following procedure for the StochCum Method was carried out in this order:
The Stochastic Index (2.1.2 Stochastic Index section) was calculated for the 32 States in Mexico (Appendix G), using the socio-economic data from (Appendix A-F). Then, the Stochastic Index from Mexico City (CMX) was taken (Appendix G, CMX row in green).
The Deterministic Index (2.1.1 Deterministic Index Section), the StochCum Index (2.1.3 StochCum Index section), and the Normal StochCum Index (2.1.4 Normal StochCum Index) were determined for each entry of the census, registering the information in Appendix H.
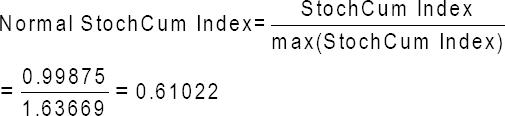
Finally, The Normal StochCum Index (Fig. 1) and the StochCum Index (Fig. 2) were graphed.
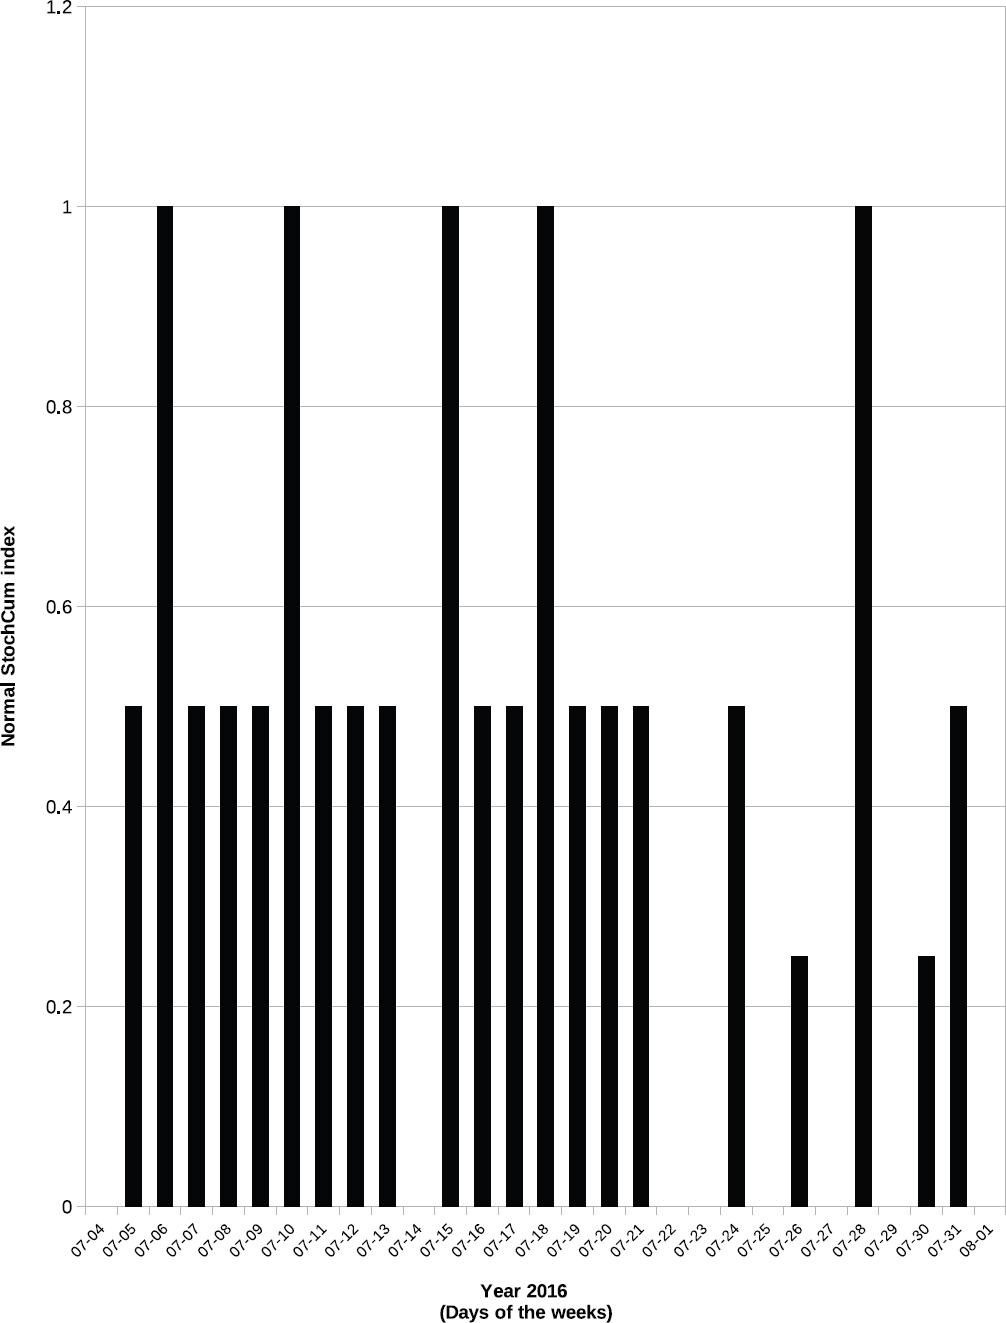
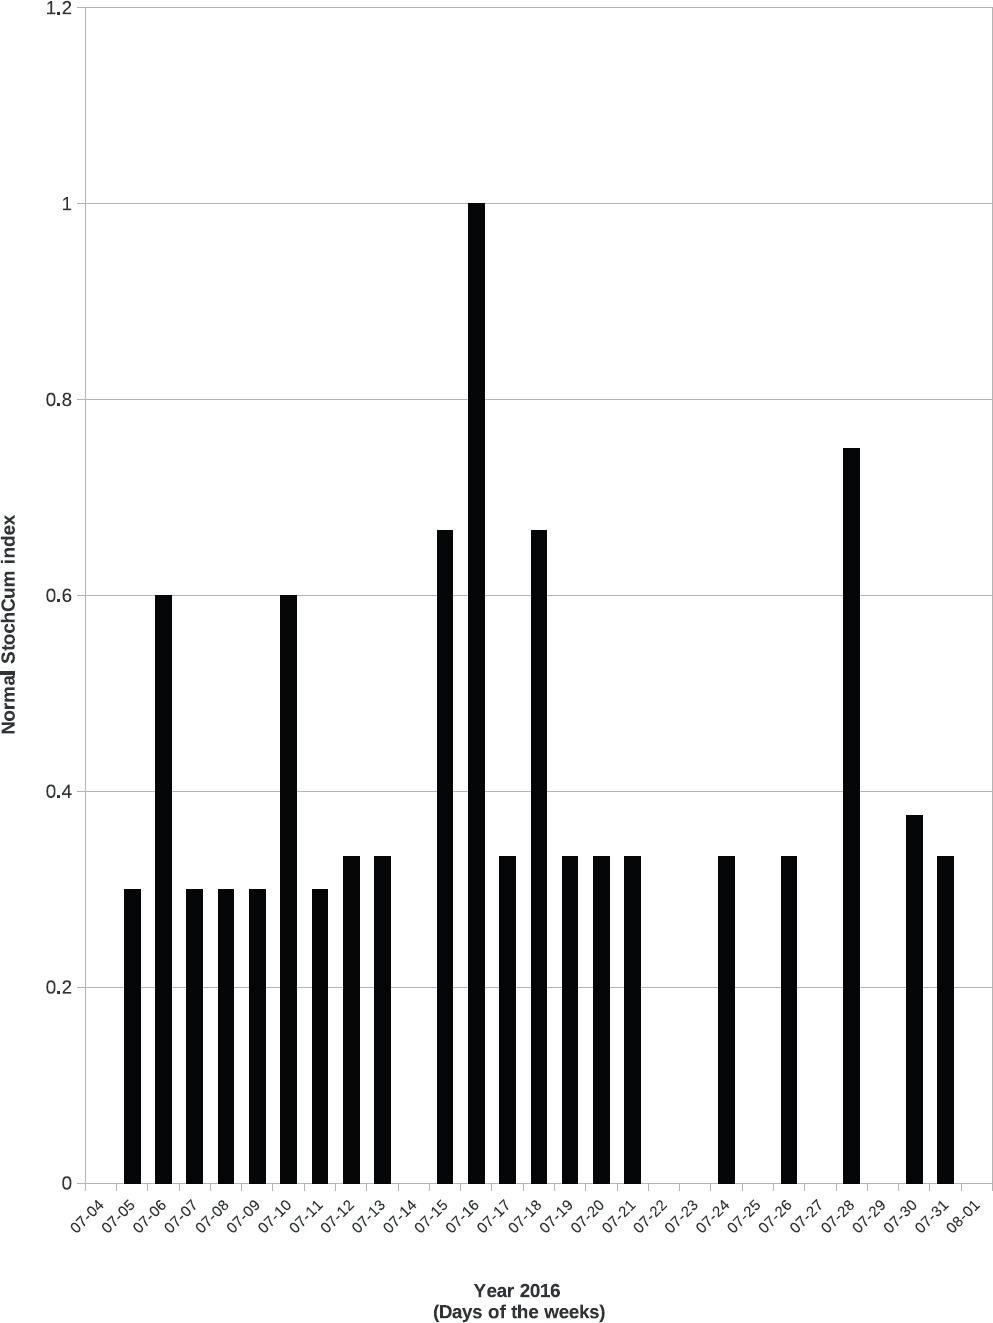
Figure 1 Distribution of Normal StochCum Index in July 2016 (from Appendix H), by day of the week, in the Emergency Room of Hospital Juarez de Mexico, located in Mexico City, Mexico. This figure corresponds to 2.2.2 example cases section (A entry).
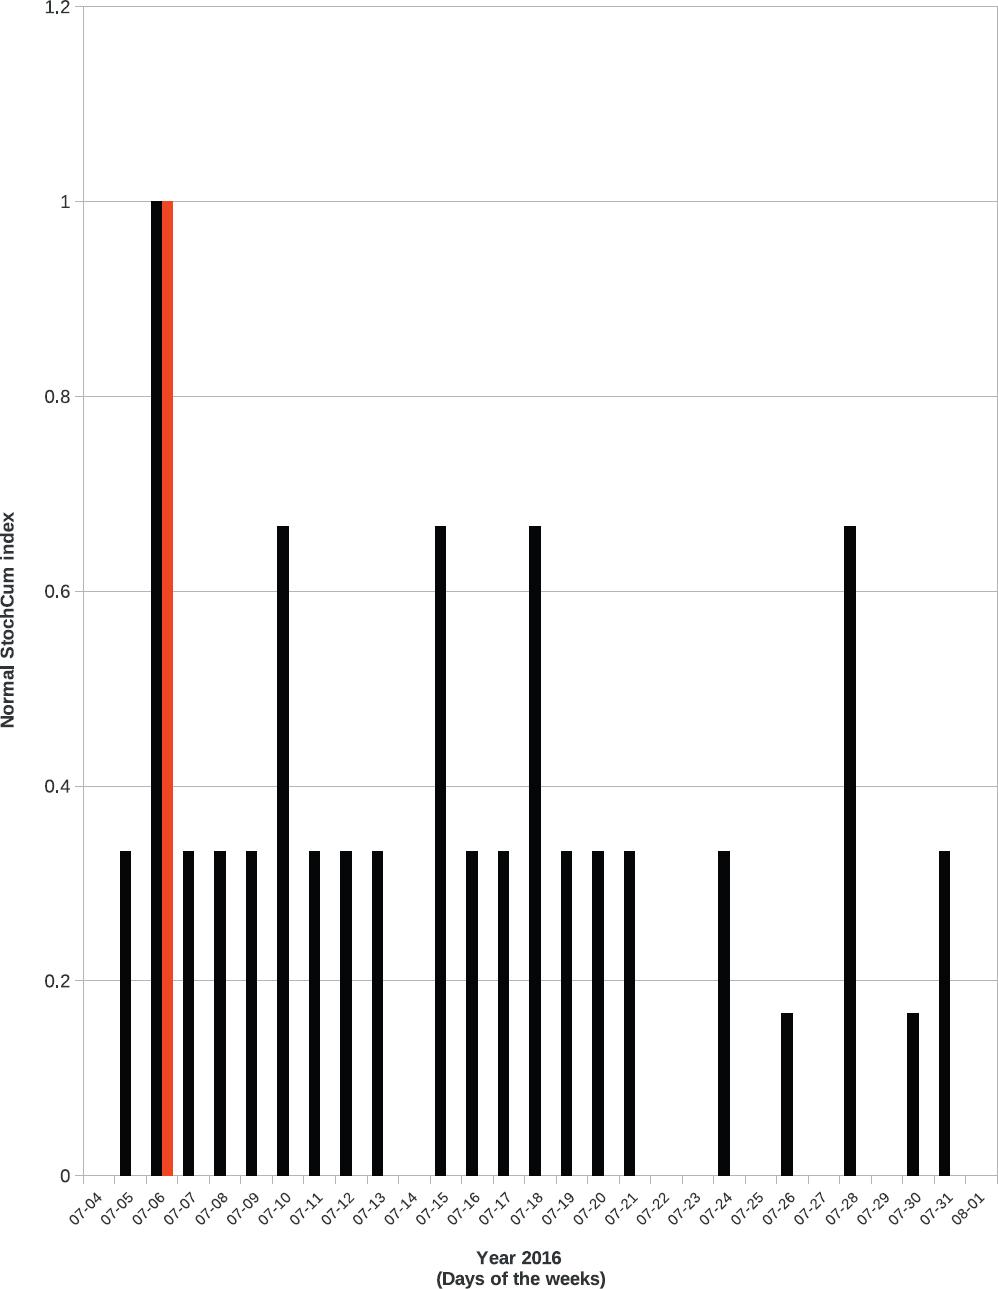
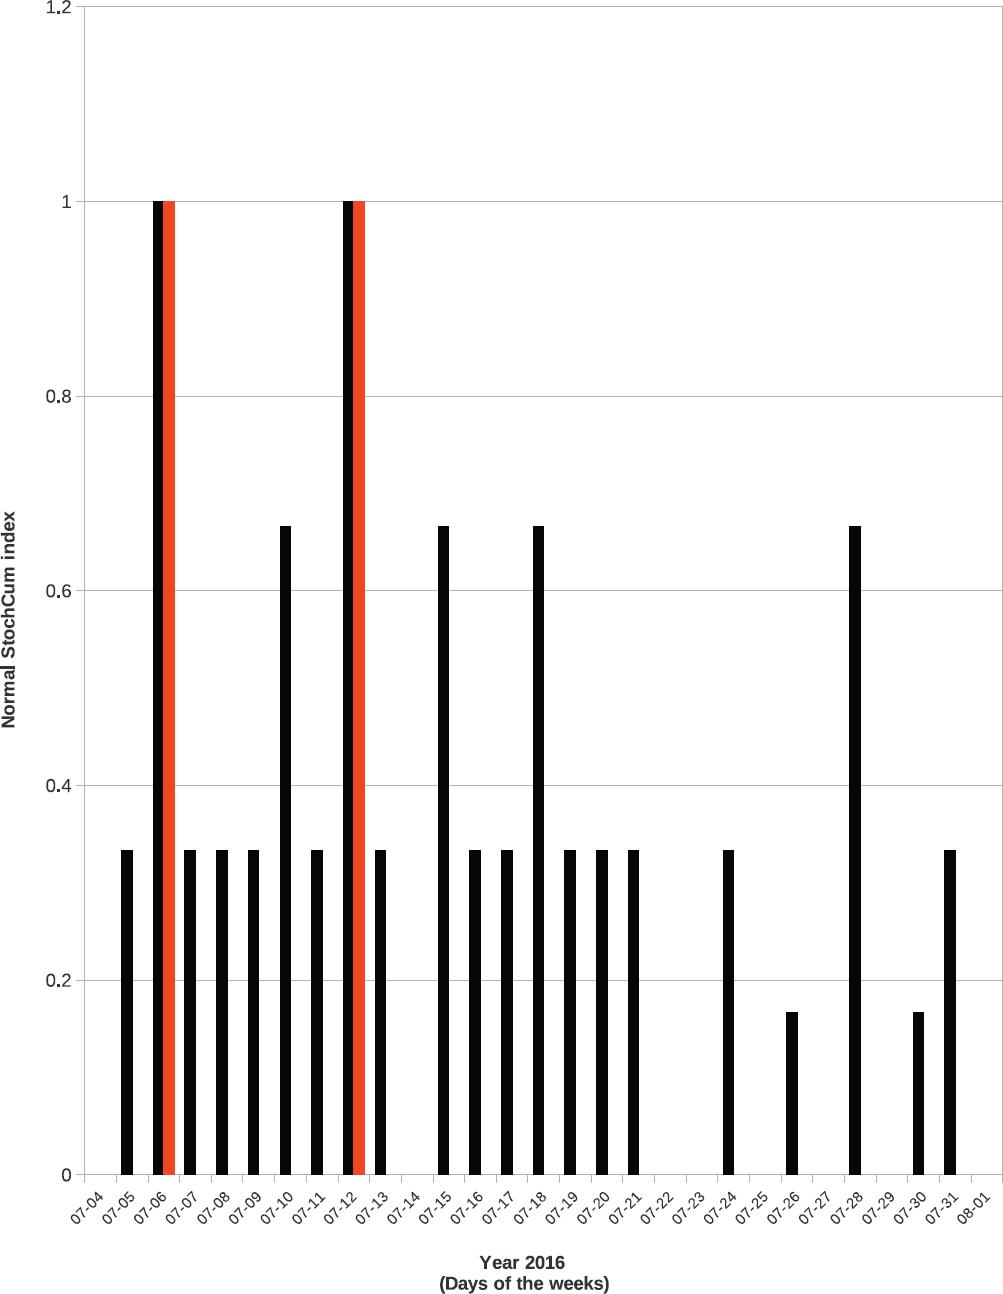
Figure 2 Distribution of Normal StochCum Index in July 2016 (from Appendix H), by day of the week, in the Emergency Room of Hospital Juarez de Mexico, located in Mexico City, Mexico. Warning is marked in red color. This figure corresponds to 2.2.2 example cases section (B entry).
To verify the reliability of the StochCum Method, the three previous steps were repeated, modifying the information of the census, according to the examples given in (2.2.2. Example Cases section).
EXAMPLE CASES
The procedure (2.4.1 Hospital census) for the original census is shown in detail in this work and all the variations to the census, described as example cases, are listed in Table III.
Tabla 3 Summary of example cases
| Date (DD/MM) | Time (24-h format) | Normal StochCum Index Case A | Normal StochCum Index Case B | Normal StochCum Index Case C | Normal StochCum Index Case D | Normal StochCum Index Case E |
|---|---|---|---|---|---|---|
| 7/4 | 8:43 | 0.00000 | 0.00000 | 0.00000 | 0.00000 | 0.00000 |
| 7/4 | 11:27 | 0.00000 | 0.00000 | 0.00000 | 0.00000 | 0.00000 |
| 7/4 | 13:41 | 0.00000 | 0.00000 | 0.00000 | 0.00000 | 0.00000 |
| 7/4 | 18:06 | 0.00000 | 0.00000 | 0.00000 | 0.00000 | 0.00000 |
| 7/4 | 22:11 | 0.00000 | 0.00000 | 0.00000 | 0.00000 | 0.00000 |
| 7/5 | 1:11 | 0.00000 | 0.00000 | 0.00000 | 0.00000 | 0.00000 |
| 7/5 | 6:22 | 0.00000 | 0.00000 | 0.00000 | 0.00000 | 0.00000 |
| 7/5 | 6:24 | 0.00000 | 0.00000 | 0.00000 | 0.00000 | 0.00000 |
| 7/5 | 9:29 | 0.00000 | 0.00000 | 0.00000 | 0.00000 | 0.00000 |
| 7/5 | 13:01 | 0.00000 | 0.00000 | 0.00000 | 0.00000 | 0.00000 |
| 7/5 | 18:42 | 0.00000 | 0.00000 | 0.00000 | 0.00000 | 0.00000 |
| 7/5 | 22:46 | 0.50000 | 0.33333 | 0.33333 | 0.33333 | 0.33333 |
| 7/6 | 3:59 | 1.00000 | 0.66667 | 0.66667 | 0.66667 | 0.66667 |
| 7/6 | 9:05 | 1.00000 | 1.00000 | 1.00000 | 1.00000 | 1.00000 |
| 7/6 | 11:19 | 0.50000 | 0.33333 | 0.33333 | 0.33333 | 0.33333 |
| 7/6 | 15:28 | 0.50000 | 0.33333 | 0.33333 | 0.33333 | 0.33333 |
| 7/6 | 20:53 | 0.00000 | 0.00000 | 0.00000 | 0.00000 | 0.00000 |
| 7/7 | 1:42 | 0.00000 | 0.00000 | 0.00000 | 0.00000 | 0.00000 |
| 7/7 | 7:14 | 0.50000 | 0.33333 | 0.33333 | 0.33333 | 0.33333 |
| 7/7 | 12:00 | 0.00000 | 0.00000 | 0.00000 | 0.00000 | 0.00000 |
| 7/7 | 15:23 | 0.50000 | 0.33333 | 0.33333 | 0.33333 | 0.33333 |
| 7/7 | 21:22 | 0.50000 | 0.33333 | 0.33333 | 0.33333 | 0.33333 |
| 7/8 | 2:50 | 0.00000 | 0.00000 | 0.00000 | 0.00000 | 0.00000 |
| 7/8 | 6:26 | 0.00000 | 0.00000 | 0.00000 | 0.00000 | 0.00000 |
| 7/8 | 12:48 | 0.00000 | 0.00000 | 0.00000 | 0.00000 | 0.00000 |
| 7/8 | 15:01 | 0.00000 | 0.00000 | 0.00000 | 0.00000 | 0.00000 |
| 7/8 | 18:20 | 0.00000 | 0.00000 | 0.00000 | 0.00000 | 0.00000 |
| 7/8 | 22:00 | 0.50000 | 0.33333 | 0.33333 | 0.33333 | 0.33333 |
| 7/9 | 2:57 | 0.50000 | 0.33333 | 0.33333 | 0.33333 | 0.33333 |
| 7/9 | 11:21 | 0.50000 | 0.33333 | 0.33333 | 0.33333 | 0.33333 |
| 7/9 | 20:22 | 0.50000 | 0.33333 | 0.33333 | 0.33333 | 0.33333 |
| 7/10 | 1:55 | 1.00000 | 0.66667 | 0.66667 | 0.66667 | 0.66667 |
| 7/10 | 13:05 | 0.50000 | 0.33333 | 0.33333 | 0.33333 | 0.33333 |
| 7/11 | 3:55 | 0.00000 | 0.00000 | 0.00000 | 0.00000 | 0.00000 |
| 7/11 | 3:56 | 0.50000 | 0.33333 | 0.33333 | 0.33333 | 0.33333 |
| 7/11 | 9:37 | 0.50000 | 0.33333 | 0.33333 | 0.33333 | 0.33333 |
| 7/11 | 12:54 | 0.50000 | 0.33333 | 0.33333 | 0.33333 | 0.33333 |
| 7/11 | 12:55 | 0.50000 | 0.33333 | 0.33333 | 0.33333 | 0.33333 |
| 7/11 | 14:14 | 0.50000 | 0.33333 | 0.33333 | 0.33333 | 0.33333 |
| 7/11 | 17:48 | 0.50000 | 0.33333 | 0.33333 | 0.33333 | 0.33333 |
| 7/11 | 21:07 | 0.00000 | 0.00000 | 0.00000 | 0.00000 | 0.00000 |
| 7/12 | 0:23 | 0.00000 | 0.33333 | 0.33333 | 0.33333 | 0.33333 |
| 7/12 | 7:02 | 0.00000 | 0.00000 | 0.00000 | 0.00000 | 0.00000 |
| 7/12 | 10:43 | 0.50000 | 0.33333 | 0.33333 | 0.33333 | 0.33333 |
| 7/12 | 15:06 | 0.50000 | 0.33333 | 0.33333 | 0.33333 | 0.33333 |
| 7/12 | 22:30 | 0.50000 | 0.33333 | 0.33333 | 0.33333 | 0.33333 |
| 7/13 | 3:50 | 0.50000 | 0.33333 | 0.33333 | 0.33333 | 0.33333 |
| 7/13 | 3:52 | 0.00000 | 0.00000 | 0.00000 | 0.00000 | 0.00000 |
| 7/13 | 7:19 | 0.00000 | 0.00000 | 0.00000 | 0.00000 | 0.00000 |
| 7/13 | 10:53 | 0.00000 | 0.00000 | 0.00000 | 0.00000 | 0.00000 |
| 7/13 | 17:28 | 0.00000 | 0.00000 | 0.00000 | 0.00000 | 0.00000 |
| 7/13 | 23:01 | 0.00000 | 0.00000 | 0.00000 | 0.00000 | 0.00000 |
| 7/14 | 1:51 | 0.00000 | 0.00000 | 0.00000 | 0.00000 | 0.00000 |
| 7/14 | 1:52 | 0.00000 | 0.00000 | 0.00000 | 0.00000 | 0.00000 |
| 7/14 | 5:51 | 0.00000 | 0.00000 | 0.00000 | 0.00000 | 0.00000 |
| 7/14 | 9:07 | 0.00000 | 0.00000 | 0.00000 | 0.00000 | 0.00000 |
| 7/14 | 14:26 | 0.00000 | 0.00000 | 0.00000 | 0.00000 | 0.00000 |
| 7/14 | 18:08 | 0.00000 | 0.00000 | 0.00000 | 0.00000 | 0.00000 |
| 7/14 | 22:16 | 0.00000 | 0.00000 | 0.00000 | 0.00000 | 0.00000 |
| 7/15 | 6:02 | 0.00000 | 0.00000 | 0.00000 | 0.00000 | 0.00000 |
| 7/15 | 12:03 | 0.00000 | 0.00000 | 0.00000 | 0.00000 | 0.00000 |
| 7/15 | 17:44 | 0.00000 | 0.00000 | 0.00000 | 0.00000 | 0.00000 |
| 7/15 | 22:41 | 1.00000 | 0.66667 | 0.66667 | 0.66667 | 0.66667 |
| 7/16 | 3:07 | 0.50000 | 0.33333 | 0.33333 | 0.33333 | 0.33333 |
| 7/16 | 9:12 | 0.50000 | 0.33333 | 0.33333 | 0.33333 | 0.33333 |
| 7/16 | 19:33 | 0.50000 | 0.33333 | 0.33333 | 0.33333 | 0.33333 |
| 7/17 | 1:20 | 0.50000 | 0.33333 | 0.33333 | 0.33333 | 0.33333 |
| 7/17 | 9:09 | 0.50000 | 0.33333 | 0.33333 | 0.33333 | 0.33333 |
| 7/17 | 12:02 | 0.50000 | 0.33333 | 0.33333 | 0.33333 | 0.33333 |
| 7/17 | 15:43 | 0.50000 | 0.33333 | 0.33333 | 0.33333 | 0.33333 |
| 7/17 | 15:44 | 0.50000 | 0.33333 | 0.33333 | 0.33333 | 0.33333 |
| 7/18 | 0:01 | 0.50000 | 0.33333 | 0.33333 | 0.33333 | 0.33333 |
| 7/18 | 8:22 | 0.50000 | 0.33333 | 0.33333 | 0.33333 | 0.33333 |
| 7/18 | 10:59 | 0.50000 | 0.33333 | 0.33333 | 0.33333 | 0.33333 |
| 7/18 | 14:47 | 1.00000 | 0.66667 | 0.66667 | 0.66667 | 0.66667 |
| 7/18 | 23:24 | 1.00000 | 0.66667 | 0.66667 | 0.66667 | 0.66667 |
| 7/19 | 6:12 | 0.50000 | 0.33333 | 0.33333 | 0.33333 | 0.33333 |
| 7/19 | 10:24 | 0.50000 | 0.33333 | 0.33333 | 0.33333 | 0.33333 |
| 7/19 | 12:00 | 0.50000 | 0.33333 | 0.33333 | 0.33333 | 0.33333 |
| 7/19 | 20:43 | 0.00000 | 0.00000 | 0.00000 | 0.00000 | 0.00000 |
| 7/19 | 21:34 | 0.00000 | 0.00000 | 0.00000 | 0.00000 | 0.00000 |
| 7/20 | 0:15 | 0.00000 | 0.00000 | 0.00000 | 0.00000 | 0.00000 |
| 7/20 | 5:21 | 0.50000 | 0.33333 | 0.33333 | 0.33333 | 0.33333 |
| 7/20 | 11:07 | 0.50000 | 0.33333 | 0.33333 | 0.33333 | 0.33333 |
| 7/20 | 17:42 | 0.50000 | 0.33333 | 0.33333 | 0.33333 | 0.33333 |
| 7/20 | 21:50 | 0.50000 | 0.33333 | 0.33333 | 0.33333 | 0.33333 |
| 7/21 | 1:23 | 0.50000 | 0.33333 | 0.33333 | 0.33333 | 0.33333 |
| 7/21 | 8:27 | 0.50000 | 0.33333 | 0.33333 | 0.33333 | 0.33333 |
| 7/21 | 11:08 | 0.50000 | 0.33333 | 0.33333 | 0.33333 | 0.33333 |
| 7/21 | 13:37 | 0.50000 | 0.33333 | 0.33333 | 0.33333 | 0.33333 |
| 7/21 | 22:11 | 0.00000 | 0.00000 | 0.00000 | 0.00000 | 0.00000 |
| 7/22 | 6:27 | 0.00000 | 0.00000 | 0.00000 | 0.00000 | 0.00000 |
| 7/22 | 16:44 | 0.00000 | 0.00000 | 0.00000 | 0.00000 | 0.00000 |
| 7/22 | 19:46 | 0.00000 | 0.00000 | 0.00000 | 0.00000 | 0.00000 |
| 7/23 | 3:13 | 0.00000 | 0.00000 | 0.00000 | 0.00000 | 0.00000 |
| 7/23 | 14:49 | 0.00000 | 0.00000 | 0.00000 | 0.00000 | 0.00000 |
| 7/23 | 18:15 | 0.00000 | 0.00000 | 0.00000 | 0.00000 | 0.00000 |
| 7/24 | 7:04 | 0.50000 | 0.33333 | 0.33333 | 0.33333 | 0.33333 |
| 7/24 | 23:56 | 0.00000 | 0.00000 | 0.00000 | 0.00000 | 0.00000 |
| 7/25 | 1:48 | 0.00000 | 0.00000 | 0.00000 | 0.00000 | 0.00000 |
| 7/25 | 10:44 | 0.00000 | 0.00000 | 0.00000 | 0.00000 | 0.00000 |
| 7/25 | 15:42 | 0.00000 | 0.00000 | 0.00000 | 0.00000 | 0.00000 |
| 7/25 | 20:14 | 0.00000 | 0.00000 | 0.00000 | 0.00000 | 0.00000 |
| 7/25 | 22:37 | 0.00000 | 0.00000 | 0.00000 | 0.00000 | 0.00000 |
| 7/26 | 1:37 | 0.25000 | 0.16667 | 0.16667 | 0.16667 | 0.16667 |
| 7/26 | 4:22 | 0.25000 | 0.16667 | 0.16667 | 0.16667 | 0.16667 |
| 7/26 | 5:47 | 0.25000 | 0.16667 | 0.16667 | 0.16667 | 0.16667 |
| 7/26 | 9:51 | 0.25000 | 0.16667 | 0.16667 | 0.16667 | 0.16667 |
| 7/26 | 13:08 | 0.00000 | 0.00000 | 0.00000 | 0.00000 | 0.00000 |
| 7/26 | 18:16 | 0.00000 | 0.00000 | 0.00000 | 0.00000 | 0.00000 |
| 7/26 | 19:01 | 0.25000 | 0.16667 | 0.16667 | 0.16667 | 0.16667 |
| 7/26 | 23:49 | 0.25000 | 0.16667 | 0.16667 | 0.16667 | 0.16667 |
| 7/27 | 4:59 | 0.00000 | 0.00000 | 0.00000 | 0.00000 | 0.00000 |
| 7/27 | 21:51 | 0.00000 | 0.00000 | 0.00000 | 0.00000 | 0.00000 |
| 7/28 | 4:53 | 0.00000 | 0.00000 | 0.00000 | 0.00000 | 0.00000 |
| 7/28 | 10:04 | 1.00000 | 0.66667 | 0.66667 | 0.66667 | 0.66667 |
| 7/29 | 8:50 | 0.00000 | 0.00000 | 0.00000 | 0.00000 | 0.00000 |
| 7/29 | 22:13 | 0.00000 | 0.00000 | 0.00000 | 0.00000 | 0.00000 |
| 7/30 | 4:29 | 0.00000 | 0.00000 | 0.00000 | 0.00000 | 0.00000 |
| 7/30 | 12:53 | 0.25000 | 0.16667 | 0.16667 | 0.16667 | 0.16667 |
| 7/30 | 21:54 | 0.00000 | 0.00000 | 0.00000 | 0.00000 | 0.00000 |
| 7/31 | 9:09 | 0.00000 | 0.00000 | 0.00000 | 0.00000 | 0.00000 |
| 7/31 | 16:33 | 0.00000 | 0.00000 | 0.00000 | 0.00000 | 0.00000 |
| 7/31 | 21:17 | 0.50000 | 0.33333 | 0.33333 | 0.33333 | 0.33333 |
| 8/1 | 3:35 | 0.00000 | 0.00000 | 0.00000 | 0.00000 | 0.00000 |
Census of patients registered in the year 2016 in the Emergency Room of Hospital Juarez en Mexico located in Mexico City, Mexico. Normal StochCum Index: from equation 4. This table corresponds to the example cases from 2.2.2 example cases section.
- Any record of the census was altered (Appendix H).
- The record, Appendix H, July 7th, 9:05 h, was changed to warning "1".
- These two records, Appendix H, July 7th, 9:05 h and Appendix H, July 13th, 17:28 h, were changed in the census to warning "1".
- The record, Appendix H, July 7th, 9:05 h, was changed to hemodynamic monitors = "5" and mechanical ventilators = "4".
- All records were altered (Appendix H) to mechanical ventilators = hemodynamic monitors.
Results
During July 2016, 125 admissions were registered in a census taken by the Emergency Room of Hospital Juarez de Mexico, located in Mexico City, recording the time of arrival and the medical evaluation of patients. The five figures of the distribution of the Normal StochCum Index (Table 3) show that the index discriminates the over-saturation of the Emergency Room (Example cases A, D, and E) from the cases of influenza (Examples cases B, and C). The maximum points in example cases A, D, and E correspond to the demand for specific equipment services and there are no cases of influenza reported (Figs. 1, 3, and 4). On the other hand, the reported cases of influenza (example cases B and C) can be differentiated from the demand of equipment by the red line (Figs. 2 and 5).
Figure 3 Distribution of Normal StochCum Index in July 2016 (from Appendix H), by day of the week, in the Emergency Room of Hospital Juarez de Mexico, located in Mexico City, Mexico. This figure corresponds to 2.2.2 Example cases section, (D entry).
Discussion
Infectious disease outbreaks are periods of great uncertainty. While events unfold, responsible decisions for a public health response must be made as quickly as possible, even though the evidence for decision-making may be scant, so resources and capacities (that are already scarce and limited) be deployed to cope with the infectious threat. Therefore, a surveillance system that gives early alerts and a forecast of risk and route of dissemination by continuous monitoring of a net of samples of the population through hospitals and clinics is of paramount importance.
In general, monitoring systems for severe infections make extrapolations from a minimum number of confirmed cases. Although it allows this forecast, it will surely be a weak estimate owing to the scant information available at the time of the outbreak. On the other hand, the stochastic models used for the prediction of outbreaks of this nature focus on the retrospective aspect and have been shown to be efficient in space/time forecast of the outbreak. This model takes the confirmed clinical cases into consideration as well as the available medical equipment in the net of hospitals along with non-clinical sociodemographic variables, allowing the forecast of the dissemination of the pathogen with a minimum number of identified subjects by giving an estimation of the probability of an outbreak in the hospital network. The model depends on timely updating of the variables (clinical and non-clinical), all of them with a different frequency of updating. However, it is important to note that the total index of any hospital in the network is increased not only by the confirmed cases but also by the gradual increase in the number of patients and the demand for medical supplies and equipment at a given date; that is, the model alerts the imminence of an outbreak over a specific region, even before any known or unknown microbiological results are known. The deterministic-stochastic model StochCum Method can be customized to any rural area, region, state, or country by modifying the 11 non-clinical variables described (Table 2).
With the availability and use of non-invasive microchips that collect and transmit with speed the geographical location and biometric data of the population at risk27-30, our surveillance system will develop into an "automatic" and robust one due to the large volume of data generated; of course, there will be the ethical dilemma of individual rights in the face of the rights of the society. Although the demand for electrical energy required by these devices to keep them running for years is still unresolved (graphene?, quartz?, and very low energy?), the combination of various techniques such as electricity sourced from movement, or solar radiation, or electrostatic differential in the air combined with or despicable energy consumption devices could be the solution, which is why it is necessary to assume that symptomatic subjects will continue to interact among the population, and, in hours, the subject could even move from one continent to another. In this sense, the efficiency of the proposed system requires it to be unique and accessible online. Another aspect to be discussed is the option to obtain the patient´s geographical location without using a passive GPS tracker27, that is, the geographical location can be "inherited" from the proximity with another known location. This prevents the use of a conventional GPS tracker and the energy demand involved in those devices. This predictive system would substantially benefit in the collection and transmission of biometric data with such microelectronic devices, or electronic trackers, that automatically census the patients in the different areas of the hospital or Emergency Room.
Technical dimensions are prominent in the solution of environmental, economic, social, and health care problems. Throughout history, technological progress has been a precondition for all forms of improvement in human welfare; therefore, the recognition that this diversity of perspectives would be advantageous for medical, public health, mathematical, and bioinformatics convergence is behind the idea that such a low-cost surveillance system will enable us to have a real-time census, with all its benefits that give us an early warning with the identification of the initial patients infected and the implementation in advance all known sanitary barriers.
Asymptomatic or presymptomatic patients will influence the model, causing a modification of its alert curves, in a range equivalent to the period that the symptoms remain hidden; however, the main feature of this model is its ability to give an early warning of an outbreak, with the clinical and non-clinical variables in the geographical areas where they occur. This will keep informed all hospitals in the network and will make decision-making for doctors and related health care personnel easier.
By last but not least, it is transcendental to express the change of the ecological consciousness incremented in the last decades, where the micro-habitats are correlated each other in a complex net where one of the factors modified the others. In this sense, the new concept of close environment.
Conclusions
The computational deterministic-stochastic system StochCum Method is an effective and practical algorithm that detects potential epidemic outbreaks of severe infections in hospitals, measuring a few clinical and non-clinical variables. This makes it possible to set a geographical area where the outbreak is happening and to forecast the possible route of dissemination.
Supplementary materials
The test files were supplied as support of the manuscript to the Mathematics but can be requested from Carlos Polanco (polanco@unam.mx).
Authors' contributions
Conception and design: JACG and CP. Programming: CP and RGG. Parameter analysis: JACG, CP, and RGG. Discussion: JACG, CP, RGG, and JDCR.
Availability
The deterministic-stochastic StochCum Method can be accessed in test mode. See its Users' manual in Supplementary materials section or by request to Carlos Polanco (polanco@unam.mx).
Software resources
Copyright and Trademark. All rights reserved (Mexico), 2019: StochCum Method. Software and Hardware. Hardware: The computational platform used to process the information was HP Workstation z210 - CMT - 4 x Intel Xeon E3-1270/3.4 GHz (Quad-Core) - RAM 8 GB - SSD 1 x 160 GB - DVD SuperMulti - Quadro 2000 - Gigabit LAN, Linux Fedora 30, 64-bits. Cache Memory 8 MB. Cache Per Processor 8 MB. RAM 8 Software: StochCum Method.

