


 nueva página del texto (beta)
 Inglés (pdf)
 Artículo en XML
 Referencias del artículo
 Enviar artículo por email
 Citado por SciELO
  Similares en
SciELO
Similares en
SciELO 
 Permalink
Introduction
Acute appendicitis (AA) is the most frequent surgical emergency around the world1,2. AA could be classified in four stages: catarrhal (stage I), phlegmonous (Stage II), gangrenous (Stage III), and perforated (Stage IV); the two last ones have been considered as complicated AA (CAA)3. In reference hospitals, an important number of CAA is attended4. An association between laparoscopic appendectomy and the development of comorbidities related to the surgical act has been documented in cases of both stages of CAA, but more in the context of a Stage IV or perforated appendicitis (PA)1. In these situations, the learning curve is the main limitation of the laparoscopic approach, when the McBurney's incision is preferred5. However, the diagnosis of AA usually poses a challenge to the surgeon; it is even more difficult to estimate its stage.
A predictive biomarker is defined as that condition that increases the risk of suffering from a disease, or that allows it to be diagnosed6. By apposition, a prognostic biomarker is a condition that allows estimating or establishing the prognosis of a pathology, per se or after a treatment. In this context, certain classic laboratory tests have been established as pre-operative biomarkers for CAA prediction1,6,7, namely: white blood cell (WBC) count, neutrophil percentage (N%), neutrophil-to-lymphocyte ratio (NLR), glucose, total bilirubin (TBil), C-reactive protein (CRP), and Procalcitonin (PCT). Its predictive usefulness differs according to the literature. Even though laparoscopic surgery is a safe way to approach CAA8, considering both surgeon experience and the context of each patient, estimating AA-stage will allow for a more individualized surgical behavior, as the possibility of a McBurney incision approach when suspicion of CAA. Thus, an important proportion of CAA can be predicted, the greater the number of patients benefited with a personalized indication. This will positively impact the prognosis, in terms of a lower frequency of comorbidities associated with the surgical act.
The aim of the study was to determine the usefulness of WBC, N%, NLR, glucose, TBil, CRP, and PCT as pre-operative biomarkers of CAA prediction at a Hispanic population from a public South American hospital. As a secondary objective, we also purposed to verify the usefulness of these biomarkers as predictors of PA, through a data sub-analysis.
Materials and methods
Study design
The following was an independent, observational, analytical, cross-sectional, and consecutive collected case-control study. It was carried out in patients attended due to any stage of AA at Emergency Department of Hospital Teodoro Maldonado Carbo (HTMC), a tertiary referral hospital at Guayaquil - Ecuador, from August 2016 to December 2017. The present study was presented in accordance with the strengthening the reporting of observational studies in epidemiology statement9.
Population
There were included patients ≥ 13 years old, in whom an open or laparoscopic appendectomy was performed due to clinical suspicion of AA. There were excluded patients with the history of abdominal pathology during 30 days before the diagnosis of AA; patients with history of comorbidities that may affect acute phase reactants (e.g., respiratory or renal infections, inflammatory bowel disease, and cancer ongoing specific treatment), or liver metabolism (e.g., acute or chronic hepatitis, and liver cirrhosis, choledocholithiasis); pregnancy or puerperium; cases in which AA has been ruled out due after histopathological analysis; as well as those patients whom clinical reports described partial information for the purpose of the present study.
Monitoring and retrieval of information
PRE-OPERATIVE STAGE
Once a case was enrolled in the present study, J.E-O. and I.R-R. recovered the demographic data as well as the results of the following biomarkers requested as part of the diagnosis of AA before surgery: WBC count, N%, NLR, glucose, TBil, CRP, and PCT.
OPERATIVE STAGE
During surgery, H.S-A. confirmed the presence and stage of AA, corroborating it with the description of the first operator in the final surgical report.
Statistical analysis
TECHNICAL CONSIDERATIONS
The data analysis was performed by M.P-T using the program R v3.6.3 (R Foundation for Statistical Computing; Vienna, Austria). p < 0.05 was considered to be statistically significant.
SAMPLE SIZE CALCULATION
The sample size was calculated using power.diagnostic.test function from the MKmisc (v1.6; Kohl M, 2019) package10. The sample size was estimated considering a 98% specificity of PCT for gangrenous and PA, as well as corresponding disease prevalence of 23% described by Molina-Saenz et al.11; a δ = 10%, an α and β-error of 5% and 20%, respectively. Through the previous described parameters, a sample size of 43cases and 13 controls was estimated, with an 80% statistical power. To respect the Central Limit Theorem (30 observations are necessary to reach a Gaussian distribution), we preferred to analyze no less than 30 patients in control group along study period12.
DESCRIPTIVE STATISTICS
Continuous variables were described as mean (standard deviation) or median (minimum-maximum range), depending on their distribution (normal or skewed), determined by the Kolmogorov-Smirnov test. The categorical variables were described in frequencies (%).
INFERENTIAL STATISTICS
Study variables difference among each AA-stage confirmed by histopathology was verified by the Kruskal-Wallis test for continuous variables, and Pearson's Chi-squared or Fisher's exact test for categorical variables. The area under the receiver operating characteristics (AUROC) curve was determined for each biomarker with statistical significance among AA-stages. Each biomarker was contrasted with two outcomes (gold standards) formed from the four AA-stages grouped: CAA (AA-stage III and IV) and PA (AA-stage IV). AUROC from each biomarker was contrasted among both outcomes using roc.test function from the pROC (v1.16.2; Robin X, 2020) package13. In those cases in which AUROC ≥ 75%14, the appropriate cutoff value for the biomarker test was determined by Youden's index. Subsequently, the diagnostic accuracy of such tests was determined through the following estimators: sensitivity, specificity, positive predictive value (PPV) and negative predictive value (NPV) positive and negative likelihood ratio (+LR and -LR, respectively), observed coincidence, and diagnostic odds ratio (OR). Figure 1 details the inferential statistical process in accordance with the study results.
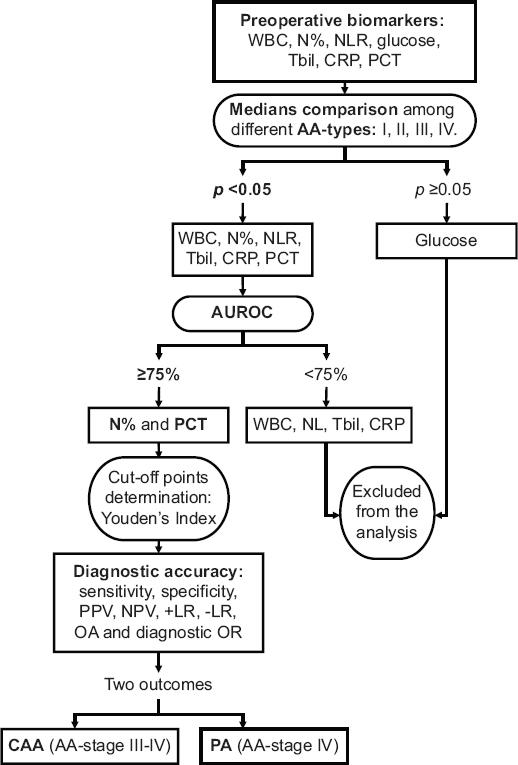
Figure 1 Approach of the inferential statistical process applied in the usefulness estimation of the different preoperative biomarkers for CAA and PA prediction. AA: acute appendicitis; CAA: complicated acute appendicitis; CRP: C-reactive protein; PA: perforated appendicitis; NLR: neutrophil-to-lymphocyte ratio; N%: neutrophil percentage; NPV: negative predictive value; OA: observed agreement; OR: odds ratio; PCT: procalcitonin; PPV: positive predictive value; TBil: total bilirubin; WBC: white blood cell count; +LR: positive likelihood ratio; -LR: negative likelihood ratio.
Ethic aspects
The presented study respected the stipulations of the Declaration of Helsinki (2008). Approval of the Medical Faculty Graduate School Institutional Review Board of Universidad Espíritu Santo and Clinical Research and Teaching Department of HTMC was obtained. All patients included in the study signed informed consent.
Results
The population selection is detailed in figure 2. Along study period, a total of 128 patients were enrolled. Forty-four cases (34.4%) were female. According to post-surgical diagnostic and further histopathological confirmation, there were 6/128 (4.7%) AA-stage I (or catarrhal), 52/128 (40.6%), AA-stage II (or phlegmonous), 32/128 (25%), AA-stage III (or gangrenous), and 38/128 (29.7%) AA-stage IV (or perforated) cases. Both AA-stage III and IV represented the total of CAA cases (70/128; 54.7%). There was no significant statistical difference among age, gender, or median glucose concentration versus each AA-stage. Nonetheless, median concentrations of TBil, N%, WBC count, NLR, CRP, and PCT show statistically significance difference among different AA-stages. This difference consisted in a gradual rise of median concentration of such values directly correlated to AA-stages. WBC count measurement for AA-stage I, II, III, and IV was: 11.16, 12.30, 15.40, and 16.05 103/μL (p < 0.001); N%: 74.0%, 70.6%, 82.0%, and 85.1% (p < 0.001); NLR: 5.52, 4.81, 5.69, and 5.59 (p < 0.001); TBil: 0.88, 0.69, 0.98, and 1.01 mg/dL (p < 0.001); CRP: 4.82, 0.33, 24.70, and 3525.0 mg/dL (p < 0.001); and PCT: 0.08, 0.05, 0.14, and 0.64 ng/dL (p < 0.001); respectively (Table 1).
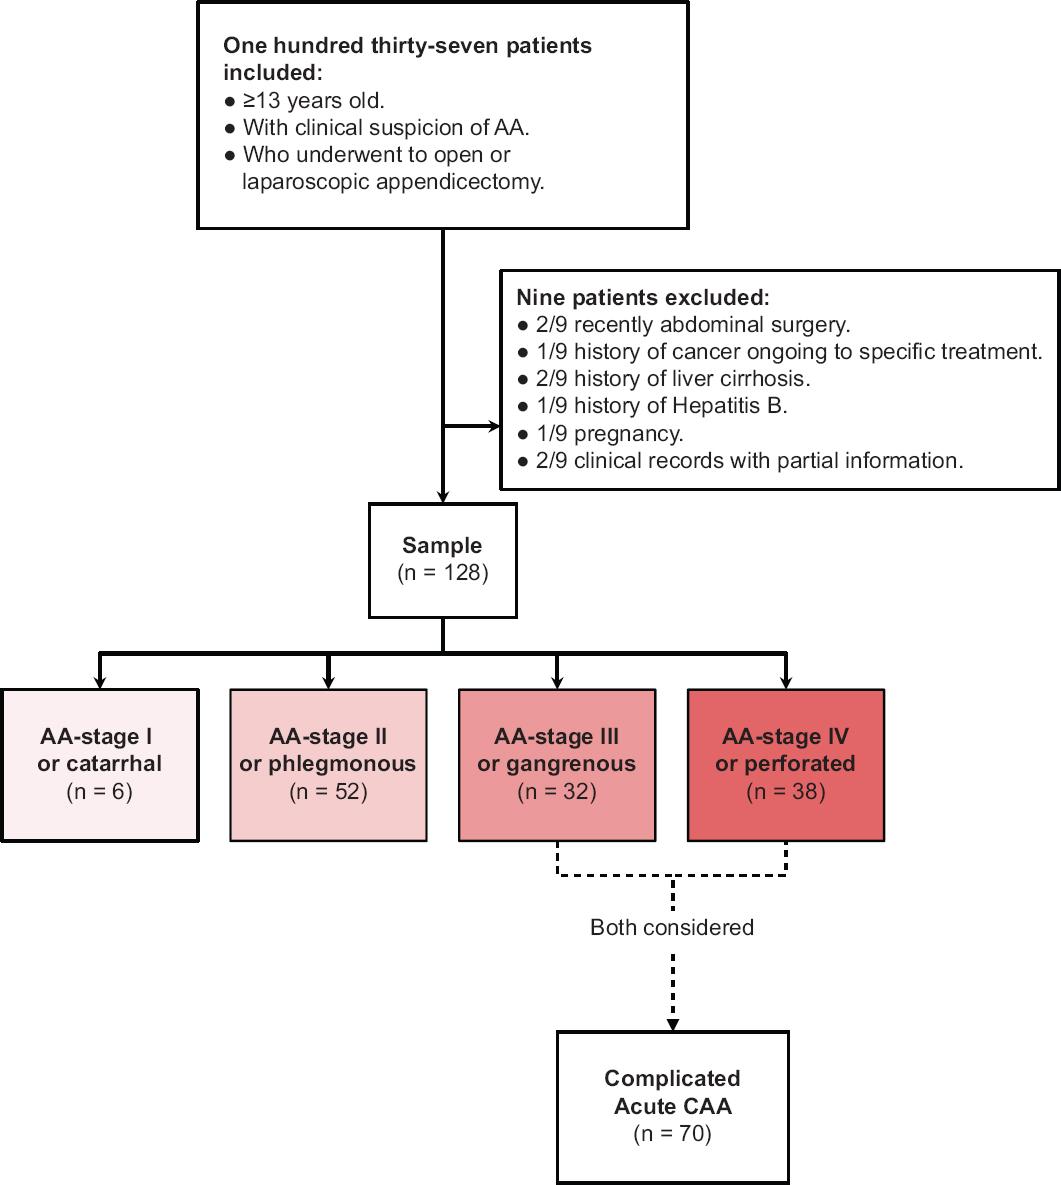
Figure 2 Strengthening the reporting of observational studies in epidemiology patient's selection flowchart. AA: acute appendicitis; CAA: complicated acute appendicitis.
Table 1 Baseline, clinical, and pathological characteristics according to the histopathological diagnosis of acute appendicitis
| Overall (n = 128) | AA-stage I or catarrhal (n = 6) | AA-stage II or phlegmonous (n = 52) | AA-stage III or gangrenous (n = 32) | AA-stage IV or perforated (n = 38) | p-value | |
|---|---|---|---|---|---|---|
| Age (years), median (range) | 30 (13-90) | 32 (26-43) | 25 (13-65) | 27.5 (16-90) | 42 (13-76) | 0.043a |
| Sex (female), n (%) | 44 (34.4) | 2 (33.3) | 18 (34.6) | 6 (18.8) | 18 (47.4) | 0.097b |
| AA evolution until surgery, n (%) | < 0.001b | |||||
| < 24 h | 62 (48.4) | 6 (100.0) | 28 (53.8) | 22 (68.8) | 6 (15.8) | |
| 24-48 h | 24 (18.8) | 0 | 12 (23.1) | 4 (12.5) | 8 (21.1) | |
| > 48 h | 42 (32.8) | 0 | 12 (23.1) | 6 (18.8) | 24 (63.2) | |
| WBC count (103/µL), median (range) | 15.32 (4.93-31.29) | 11.16 (9.82-16.85) | 12.30 (4.93-22.23) | 15.40 (6.29-23.13) | 16.05 (11.43-31.29) | < 0.001a |
| ≤ 13 × 103/µL | 42 (32.8) | 4 (66.7) | 28 (53.8) | 6 (18.8) | 4 (10.5) | |
| > 13 × 103/µL | 86 (67.2) | 2 (33.3) | 24 (46.2) | 26 (81.3) | 34 (89.5) | |
| n %, median (range) | 80.80 (45.50-94.60) | 74.0 (45.5-74.6) | 70.6 (48.4-90.8) | 82.0 (47.2-93.6) | 85.1 (75.2-94.6) | < 0.001a |
| ≤ 74% | 42 (32.8) | 4 (66.7) | 28 (53.8) | 10 (31.3) | 0 | |
| > 74% | 86 (67.2) | 2 (33.3) | 24 (46.2) | 22 (68.8) | 38 (100.0) | |
| NLR, median (range) | 5.28 (1.25-37.28) | 5.52 (4.07-7.59) | 4.81 (1.60-21.11) | 5.69 (1.25-37.28) | 5.59 (3.04-35.00) | 0.037a |
| ≤ 5 | 54 (42.2) | 2 (33.3) | 32 (61.5) | 12 (37.5) | 8 (21.1) | |
| > 5 | 74 (57.8) | 4 (66.7) | 20 (38.5) | 20 (62.5) | 30 (78.9) | |
| Glucose (mg/dL), median (range) | 102.00 (67.00-361.00) | 110.0 (103.0-122.0) | 97.0 (71.0-361.0) | 113.0 (80.0-169.0) | 108.0 (67.0-150.0) | 0.171a |
| ≤ 110 mg/dL | 74 (57.8) | 4 (66.7) | 38 (73.1) | 12 (37.5) | 20 (52.6) | |
| > 110 mg/dL | 54 (42.2) | 2 (33.3) | 14 (26.9) | 20 (62.5) | 18 (47.4) | |
| TBil (mg/dL), median (range) | 0.90 (0.11-2.43) | 0.88 (0.79-0.92) | 0.69 (0.11-2.08) | 0.98 (0.40-2.02) | 1.01 (0.36-2.43) | < 0.001a |
| ≤ 1.0 mg/dL | 80 (62.5) | 6 (100.0) | 40 (76.9) | 16 (50.0) | 18 (47.4) | |
| > 1.0 mg/dL | 48 (37.5) | 0 | 12 (23.1) | 16 (50.0) | 20 (52.6) | |
| CRP (mg/dL), median (range) | 4.59 (0.04-37760.00) | 4.82 (0.27-3990.0) | 0.33 (0.04-22990.0) | 24.70 (0.16-37760.0) | 3525.0 (0.10-32280.0) | < 0.001a |
| ≤ 1 mg/dL | 48 (37.5) | 2 (33.3) | 32 (61.5) | 8 (25.0) | 6 (15.8) | |
| > 1 mg/dL | 80 (62.5) | 4 (66.7) | 20 (38.5) | 24 (75.0) | 32 (84.2) | |
| PCT (ng/dL), median (range) | 0.12 (0.02-12990.00) | 0.08 (0.06-0.13) | 0.05 (0.02-0.97) | 0.14 (0.02-12990.0) | 0.63 (0.02-9990.0) | < 0.001a |
| ≤ 2 ng/dL | 102 (79.7) | 6 (100.0) | 52 (100.0) | 24 (75.0) | 20 (52.6) | |
| > 2 ng/dL | 26 (20.3) | 0 | 0 | 8 (25.0) | 18 (47.4) |
AA: acute appendicitis; CRP: C-reactive protein; NLR: neutrophil-to-lymphocyte ratio; N%: neutrophil percentage; PCT: procalcitonin; TBil: total bilirubin; WBC: white blood cells. a: Kruskal-Wallis test; b: Pearson's Chi-squared test; c: Bonferroni's correction.
The N% and PCT values presented an AUROC ≥75% for predicting CAA (AA-stage III and IV) and PA (AA-stage IV) (Fig. 3), while WBC count, NLR, and TBil reached AUROC values between 60% and 73% for both outcomes. CRP reached an AUROC of 75.3% for predicting CAA, but 69.7% for predicting PA, thus CRP was also excluded for further statistical analysis along with WBC, NLR, and TBil, in accomplishment with the proposed methodology. There is important to remark that there was no statistical difference between CAA versus PA AUROC in any of the analyzed pre-operative biomarker (Table 2).
Table 2 Area under the receiver operating characteristics curve for each preoperative biomarker where the null hypothesis was rejected (p < 0.05) during the median comparison among each stage of AA, considering as outcomes CAA and PA
| Biomarkers | CAA (AA-stage III and IV) | PA (AA-stage IV) | p-value |
|---|---|---|---|
| White blood cells count | 71.8% | 72.8% | 0.972 |
| Neutrophils percentage | 78.2% | 75.6% | 0.809 |
| Neutrophil-to-lymphocyte ratio | 64.6% | 60.2% | 0.826 |
| Total bilirubin | 71.7% | 70.8% | 0.591 |
| C-reactive protein | 75.3% | 69.7% | 0.423 |
| Procalcitonin | 80.4% | 81.1% | 0.939 |
AA: acute appendicitis; CAA: complicated acute appendicitis; PA: perforated appendicitis.
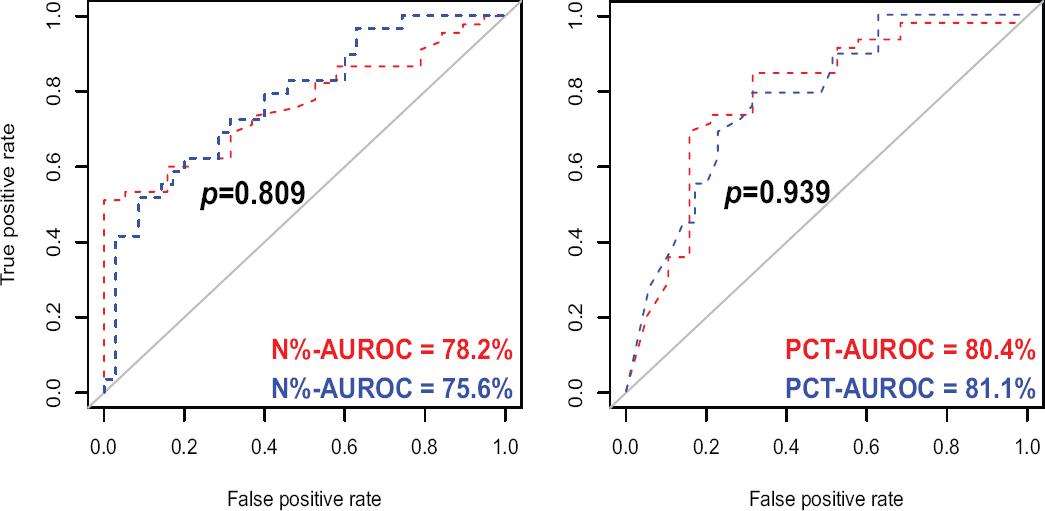
Figure 3 Pre-operative biomarkers which reached an area under the receiver operating characteristics curve ≥ 75% considering as outcomes CAA and PA. A: neutrophil percentage (N%; %) versus CAA (blue curve) and PA (red curve); B: procalcitonin (PCT; ng/dL) versus CAA (blue curve) and PA (red curve). CAA: complicated acute appendicitis; PA: perforated appendicitis.
According to Youden's index estimation, the cutoff point of N% among CAA or PA was 78.1%-74.9%, respectively. Regarding PCT, the cutoff point for an optimal diagnostic accuracy was 0.14 ng/dL for both CAA and PA. Considering both cutoff values, there were a statistically significant association between N% and PCT versus CAA (p < 0.001) and PA (p < 0.001) prediction.
Considering the previous described cutoff values, N% and PCT diagnostic accuracy for predicting CAA and PA were estimated and summarized in table 3. For CAA, N% reached a sensitivity, specificity, PPV, NPV, observed agreement, and diagnostic OR of 80%, 62%, 72%, 72%, 72%, and 6.55, respectively; for PA sub-analysis, 95%, 52%, 46%, 96%, 65%, and 8.36, respectively. PCT reached also a sensitivity, specificity, PPV, NPV, observed agreement, and diagnostic OR of 69%, 79%, 80%, 68%, 73%, and 20.57 for predicting CAA; and 84%, 69%, 53%, 91%, 73%, and 11.81 for predicting PA, respectively. Both N%/PCT sensitivity and NPV were particularly higher for PA sub-analysis.
Table 3 Diagnostic accuracy of the value of neutrophils percentage (N%) and PCT, for predicting CAA and PA
| CAA (AA-stage III and IV) | PA (AA-stage IV) | |
|---|---|---|
| Neutrophil percentage (n %) | ||
| Sensitivity, % (95% CI) | 56/70 (80.00 [68.73-88.61]) | 36/38 (94.74 [82.25-99.36]) |
| Specificity, % (95% CI) | 36/58 (62.07 [48.37-74.49]) | 48/90 (53.33 [42.51-63.93]) |
| PPV, % (95% CI) | 56/78 (71.79 [64.22-78.31]) | 36/78 (46.15 [40.43-51.98]) |
| NPV, % (95% CI) | 36/50 (72.00 [60.70-81.07]) | 48/50 (96.00 [86.00-98.94]) |
| +LR (95% CI) | 2.11 (1.49-2.99) | 2.03 (1.61-2.56) |
| -LR (95% CI) | 0.32 (0.19-0.54) | 0.10 (0.03-0.39) |
| OA, % (95% CI) | 71.88 (63.25-79.46) | 65.62 (56.72-73.79) |
| Diagnostic OR (95% CI) | 6.55 (2.97-14.42) | 8.36 (3.72-18.83) |
| Procalcitonin (PCT) | ||
| Sensitivity, % (95% CI) | 48/70 (68.57 [50.71-83.15]) | 32/38 (84.21 [60.42-96.62]) |
| Specificity, % (95% CI) | 46/58 (79.31 [60.28-92.01]) | 62/90 (68.89 [53.35-81.83]) |
| PPV, % (95% CI) | 48/60 (80.00 [65.46-89.41]) | 32/60 (53.33 [41.51-64.79]) |
| NPV, % (95% CI) | 46/68 (67.65 [55.33-77.92]) | 62/68 (91.18 [78.22-96.75]) |
| +LR (95% CI) | 3.31 (1.57-7.00) | 2.71 (1.68-4.36) |
| -LR (95% CI) | 0.40 (0.23-0.67) | 0.23 (0.08-0.66) |
| OA, % (95% CI) | 73.44 (64.91-80.85) | 73.44 (64.91-80.85) |
| Diagnostic OR (95% CI) | 20.57 (4.67-90.63) | 11.81 (4.43-31.45) |
AA: acute appendicitis; CAA: complicated acute appendicitis; CI: confidence interval; NPV: negative predictive value; OA: observed agreement; OR: odds ratio; PA: perforated appendicitis; PPV: positive predictive value; +LR: positive likelihood ratio; -LR: negative likelihood ratio.
Discussion
The aim of the present study was to determine the usefulness of the different pre-operative biomarkers in patients with clinical suspicion of CAA. The role of certain biomarkers in the prediction of perforation of the appendix has been described in the literature: WBC count, N%, NLR, glucose, TBil, CRP, and PCT1,6,7. From these examinations, in the present study, there were confirmed a high diagnostic accuracy for N% (AUROC of 78% and 76%; p = 0.809) and PCT (AUROC of 80% and 81%; p = 0.939) for predicting both CAA and PA, respectively. A non-significant difference between CAA and PA-AUROC in both biomarkers let us understand that they must be interpreted conjunctively. N% and PCT reached a very good sensitivity and PPV for predicting CAA (80%) and PA (80%). N% and PCT NPV were particularly higher for PA sub-analysis: N% 96%, PCT 91%; in contrast with CAA analysis: N% 72%, PCT 68%. A negative N% (≤ 74.9%) or PCT (≤ 0.14 ng/dL) represented potential biomarkers for discarding a PA from a highly suspected case with AA. NLR did not show statistical significance for predicting CAA. In our series, it was due to a limited AUROC, in correspondence with diagnostic accuracy for distinguishing among CAA versus non-CAA described by Beecher et al.15, but in opposition with reported results by another authors16-18.
N% as a preoperative biomarker of CAA has been recently less studied in comparison with other biomarkers as LNR, CRP, or PCT. Park et al. designed an observational retrospective study where they analyzed WBC count, N%, CRP, and immature granulocyte percentage (IG%) between AA patients and a non-AA control group. N% reached higher diagnostic accuracy compared with CRP and IG%, with a sensitivity, specificity, PPV, NPV, +LR, and -LR of 67%, 64%, 66%, 66%, 1.88, and 0.51 for predicting AA.
Beltrán et al. determined in a similar study that CRP and TBil showed greater sensitivity and specificity (75% and 51%, respectively). As strength of this study, the validation of the cutoff points of the different biomarkers can be highlighted. As a limitation, the difference between the study groups, from which the results were inferred: the simple appendicitis group was almost double than the PA group19. PCT has been considered as a pre-operative biomarker for AA prediction in more recently studies20. Molina-Sáenz et al. performed an analysis of PCT for the prediction of CAA. Here, the sensitivity and specificity of this marker were 56% and 98%, respectively. These results are more consistent with the present study11.
In the present study, PCT reached a very high maximum range for AA-type III and IV (12990.0 and 9990.0 ng/dL, respectively), while the maximum ranges for AA-type I and II were lower than the standard cutoff (0.13 and 0.97, respectively). As described by Godínez-Vidal et al., in a Mexican series of 182 patients with abdominal sepsis diagnosis, PCT reached a median of 9.76 ± 24.63 ng/dL21. Precursive inflammatory cascade from a potential abdominal sepsis in the context of a CAA is an explicable way to understand the statistically significant difference between median PCT levels among CAA versus non-CAA cases, and even the slightly higher PCT-AUROC in PA sub-analysis when comparing with AA-type I-III.
Acharya et al. performed a 62 full-text articles systematic review, which analyzed different biomarkers as predictive factors of AA. There were including seven researches which considered to study PCT. For the diagnosis of PA, the pooled sensitivity of PCT was 0.69 (95% CI 0.62-0.76; I 2 = 93 %) and pooled specificity was 0.67 (95% CI 0.62-0.71; I 2 = 97 %), giving an AUROC of 0.83 ± 0.0722.
The present study has the following strengths: it was developed at a referral center of the Ecuadorian Social Security System (HTMC), which provides clinical attention to an important percentage of the population from Guayaquil, the largest city at Ecuador23; all patients were prospectively enrolled and fully treated at HTMC; it counted with a very strong methodology, sampling size, and statistical analysis. Among the main limitation of this study is its observational design, where it depends on the request and availability of laboratory reagents to carry out the studies that have been analyzed in this project. Biomarkers as Interleukin-6 or 5-Hydroxyindoleacetic acid urinary serotonin22 would be interesting to include in this analysis. Another limitation was the low number of non-CAA cases, especially AA-type I, despite local regulations that they should be attended at a secondary hospital. A non-healthy control group is another aspect to be considered in the study design.
Conclusion
Pre-operative biomarkers such as WBC count, NLR, glucose, TBil, or CRP appears to have a low predictive power for differentiating CAA from non-CAA, compared with N% and PCT. The NPV of a N% > 74.9% or PCT > 14 ng/dL could be useful to discard a PA in the clinical context of a highly suspected patient with AA. Considering our results, the design of diagnostic trials with a larger population could be necessary to define the role of N%, PCT, or another novel pre-operative biomarker for differentiating CAA from non-CAA.

