


Services on Demand
Journal
Article
 text in
  English (pdf)
 Article in xml format
 Article references
 Send this article by e-mail
Indicators
-
 Cited by SciELO
 -
 Access statistics
Related links
-
 Similars in
SciELO
Similars in
SciELO
Share

 Permalink
Textual: análisis del medio rural latinoamericano
On-line version ISSN 2395-9177Print version ISSN 0185-9439
Textual anál. medio rural latinoam. n.72 Chapingo Jul./Dec. 2018
https://doi.org/10.5154/r.textual.2017.72.007
Economics and public policies
Social and economic characterization of bee honey production in the north of the State of Campeche, México
1Instituto Campechano. Campeche, México.
2Universidad Autónoma Chapingo, DICEA y Coordinador del Centro de Investigación y Servicio en Economía y Comercio Agropecuario (CISECA), km 38.5 carretera México-Texcoco, Chapingo, Texcoco, Estado de México.
3Universidad Autónoma Chapingo, Depto. de Preparatoria Agrícola, Línea de Investigación y Servicio del CISECA.
4Universidad Autónoma del Carmen. Campeche, México.
The state of Campeche is one of the leading producers of bee honey in Mexico. In 2014 a production of seven thousand tons of honey was recorded with a value of more than two hundred twenty-five million pesos, about seventeen million dollars. The aim of this paper is to socially and economically characterize bee honey production in the north of the state of Campeche, Mexico with data about education, land tenure, organization, costs, income, and profitability. The bee honey producers are ejidatarios, older than fifty years of age, and have low levels of education: more than 75 % have not finished junior high school. Furthermore, it was found that beekeeper production costs were more than eighty-two thousand pesos, of which 78% were for variable costs, mainly costs for paying for sugar, apistan (Apistan® Anti-Varroa Strips) and labor; about 22% correspond to fixed costs, basically made up of the depreciation of fixed costs. The average income obtained was higher than one hundred seventy thousand pesos, with a benefit-cost ratio of about two. Therefore, the producers in the north of the state of Campeche are efficient and profitable in producing bee honey.
Keywords: Costs; factors; income; profitability
El estado de Campeche es uno de los principales productores de miel de abeja en México, en el año 2014 registró una producción de más de siete mil toneladas de miel, con un valor mayor a doscientos veinticinco millones de pesos, alrededor de diecisiete millones de dólares. El objetivo de este trabajo fue realizar la caracterización social y económica de la producción de miel de abeja en el Norte del estado de Campeche, México, con indicadores de educación, tenencia, organización, costos, ingresos y rentabilidad. Los productores de miel de abeja son ejidatarios, mayores de cincuenta años y tienen bajos niveles de educación, más del 75 % no tienen secundaria concluida. Por otro lado, se obtuvo que los costos de producción de los apicultores fueron mayores de ochenta y dos mil pesos, el 78 % representa a los costos variables, principalmente gastos por la compra de azúcar, apistán y mano de obra; y alrededor del 22 % corresponde a los costos fijos, conformado básicamente por la depreciación de los activos fijos. El ingreso promedio obtenido fue mayor a ciento sesenta mil pesos, generando una relación beneficio costo de alrededor de dos, por lo que los productores del Norte del estado de Campeche son eficientes y rentables en la producción de miel de abeja.
Palabras clave: Costos; factores; ingresos; rentabilidad
Introduction
Apiculture in Mexico has great social, economic, and ecological importance since it is one of the main livestock activities which generates jobs, income and foreign-exchange for rural producers through the production of honey, wax, pollen, royal jelly, and propolis. Apiculture production also plays a significant role in the equilibrium of the environment in the producing areas since the bees, when obtaining food from the flowers, promote fertilization of the plants and their ability to produce (Moritz, 1991).
Honey bees have settled and reproduced almost everywhere in the world, except in the extreme climate regions of the planet such as Antarctica and the Arctic. They live in regions with very cold climates in winter and in the tropics with very high temperatures in summer. As a result of specific climatic conditions and peculiarities of the nectariferous flora of the different regions of the world, many different races of bees developed during the course of evolutionary history, the Apis mellifera being the most outstanding, the most widespread of these species in almost all the world (Gupta, 2014).
World bee honey production has undergone a significant increase, reaching record highs in total trade, exceeding four billion dollars in exports and imports in 2014 (USDA, 2017). Among the reasons for the increase in trade is the increase in world demand, which was favored by greater purchases by countries which had traditionally been honey producers (ODEPA, 2014).
The five leading bee honey producing countries are China (30.6 %), Turkey (6.9 %), the United States of America (5.4 %), Iran (5.0 %) and Russia (5.0 %), which account for about 53 % of total production. Mexico is one of the top ten honey-producing countries (eighth place), recording an average yearly production in the last ten years of about 56 thousand tons, 3.7 % of world production (FAOSTAT, 2017).
Mexico produces high-quality bee honey that is highly valued in different countries in the European Economic Community and in the United States of America for its nutritional and therapeutic properties, as well as for its aroma, taste, and color. From the creamy honey of the Altiplano harvested in the autumn to the orange blossom (Citrus sinensis) honey harvested in the spring in Veracruz and Tamaulipas, and from the morning glory (Ipomoea triloba) honey from Oaxaca, Puebla, and Guerrero to the aromatic honeys from the Yucatan Peninsula obtained in Ja´abin (Piscidia piscipula L.) and Taj (Viguiera dentata Blake), (Villanueva & Colli, 1996), Mexican honey is distributed in the domestic market and, mainly, in the international market since, on average, about 50 % of national yearly production is exported, with Mexico placing fourth worldwide (5.7 %) in the export of bee honey (FAOSTAT, 2017).
The main producers of bee honey in Mexico are Yucatán (13.5 %), Campeche (10.5 %), Veracruz (8.6%) and Jalisco (8.3%), (SIACON, 2017). In the state of Campeche, the greatest honey production is concentrated in the municipalities of Campeche and Hopelchen, which account for more than 75 % of state production, followed by Calakmul, Champotón and Escarcega, which generate more than 17 % of production, while the municipalities of Candelaria, El Carmen, Hecelchakán, Tenabo and Calkini provide about 7 %, and, lastly, Palizada produces less than 1 % (SIACON, 2017). The municipality of Palizada has few producers but has a large area to undertake bee honey production (SEMARNATCAM, 2013).
The state of Campeche ranks second nationally as a bee honey-producing state. In 2016 it produced 5,834 tons of honey, valued at 196,591,520 Mexican pesos (10,529,069 dollars), and 2.49 tons of bee wax, with a value of 172,100 Mexican pesos, equivalent to 9,217 dollars (SIACON, 2017). Bee honey production in Campeche is one of its most important activities due to the economic and social benefits it represents, since about 12,000 families in the state’s rural social sector directly depend on it (SEMARNATCAM, 2013).
The social and economic aspects that are characterized in this study are the level of education, land tenure, and the organization of the producers, as well as the costs, income and profitability of production, among others. The level of education refers to the level of schooling that producers have (primary, junior high, high school, undergraduate and graduate studies). Land tenure refers to the type of property (ejidal, private or communal) where production takes place (Ley Agraria, 1992). The organization of the producers refers to whether they belong to a legally constituted organization (Ley Agraria, 1992).
Costs are associated with the sum of expenses incurred to obtain the resources used in production, such as the elaboration and distribution processes of the product or service which can be evaluated at the social or private level (Gould & Edward, 1994). Income refers to the value obtained from the sale of the main product and secondary products when there are any.
Competitiveness at the economic unit level unit considers income, cost, price-cost ratio and rate of profit. The price-cost ratio highlights the ability to obtain benefits from economic units (businesses) by relating market prices with the production costs of the good. The profit rate or margin determines efficiency on the basis of net relative benefits. It is defined as the difference between total sales and total costs (Ibáñez & Caro, 2001).
The aim of this paper is to obtain a social (level of education, land tenure and organization) and economic (costs, income, break-even point, profit and rate of return) characterization of bee honey production in the north of the state of Campeche.
Methodology
Field information
Field information was obtained from the producers and the production process. Stages, inputs, quantities and prices of inputs and outputs (products) were identified in the production process. Information was obtained in the study area by applying ten questionnaires as a pilot sample to producers in the municipalities of Tenabo, Hecelchakán and Calkini, from which and by using simple random sampling, a type of sampling in which each of the elements of the sample of size n has the same probability of being selected (Mendenhall, Beaver, & Beaver, 2010) with a 95 % confidence level and a 5 % significance level, the average and the variance of the honey production yield variable was calculated, with which the sample size was calculated, yielding a sample of 97 questionnaires.
The producers interviewed were grouped into three levels according to the number of apiaries they own, resulting in the first two levels being formed by 32 producers each and the last by 33. The ranges by level are: Level I, from 1- 100 apiaries; Level II, from 101-150 apiaries; and Level III, more than 150 apiaries.
The variables identified for the social and economic characterization of bee honey production were: age, education, organization, type of tenure, manual labor, number of apiaries, number of hives, implements, food products, pesticides, and prices of inputs and products, among others. Percentage values and production costs were calculated with the expenses incurred for labor and purchases of sugar, vitamins and other items. Income was calculated by taking into consideration the prices and quantities for the sale of the honey. Based on this information, the cost and income structure at different levels was determined to carry out the analysis of costs and profitability of bee honey production.
Calculation of costs, income and profitability
The estimated values are the proportions, production costs, cost structure, income, price-cost ratio and profit rate.
Proportions. Proportions were calculated by dividing the partial value by the total value. The calculation procedure was:
Where:
VT = Total value
VP = Partial value
Production costs. Production costs were calculated by multiplying the amount of in puts used per production unit by the unit price of each of them in each of the produc tion stages and, finally, the costs of each production stage were added to obtain the total cost, as shown below:
Where:
CPE = Production cost per stage ($)
Qi = Input amount (kg)
Pi = Unit price of input ($/kg)
CPT = Total production cost ($)
Cost Structure. Cost structure was obtained by dividing the per-stage production cost by the total production cost, multiplied by one hundred to obtain the percentage.
Where:
CPE = Production cost per stage ($)
CPT = Total production cost ($)
Income. Income was estimated by multiplying the yields obtained per production unit by the unit price of the product in the market.
Where:
Y = Income ($)
R = Yield (kg∙hive-1)
Pu = Unit price of the product ($∙kg-1)
Unit cost-price ratio. The unit cost-price ratio was obtained by dividing the price and the unit cost of a production unit.
Where:
RPCu = Unit cost-price ratio
Px = Unit price of honey at production unit level ($∙kg-1)
Cx = Unit cost of honey production ($∙kg-1)
Profit rate. Profit rate was obtained by subtracting one from the price-cost ratio, thus obtaining the profit rate per peso invested.
Where:
TG = Profit rate
PX = Unit price of honey at production unit level ($∙kg-1)
Cx = Unit cost of honey production ($∙kg-1)
Results and discussion
Characterization of producers
The variables characterized in this section are age, education, land tenure, the organization of producers, and the aid they receive from the government.
Age. The average age of the bee honey producers is 53.58 years old; the average age of the small producers is 54.72 years old and that of the medium size ones is 53.22 years old, while the large producers average 52.82 years old. The advanced age of the producers can be a limitation to adopting new technologies to improve yields.

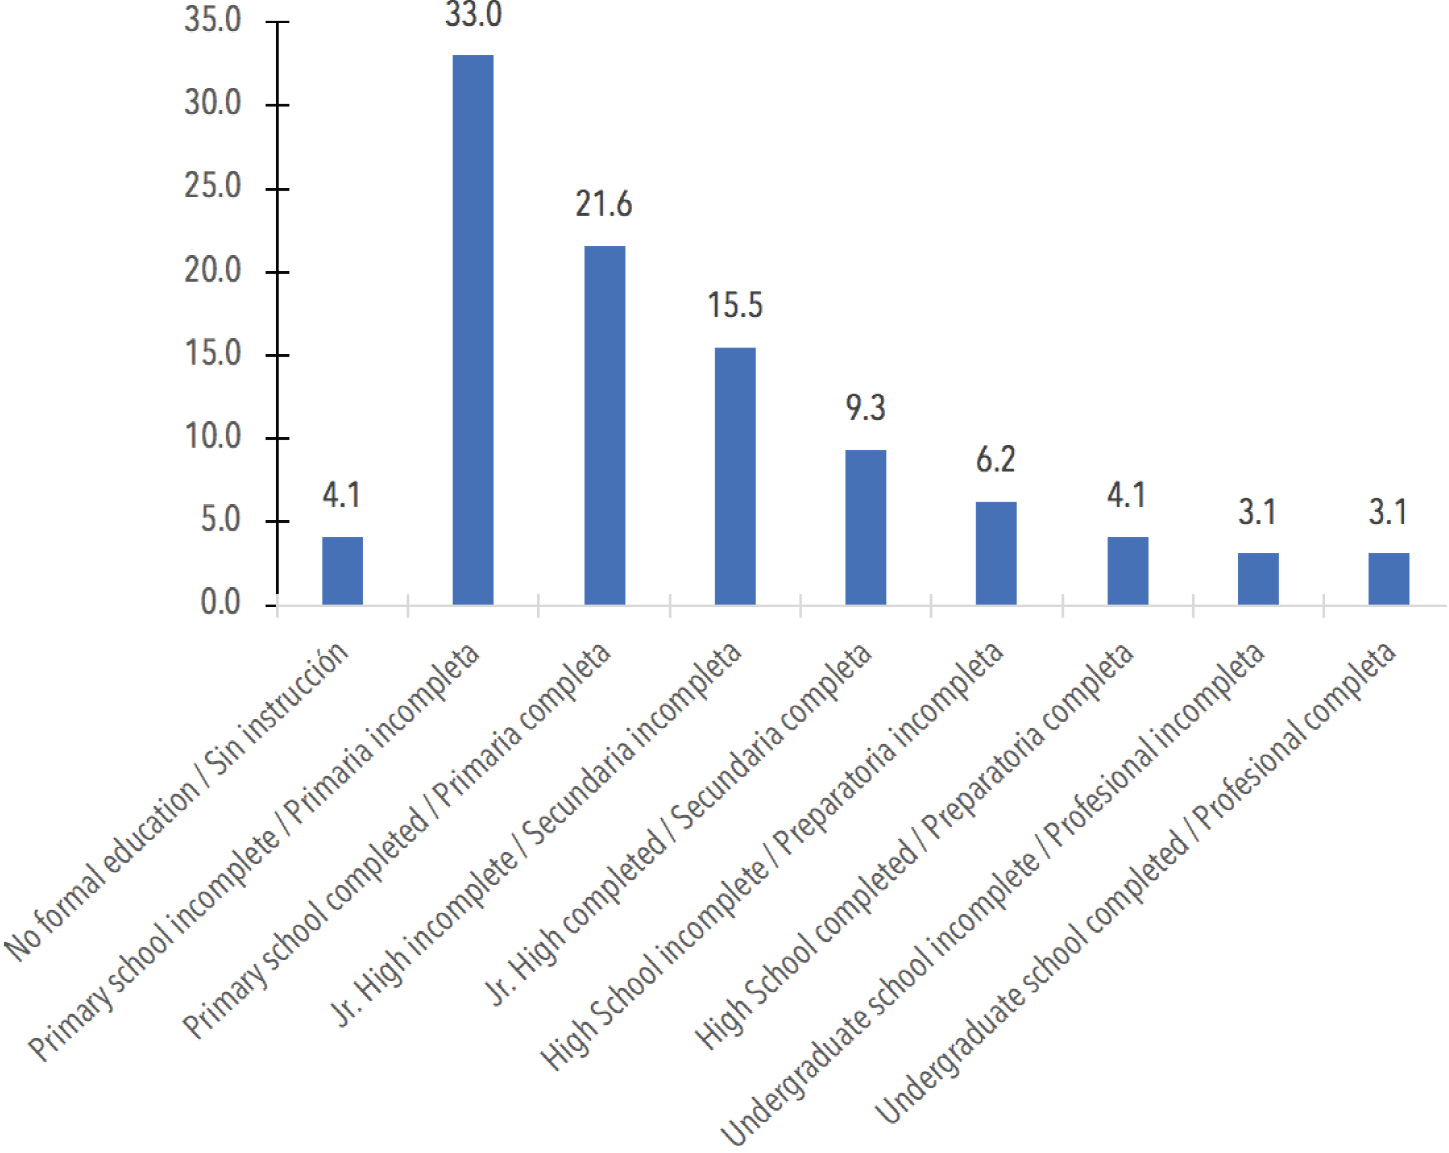
Education level. The level of education of the bee honey producers is low, given that 4.1 % have no schooling, 33 % did not finish primary school, 21.6 % finished primary school, 15.5% did not finish junior high school, which represents close to 75 % of the total. The low level of education of the bee honey producers might be a limitation to adopting technological innovations to impr4ove production.
Land tenure. The bee honey producers have their apiaries on ejidal land. One of the advantages of maintaining the ejidal regime is that it permits the producers to receive government aid from, among others, the Programa de Producción Pecuaria Sustentable y Ordenamiento Ganadero y Apícola (PROGAN).
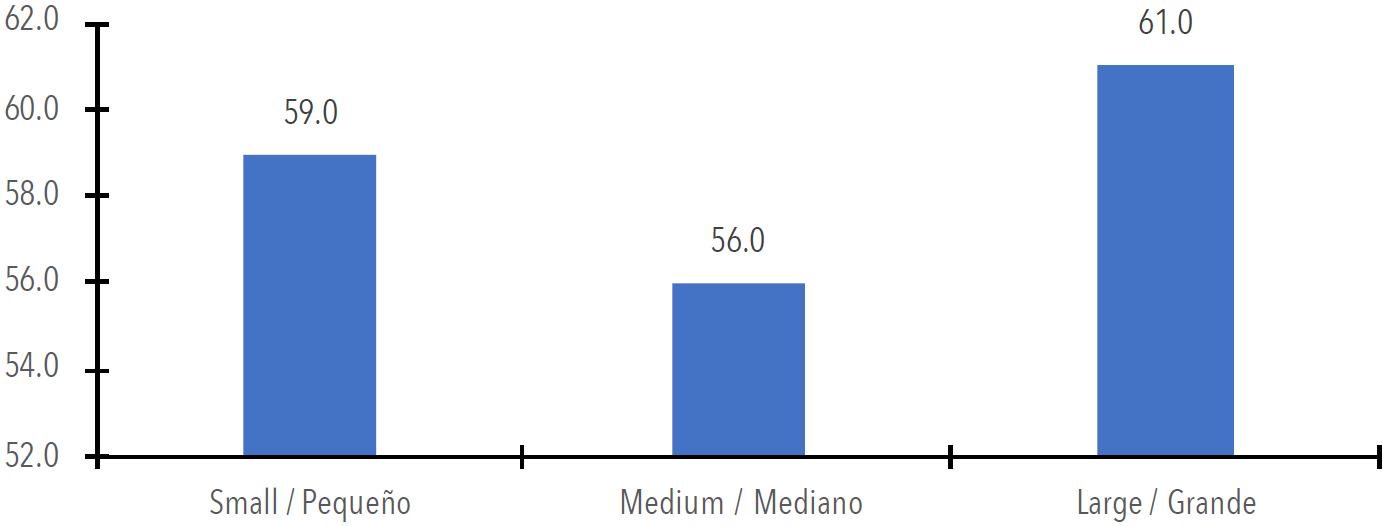
Aid and organization for production. An average of 59 % of the producers receive aid from PROGAN, 61 % of the large producers, 56 % of the medium size ones and 59 % of the small producers. This aid corresponds to $70 (Mexican pesos) per hive registered in the Sistema Nacional de Identificación Individual de Ganado (SINIIGA).
On the other hand, 77 % of the beekeepers belong to a producers’ organization and 49 % receive technical assistance, among other types. Sixty-six per cent of the small-level producers belong to some organization, while 75 % of the midlevel and 91% of the high-level ones do. Belonging to a producers’ organization is advantageous when undertaking the process for applying for government aid, as well as when buying large volumes of sugar, the main food of the bees when flowering and climate conditions are unfavorable to bee-keeping. 0
Producers in the large level are those who have a higher academic level and also have greater productivity. Sixty-four per cent of these producers receive technical assistance, and 91 % in this level belong to some apicultural organization as well. On the other hand, those at the small level are older and have a lower schooling level. The level of education is directly related to receiving development programs in which there is a diffusion of new technologies for apicultural development and operation.

Other activities. The producers, besides beekeeping, are also farmers; of those in Levels I & II, 75 % and 53 % are involved in farming and beekeeping respectively. In Level III, 54 % are also involved in these two activities. The producers undertake different activities for the maintenance of their apiaries. The basic work is checking the hives, cleaning them, and weeding the area; supplying water is also important, especially during the dry season, among others. Most of the beekeepers use medicine such as apistan to combat diseases such as varroasis, caused by mites of the genus Varroa.
Investment and variable costs
Bee honey production requires fixed capital investments. The fixed capital in apicultural production is defined as the set of tools and equipment available in the production unit which are used for the production of honey, along with the total number of hives that make up the productive module.
The total investment for work equipment (veils, gloves, smokers, bee suit and boots) is practically the same at all levels, despite the difference in the number of hives. Nevertheless, there is variation in the extraction equipment based on the number of racks. Another important factor which explains the difference in investment is the quality of the equipment. For example, a four-rack stainless-steel extractor is worth almost four times more than one made of galvanized steel.
Table 1 Investment made by level according to the area of interest
| Level | Average No. of hives (u) | Investment in hives ($) | Protection equipment ($) | Total Investment ($) |
|---|---|---|---|---|
| Small | 85 | 46,883.00 | 1,591.56 | 48,474.56 |
| Medium | 129 | 71,060.13 | 1,728.75 | 72,788.88 |
| Large | 182 | 98,501.39 | 2,181.33 | 100,682.73 |
Source: Based on field data, 2016
Production costs are classified as fixed and variable costs. Fixed costs are: extraction room, vehicles, electric bills, land rent, and equipment depreciation. Variable costs are: food, medicine, hive up keep (rack repairs, supers, brood chamber, floors and covers), labor, gasoline, and vehicle maintenance.
The percentage structure of the fixed and variable production costs of bee honey is mainly composed of the variable cost, with the relative share representing 75.6 %, 78.3 % and 79.8 % of the small, medium, and large levels, respectively. Fixed costs represent 24.4, 21.7 and 20.2 % in the small, medium and large levels, respectively.
At the large level, the variable cost is greater than in the others due to the size of the production unit. In order to further analyze the fixed and variable production costs in the study, they were itemized into their components as can be seen in Table 2.
Table 2 Structure of production costs in apiculture activity by level ($).
| Item | Small | % | Medium | % | Large | % |
|---|---|---|---|---|---|---|
| Sugar | 2,775.8 | 4.5 | 4,088.0 | 4.9 | 5,650.0 | 5.4 |
| Medicine | 1,273.1 | 2.1 | 1,935.5 | 2.3 | 2,726.4 | 2.6 |
| Wax | 600.0 | 1.0 | 450.0 | 0.5 | 300.0 | 0.3 |
| Fuel | 1,633.8 | 2.7 | 1,045.6 | 1.3 | 1,730.9 | 1.7 |
| Subtotal | 6,282.7 | 10.2 | 7,519.1 | 9.1 | 10,407.3 | 10.0 |
| Hive upkeep | 1,164.4 | 1.9 | 1,723.8 | 2.1 | 2,253.0 | 2.2 |
| Subtotal | 1,164.4 | 1.9 | 1,723.8 | 2.1 | 2,253.0 | 2.2 |
| Labor | 5,278.1 | 5,555.6 | 6,502.1 | |||
| Harvest | 10,934.1 | 17.8 | 15,635.3 | 18.8 | 16,143.9 | 15.5 |
| Subtotal | 16,212.2 | 26.4 | 21,190.9 | 25.5 | 22,646.1 | 21.7 |
| Cost of queens | 22,746.5 | 37.1 | 34,505.4 | 41.6 | 47,885.7 | 45.9 |
| Subtotal | 22,746.5 | 37.1 | 34,505.4 | 41.6 | 47,885.7 | 45.9 |
| Total, variable costs | 46,405.8 | 75.6 | 64,939.1 | 78.3 | 83,192.1 | 79.8 |
| Fixed costs | ||||||
| Fixed operation costs (electricity) | t 600.0 | 1.0 | 800.0 | 1.0 | 1,400.0 | 1.3 |
| Depreciation of fixed assets | 14,376.6 | 23.4 | 17,212.0 | 20.7 | 19,700.3 | 18.9 |
| Total, fixed costs | 14,976.6 | 24.4 | 18,012.0 | 21.7 | 21,100.3 | 20.2 |
| Total production cost | 61,382.4 | 100.0 | 82,951.2 | 100.0 | 104,292.3 | 100.0 |
Source: Based on field data, 2016.
The structure of the itemized production costs of bee honey in the north of the state of Campeche shows that the greatest production costs are labor (37.1 %), fixed capital (24.4 %), food and medicine (10.2 %) and maintenance (1.9 %).
On the other hand, the extent of the fixed costs to produce honey with regards to the total production represents an average of 24.4 %, 21.7 %, and 20.2 % for the small, medium, and large producer, respectively. It can be seen that at the small level, with a stainless-steel food grade extractor, the fixed costs are raised in relation to the total costs. Within the three main fixed-cost outlays, the most important was the depreciation value of the equipment and the de preciation value of the transport vehicles of the production unit.
Income
The income table shows that the yield obtained by the producers is directly related to the size of the production unit, hence, the larger the size, the greater yield obtained. In the same manner, the production volume and income are directly related to the size of the production unit.
Break-even point
The break-even point of a company or business refers to the amount of production sold where the total income is equal to the total cost. In other words, the utility is zero. The break-even point indicates the magnitude of production that must be sold to avoid a loss.
At the small level, the annual break-even point is reached with a total production of 1,607.4 kilos of honey, the equivalent of $61,382.40. This production is possible with 48.4 hives. The average number of hives at this level is 84.88 hives. The apicultural activity is profitable at this level.
At the medium level, the break-even point is reached with a production of 2,168.7 kilos, the equivalent of $82,951.2. The production level is obtained with 64 hives. The average number of hives at Level II is 129 hives. The apicultural activity is profitable.
At the large level, the break-even point is reached with a production of 2,744.5 kilos, with an income of $104,292.3. This production level is reached with 79.6 hives. The average number of hives at this level is 181, which clearly reflects that the producers at this level are very profitable because economies of scale apply.
It was observed that at the three levels the break-even point varied according to the installed capacity and, therefore, production and sales volumes change, variable costs are modified proportionately according to production, and, as a result, total production costs also change.
Fixed costs also vary according to installed capacity. They do not have an influence on the variations in production volume, so measures must be taken to lower them in order to reach the break-even point more quickly. In order for producers to reach the production level at which the sales benefits are exactly equal to the sum of the fixed costs and variables, it is nec essary to work at a set minimum capacity of the fixed factors (extractors, vehicles, extraction room, wages). Therefore, the greater the proportion of installed capacity used, the greater the profitability.
Profitability indicators
Apiculturists are competitive with the productivity of the hives, with the present technological level. The cost-benefit ratio in apiculture indicates that for every peso invested (variable and fixed costs), a profit of 71 cents is obtained at the small level, $1.01 pesos at the medium level and $1.28 pesos at the large level. This indicator shows that apiculture in the study region is profitable since for every peso invested in the activity the amount invested is recouped and a surplus is obtained. The profit rate, which is positive in all three levels, reflects the surplus generated by each peso invested.
Conclusions
Bee honey producers in the north of the state of Campeche are ejidatarios, advanced in age, have a low level of education, and nearly 80 % are organized, which may permit them to take advantage of economies of scale when acquiring goods and equipment.
Variable costs grow as the number of hives per producer increase, proportionately increasing the total amount produced and production costs. Managing economies of scale is important for increasing producer competitiveness since it reduces costs and thereby increases the profitability of each production unit.
Bee honey production in the north of the state of Campeche is profitable and competitive. As the size of the production unit grows, profitability increases, which can be explained by the use of economies of scale.
Producers should take advantage of belonging to an organization to buy inputs, such as sugar, in large amounts in order to lower production costs. Likewise, they can obtain beekeeping equipment that allows them to reduce costs and improve profit levels.
REFERENCIAS
FAOSTAT. (2017). Cultivos y productos de ganadería. Base de datos estadísticos de la FAO. En línea, obtenido de http://www.fao.org/faostat/en/#home [ Links ]
Gould, J. P., & Edward P. L. (1994). Teoría microeconómica. México: Fondo de Cultura Económica. [ Links ]
Gupta, R. K. (2014). Taxonomy and Distribution of Different Honeybee Species. En Bee- keeping for Poverty Alleviation and Livelihood Security. Vol. 1: Technological Aspects of Beekeeping. Eds. Gupta, R. K., Reybroeck, W., Van Veen, J. W. Gupta, A. Netherlands: Springer. [ Links ]
Ibáñez C., & Caro T., J. (2001). Algunas teorías e instrumentos para el análisis de la competitividad. San José, Costa Rica: IICA. [ Links ]
Ley Agraria. (1992). Nueva Ley publicada en el Di- ario Oficial de la Federación el 26 de febrero de 1992. Últimas reformas publicadas DOF 27-03-2017. LXIII Legislatura. H. Congreso de la Unión-Cámara de Diputados. En línea, obtenido de http://www.diputados.gob.mx/LeyesBiblio/ref/lagra.htm [ Links ]
Mendenhall, W., Beaver, R. J., & Beaver, B. M. (2010). Introducción a la probabilidad y estadística. 13Ed. México: Cengage Learning Editores S.A. de C.V. [ Links ]
Moritz, A. (1991). Manual del apicultor aficionado. México: Ediciones Roca, S. A. [ Links ]
Oficina de Estudios y Políticas Agrarias (ODEPA). (2014). Miel chilena: consolidación y nuevos mercados. Chile: Gobierno de Chile. [ Links ]
SEMARNATCAM. (2013). Campeche es uno de los principales productores de miel. México: SEMARNAT-Gobierno del estado de Campeche. En línea, obtenido de http://www.semarnatcam.campeche.gob.mx/campeche-es-uno-de-los-principales-productores-de-miel/. [ Links ]
Sistema de Información Agroalimentaria de Consulta (SIACON). (2017). Módulo agrícola del SIACON. México: SIAP-SAGARPA. [ Links ]
United States Department of Agriculture (USDA). (2017). Data & Analysis. Foreign Agricultural Service. En línea, obtenido de <https://www.fas.usda.gov/> [ Links ]
Villanueva G., R., & Colli U., W. (1996). La apicultura en la península de Yucatán, México y sus perspectivas. México: Apitec. [ Links ]
Received: November 27, 2017; Accepted: June 15, 2018
 Este es un artículo publicado en acceso abierto bajo una licencia Creative Commons
