


 nueva página del texto (beta)
 Inglés (pdf)
 Artículo en XML
 Referencias del artículo
 Enviar artículo por email
 Citado por SciELO
  Similares en
SciELO
Similares en
SciELO 
 Permalink
Introduction
The actions against the COVID-19 pandemic have implied worldwide social isolation due to government regulations to reduce its harmful impact (Rodríguez-Leyva & Pierce, 2021). These actions have elicited new habits in the food intake. The COVID-19 pandemic has had profound implications for food security and nutrition. We have witnessed not only a major disruption to food supply chains in the wake of lockdowns triggered by the global health crisis, but also a major global economic slowdown. For businesses, these crises have resulted in lower incomes and higher prices of some foods, putting food out of reach for many (CFS, 2020). Most health analysts predict that this virus will continue to circulate for a least one or two more years (Scudellari, 2020). The COVID-19 pandemic and the measures to contain its spread have had profound implications for food security, nutrition, and food systems. At the same time, malnutrition (including obesity) increases vulnerability to COVID-19 (CFS, 2020; WFP, 2020). The consequences overlap with other chronic diseases considered non-communicable diseases (NCD) (including Type 2 Diabetes, Cardiovascular Disease (CVD), stroke, and several cancers, amongst others). Hence, recognizing and focusing on malnutrition and preventing diet-related NCDs are extremely important in completely ready from chronic diseases to COVID-19 and future health threats (WFP, 2020).
In this sense, it is necessary to undertake studies about how consumers perceive good nutrition based on food innovation technology (FINT). However, it is anticipated that not all consumers are willing to adopt the food innovation technology for such purposes (Vanhonacker et al., 2013); thereby, it will exist food technology neophobia (FTNS) among the consumers (Cox & Evans, 2008). The need for consumer involvement in innovation processes has been recognized since the finals of the twentieth century. Consumer involvement as a part of innovation is an important strategy in the food sector, specifically for enhancing consumer acceptance and promoting successful market introduction (Busse & Siebert, 2018). Therefore, the research value and originality are based on the analysis throughout the relationship of two acknowledged scales: the FINT (Vanhonacker et al., 2013) and the FTNS (Cox & Evans, 2008) to define factors, variables, and indicators considered determinants in a framework capable of analyzing the elements that boost or inhibit such a relationship.
The importance of a good nutrition and dietary
As GBD (2017) report establishes, the second most crucial risk factor that determines mortality and disability-adjusted-life-years in the world are dietary habits. Hence, any disruption in nutrition, will have a significant immediate and long-term impact on health (Rodríguez-Leyva & Pierce, 2021). Sustainable and healthy diets are necessary for global development goals, but people struggle to modify their eating behaviors, which are often habitual and resistant to change; however, disruptions (like COVID-19 pandemic) can provide the impetus for change (Jaeger et al., 2021).
A revealing example: The nutrition and the pandemics
Our history (since the beginnings of century XX) with global pandemics would strongly suggest that nutritional status would have important implications for population health even decades after the current COVID-19 viral pandemic has been controlled (Rodríguez-Leyva & Pierce, 2021). For instance, the 1918 flu pandemic had significant effects on markers of nutritional status assessed in individuals 75 years and older after being exposed to the virus in utero, during infancy and early childhood. Using knee height as a marker of nutritional status, a significant depression in growth was found which was exaggerated by increasing severity of the flu symptoms. Women were more affected than men (Palloni et al., 2020). This marker of nutritional status may associate with the incidence of disease. Prenatal exposure to the 1918 flu virus was associated with an increased incidence (>20%) of ischemic heart disease much later in the century in people aged 60 to 82 years old. This time, men were more strongly affected than women (Mazumbder et al., 2009). The 1918 influenza pandemic is not isolated when considering the impact of nutritional status on disease outbreaks. More recent pandemics, including those from H1N1, influenza, Swine flu, and the Ebola and Nipah viruses, have been impacted by questionable food security practices, including distribution and food availability concerns (Aiyar & Pingali, 2020). Therefore, with these antecedents, it is pertinent to consider if the current COVID-19 pandemic virus has similarly affected today, with altered dietary habits (e.g., overweight, obesity), or if nutritional alterations may affect COVID-19 transmission, morbidity, or mortality being helpful questions to pose.
Consequences of malnutrition
One consequence of unhealthy nutrition is the obesity and overweight defined by the World Health Organization report (WHO, 2021), as abnormal or excessive fat accumulation that may impair health. The body mass index (BMI) is a simple index of weight-for-height used to classify adult overweight and obesity. It is defined as a person's weight (kg) divided by the square of height (kg/ m 2 ). Besides, overweight is a BMI >= 25 and obesity is a BMI>= 30. Worldwide obesity has nearly tripled since 1975. Elevated BMI is the main risk factor for NCD disease. It is common to find the coexistence of malnutrition and obesity in the same country in the same community, and in the same household. Simultaneously, people are exposed to high salt, micronutrient-poor foods, high-fat, energy-dense, high-sugar, and often lower in cost and lower in nutritional quality. These dietary patterns combined with lower levels of physical activity have led to a sharp increase in childhood obesity, while the problem of undernutrition remains unresolved. Despite all, however, overweight and obesity are preventable due to the energy imbalance between calories consumed and calories expended that are susceptible to control. Regarding COVID-19 pandemic compounds malnutrition in all its forms by making healthy diets less affordable and accessible (WFP, 2020). Overweight and obesity have emerged as a major problem in Mexico after a trade deal with the United States and Canada in 1994 made cheap, unhealthy food easily available, substituting their traditional diet (WHO, 2021). It is widely shown in the literature that malnutrition, overweight, obesity will harm the immune system and lead to viral infections, and multiple studies have shown that nutritional interventions can be used as immune stimulants to help prevent viral infections (Moscatelli et al., 2021). There are many articles describing the beneficial effects of a healthy diet in the reduction of obesity, overweight and hence, COVID-19 incidence in long-term consequences (Butler & Barrientos, 2020).
Nutrition and business: How to engage them?
Nutrition as a strategy against the main chronic diseases (e.g., obesity, overweight, diabetes, etc.) reduces of the harmful effects of other more complex like Cancer or COVID-19 and especially attractive hypotheses when vaccines are not available (Rodríguez-Leyva & Pierce, 2021). The food industry has created foods for special therapeutic uses that can be live-saving (UNS, 2011) and it represents a great potential in the developing of functional foods, or nutraceutical extracts from foods, for instance, to alleviate the chronic diseases, morbidity, and mortality (Rodríguez-Leyva & Pierce, 2021). Currently, for instance, the COVID-19 pandemic has forced many governments across the world to re-evaluate their nutrition policy priorities and approaches (Vlad, 2021). The prevalence of malnutrition is around 42% in patients hospitalized with COVID-19 (Bedock, et al., 2020). In Mexico, 67% of the total people who died from COVID-19 in Mexico had diabetes, hypertension, or obesity (López-Perez, 2020).
Nutrition and business interest are overlapping more and more; businesses increase sustainable products and policies of social innovation into their corporate rules and business models (UNS, 2011). Businesses in “low- and middle-income” countries collectively lose between $130 billion and $850 billion a year through malnutrition-related productivity reductions, equivalent to between 0.4% and 2.9% of those economies’ combined GDP (Gross Domestic Product) (Wellesley et al., 2020). In the case of the food industry, it can play a big role in helping increase healthy diets by reducing the salt, fat, and sugar content of processed foods (WHO, 2021). Businesses have a vital role in improving nutrition, both in the workforce and in the community. Effective action could reduce global deaths from malnutrition and greatly enhance economic productivity (Wellesley et al., 2020). This means making sure that healthy and nutritious choices are affordable to all consumers.
Restricting marketing of foods high in salts, sugars, and fats, especially those aimed at younger people (children and teenagers); securing the availability of healthy food choices, and supporting regular physical activity practice in the workplace (WHO, 2021). However, there are still cases of actual or perceived conflicts of interest among firms, governments, and consumers that undermine such convergence and diminish trust, jeopardizing potentially fruitful initiatives (UNS, 2011). Research is needed, but a formulation of new food products in alignment with the Dietary Guidelines of the countries could reduce population-wide calorie consumption (Jensen & Sommer, 2017) and, therefore, strengthen the immune system against any disease through the food healthy intake. Previous research has looked at the impacts of poor nutrition on health systems or society, but the effects on businesses have gone largely unexplored; in fact, “companies do not understand the problem well” (Wellesley et al., 2020).
There is a clear chance for businesses to take further-reaching action to tackle malnutrition as a solution to a problem that claims millions of lives a year to reach, the expertise and the resources to advance global efforts to overcome malnutrition, with incomes (Wellesley, 2020; WHO, 2021). To start the first steps, it is important to explore the level of acceptance of food innovation technology (FINT) and the food technology neophobia scale (FTNS) amongst the consumers.
Designing the framework
The proposed framework is based on two constructs, as follows:
a. Food innovation technology (FINT)
Due to the opening of foreign markets, the increasing importance of large retailers, and the challenge of complying with government regulations, manufacturers in the food industry face increasing pressure for product innovation (Guiné et al., 2020). Innovation puts many traditional foods and traditional processing techniques still available today at risk. Therefore, the food industry must weigh different innovations to improve its products' safety, health, and convenience, instead of retaining the traditional characteristics of its products. (Galanakis, 2019).
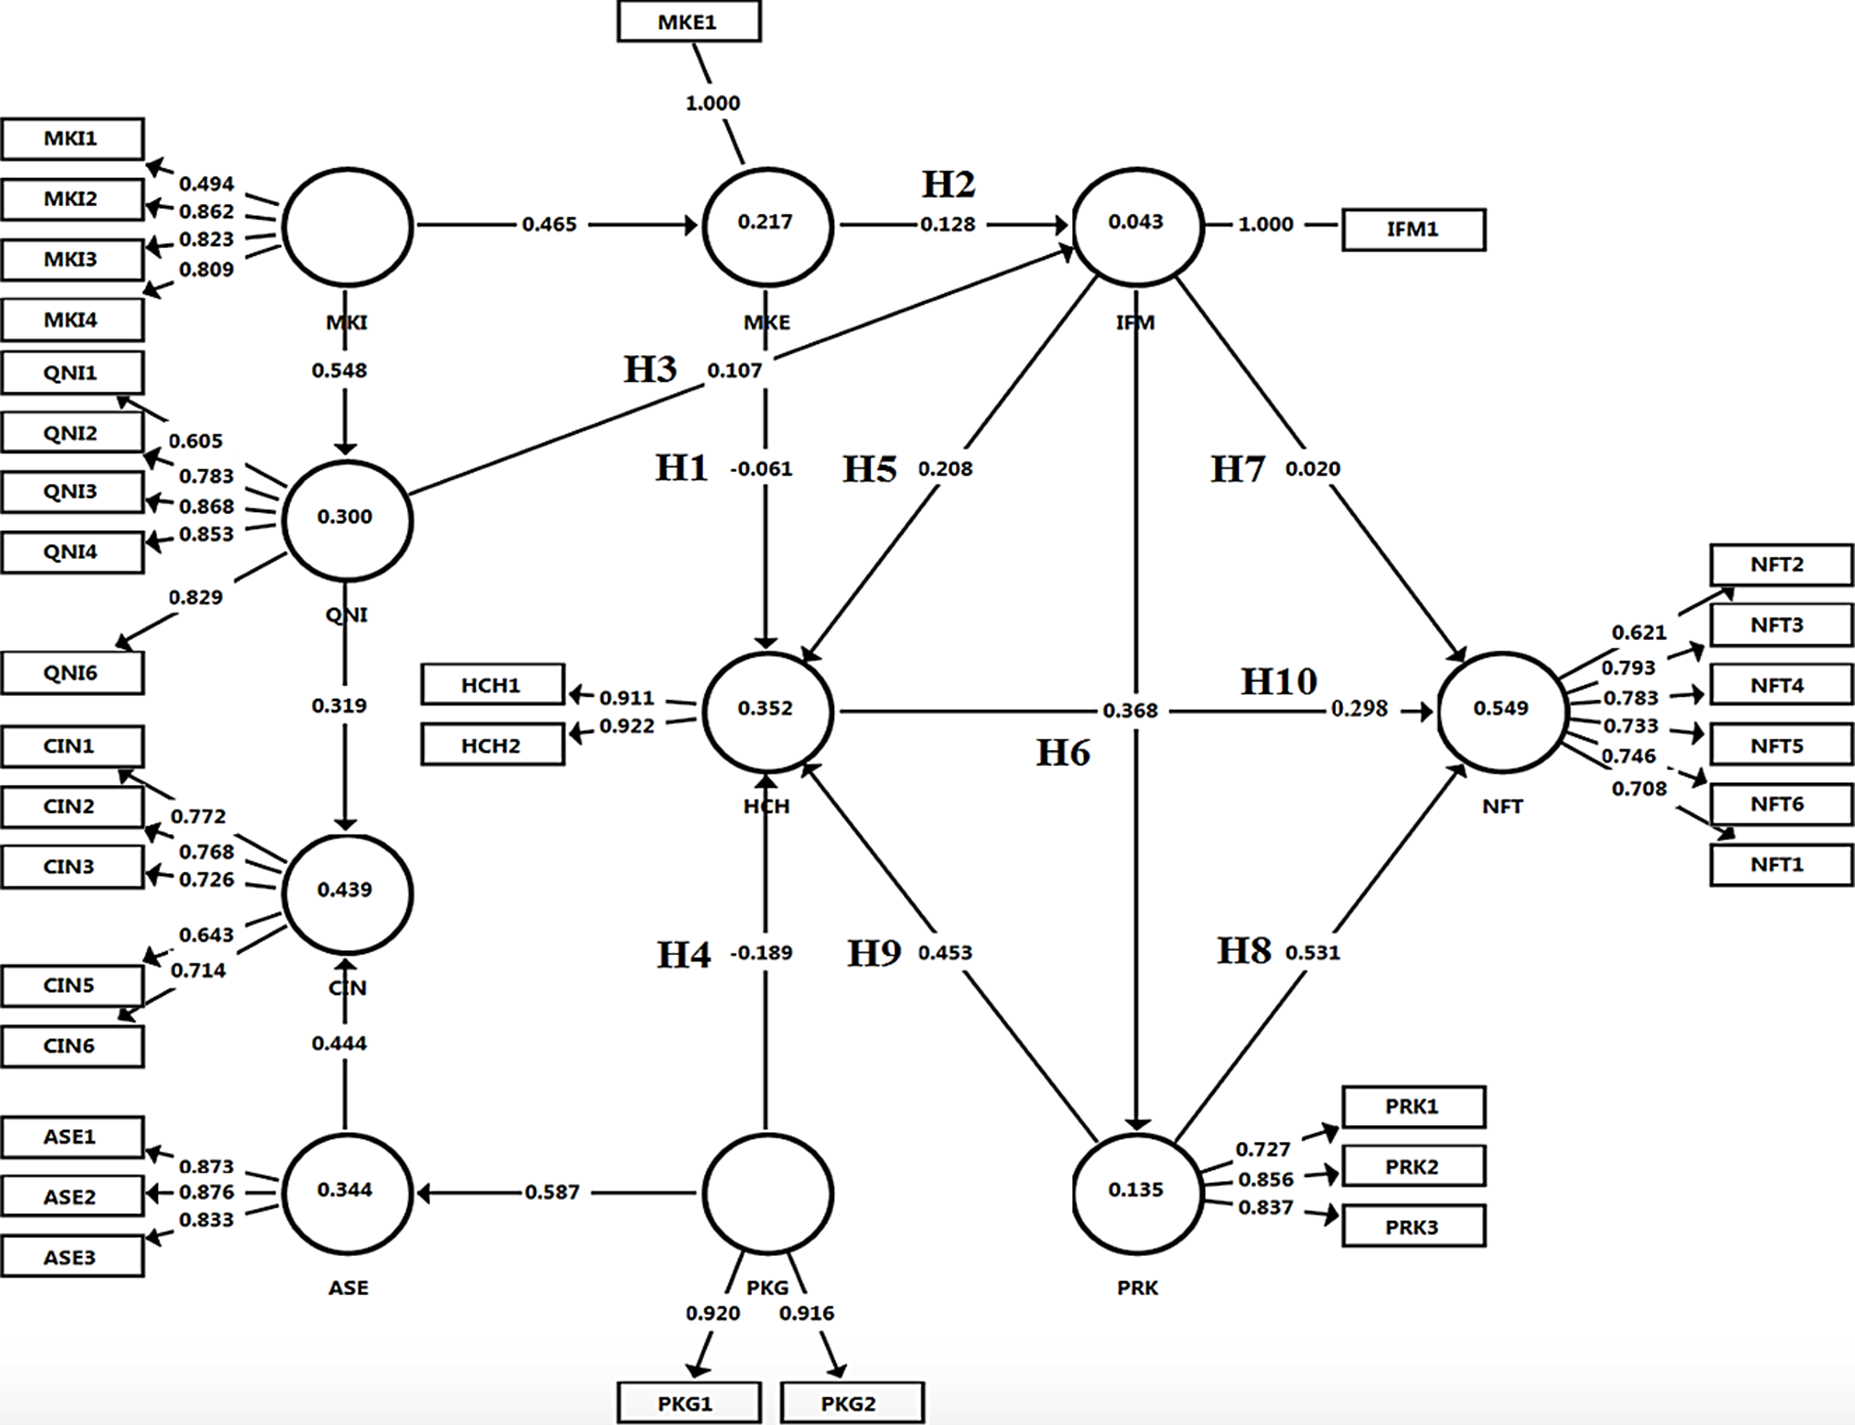
Several studies have attempted to categorize different innovations used in traditional foods. Regarding the types of innovation, Gellynck & Kühne (2008) distinguished four types in the food industry. a. Product innovation (e.g., changes in product composition, new product size or form, package innovation), b. Process innovation (e.g., new solutions to improve quality assurance and traceability), c. Market innovation (e.g., use of new distribution channels), and d. Organizational innovation (e.g., collaboration among food chain network members and joint product development). However, the food producers mainly have focused more on product innovations than the other innovations. Besides, researchers have noticed that there is hardly any trade of information between food makers and their consumers (e.g., retail or wholesale) regarding to consumer requirements (Galanakis, 2019). Therefore, based on previous work of Guerrero (et al., 2009) about European consumers and the European food associations in six countries, Vanhonacker et al. (2013) provided a food innovation technology (FINT) framework consisting of 6 variables/23 indicators: assortment expansion (ASE) with 3 indicators; convenience innovation (CIN) with 6 indicators; marketing efforts (MKE) with 2 indicators; market innovations (MKI) with 4 indicators; packaging innovation (PKG) with 2 indicators and finally, quality and/or nutritional innovation (QNI) with 6 indicators. Consumer’s attitude can be the main factor for holding back food innovations based on technology (FNV, 2018). Hence, is crucial to analyze the kind of impact changes in the food innovations on the consumer acceptance for the industry. See Figure 1 and Table 3.

Source: Cox & Evans (2008) and Vanhonacker (et al., 2013) with own adaptation
Notes: FINT. Food Innovation Technology; ASE assortment expansion; CIN. Convenience Innovation; MKE. Marketing Efforts; MKI. Market Innovations; PKG. Packaging Innovation; QNI. Quality And/Or Nutritional Innovation; FTNS. Food Technology Neophobia Scale; HCH. Healthy Choice; IFM. Information Media; NFT. New Food Technologies are Unnecessary: PRK. Perception Risk
Figure 1 FINT-FTNS Framework proposal.
b. Food Technology Neophobia Scale (FTNS)
Consumers are undecided about innovative food products. This is because they have an inherent trend to accept them (“neophilia”) and avoid them (“neophobia”) at the same time (Van Trijp & Van Kleef, 2008). Food decisions are affected by a person's mentality towards food sources. Food neophobia might be related to less assortment of diets, insufficient supplement intake, and high product disappointment rate for innovative foods entering the market (Damsbo-Svendsen et al. 2017). It is highlighted that at the time of writing this document, there is a lack of enough studies about neophobia in Mexico. Although extensive investigations have been conducted on food neophobia, a recent study shows that the mechanism behind food rejection is not yet clear; neophobia is an important determinant of food choice and has a great impact on diet quality (Lafraire et al., 2016). Several studies have shown that people with higher levels of food neophobia reduce their intake of vegetables, salads, fruits, meat, and fish (Siegrist et al., 2013). Besides, other studies have shown that people with food neophobia may experience insufficient intake of protein, monounsaturated fat, magnesium, and vitamin E (Capiola & Raudenbush, 2012). Changing dietary patterns through the healthy development of new product strategies and sensory testing will be beneficial initiatives to overcome these challenges; thereby, it is important to select and use the appropriate scale able to measure the food neophobia according to the subject target for instance, child, young or old people, either man or woman, boy or girl, besides the monthly income, education, or the region of the country. In fact, the work of Damsbo-Svendsen (et al., 2017) is a good reference because they gathered and described 13 scales designed since food neophobia scale (FNS) with 10 items (Pliner & Hobden, 1992) until fruit and vegetable neophobia instrument (FVNI) with 18 items (Hollar et all., 2013). As far as we know, there is no review of existing measurement scales about neophobia, and willingness to try unfamiliar food can be found available at present. However, Damsbo-Svendsen (et al., 2017) analysis result points out the FTNS (Cox & Evans, 2008) as the best scale for adults’ collection opinion, with 4 variables/13 indicators, as follows: new food technologies are unnecessary (NFT) with 6 indicators; perception of the risk (PRK) with 4 indicators; healthy choice (HCH) with 2 indicators and finally, information media (IFM) with 1 indicator. According to Damsbo-Svendsen (et al., 2017), FTNS measures neophobia concerning technology assessing consumers’ willingness to eat foods produced with novel technologies because it is highly reliable when is applied (alpha=0.84). Therefore, we next elaborate how regular consumers respond to food innovations technology (FINT) and the level that they have in food technology neophobia scale (FTNS) and unravel the underlying variables and their relationships as basis of consumers nutrition design against overweight, obesity, and COVID-19 for the next normal. See Figure 1 and Table 3.
Hypotheses proposals
After analyzing several reflective models between the 2 constructs (FINT and FTNS), maximizing the corresponding path coefficients, the coefficient of determination (R2), and their size effects (f2), with SmartPLS 3.3.3, we concluded the framework proposal in Figure 1. Hence, we posed 10 hypotheses based on the main paths, that are interrelated as the proposed framework. The framework os based on concepts of business contained in FINT construct, such as marketing efforts (MKE); quality and/or nutritional innovation (QNI); packaging innovation (PKG) and how are related with the FTNS construct with: new food technologies are unnecessary (NFT); perception of the risk (PRK) with 4 indicators; healthy choice (HCH) with 2 indicators and finally, information media (IFM). The results are displayed in Table 1andFigure 1:
Table 1 FINT-FTNS framework hypotheses
| Hypotheses |
|---|
| H1: “MKE contributes positively on HCH” |
| H2: “MKE contributes positively on IFM” |
| H3: “QNI contributes positively on IFM” |
| H4: “PKG contributes positively on HCH” |
| H5: “IFM contributes negatively on HCH” |
| H6: “IFM contributes positively on PRK” |
| H7: “IFM contributes positively on NFT” |
| H8: “PRK contributes positively on NFT” |
| H9: “PRK contributes positively on HCH” |
| H10: “HCH contributes positively on NFT” |
Source: Own with adaptation.
Methodology
It is designed in 4 steps, described as follows in Table 2.
Table 2 Methodology
| Stage | Description |
|---|---|
| 1 | It was based on a literature review to determine two kinds of previous scales broadly recognized to use in this research, FTNS by Cox & Evans (2008) and FINT by Vanhonacker et al. (2018). The framework totalizes 2 factors (FINT-FTNS), 10 variables, and 36 indicators. A questionnaire was designed as a final framework (see Table 3). |
| 2 | The survey data applied to 401 Mexican consumers (Oct-Dic-2021) according to age, gender, marital status, education, monthly income, Mexico’s state (seeTable 1) considered as the next normal times (period after COVID-19 pandemic in Mexico). |
| 3 | We contribute with a solid empirical framework proposal composed by 2 reflective constructs: Cox & Evans (2008) FTNS, and Vanhonacker et al. (2018) FINT. Because we considered that the items are interchangeable, we posed reflective specification since they (hypothetically) represent the construct equally (as against related to the formative constructs, when dropping an indicator may change the meaning of that construct (Hair et al., 2019b). It was used Partial Leased Squares Structural Equation modeling (PLS-SEM) using SmartPLS 3.3.3 software. This PLS-SEM determines the loading factors and tests the framework's reliability with convergent and discriminant validities (see Tables 3 and 7). Here, only one combination of underlying factors, variables, and indicators (items) is obtained according to their factors loading to determine the relationship between FINT and FTNS. |
| 4 | Once proved the factors loaded and tested, the framework's reliability with convergent and discriminant validities. The datasets are analyzed to explain the interrelated variables and factors and assess the framework's (FINT-FTNS) confirmatory and prediction capabilities. |
| 5 | Result analyses, discussion, and conclusions. |
Source: own.
Demographic data
According to the results obtained from the frequency analysis of 401 Mexican consumers (Oct-Dic-2021), the most important data of the participants were 251/ 18-29 years old (63%); 245 female and 156 females (61%/39%), 294 single (73%), 157 postgraduate education (39%), 170 with monthly income less than 9,000 pesos (42%). Participants were invited to answer the questionnaire via e-mail google forms, as "snowball self-report" explaining the scope to encourage them and collect their opinions. Participation was voluntary confidential; no rewards were provided. Therefore, the sample is considered representative of a consumer of food in Mexico.
Sampling
A basic rule of thumb for sample size is 10 times the number of arrows pointing at a construct, whether as a formative indicator to a construct or a structural path to an endogenous construct (Kock & Hadaya, 2018). In our case 36 indicators x 10 times= 360. The 401 Mexican consumers sample (Oct-Dic-2021) fulfill this condition widely
PLS-SEM analysis technique
The PLS structural equation model is composed of the “measurement model” representing the observed data and the underlying variables relationships, and the “structural model” showings the relationships between the underlying variables (Henseler et al., 2012; Hair et al., 2017). The “structural equation” model is solved by an iterative algorithm, which estimate the underlying variables through “measurement model” and “structural model” in alternating steps or partial. The “measurement model” calculates the underlying variables as a weighted sum of its manifest variables. Through simple or multiple linear regression between the underlying variables estimated by the “measurement model” is how the “structural model” computes the underlying variables.
Until convergence is achieved, this algorithm repeats itself. PLS-SEM analyzes, explores, and tests the established and underlying conceptual models and theory being preferable over (covariance-based structural modeling (CB-SEM) when it is unknown whether the data's nature is a common factor or composite-based (Henseler et al., 2012; Hair et al., 2017).
Results
We have two reflective constructs (mode A) (Hair, 2017) into the framework: FINT (Vanhonacker et al., 2013) and FTNS (Cox & Evans, 2008) that are assessed, as follows:
a. The measurement model internal consistency reliability, significance, and variance assessment as convergent validity
They were computed according to SmartPLS 3.3.3 software, with values per variable.
The indicators between 0.40-0.70 as outer loadings are for removal only; such action increases composite reliability and AVE above the suggested threshold value (Hair et al., 2017). Convergent validity is measured AVE, which is the grand mean value of the squared loadings of the indicators associated with the construct (Fornell & Larcker, 1981). Therefore, we had to remove PRK4 (FTNS by Cox & Evans, 2008), QNI5, CIN4, and MKE2 (Vanhonacker et al., 2013) to achieve all the indexes mentioned above. Therefore, the framework fulfills the reliability and convergence validity required. See Table 3.
Table 3 The measurement model internal consistency reliability, significance, and variance assessment as convergent validity
| Factor: FTNS. Food Technology Neophobia Scale (FTNS) by Cox & Evans (2008) | |||
|---|---|---|---|
| Variable: New Food Technologies are Unnecessary (NFT) Cronbach’s alpha (>=0.7): 0.827; Dijkstra-Henseler’s rho (>=0.7): 0.840; CRI(>=0.7): 0.874; AVE(>=0.5): 0.537 | Loading Factors (p-value) (>=0.7) | ||
| No. | Item | Indicators | |
| 1 | NFT1 | There are plenty of tasty foods around, so we do not need to use new food technologies to produce more. | 0.706 (0.000) |
| 2 | NFT2 | The benefits of new food technologies are often grossly overstated. | 0.619 (0.000) |
| 3 | NFT3 | New food technologies decrease the natural quality of food. | 0.794 (0.000) |
| 4 | NFT4 | There is no sense trying out high-tech food products because the ones I eat are already good enough. | 0.782 (0.000) |
| 5 | NFT5 | New foods are not healthier than traditional foods. | 0.734 (0.000) |
| 6 | NFT6 | New food technologies are something I am uncertain about. | 0.746 (0.000) |
|
Variable: Perception Risk (PRK) Cronbach’s alpha (>=0.7): 0.734; Dijkstra-Henseler’s rho (>=0.7): 0.748; CRI(>=0.7): 0.849; AVE(>=0.5): 0.654 |
Loading Factors (p-value) (>=0.7) | ||
| No. | Item | Indicators | |
| 7 | PRK1 | Society should not depend heavily on technologies to solve its food problems. | 0.726 (0.000) |
| 8 | PRK2 | New food technologies may have long-term adverse environmental effects. | 0.856 (0.000) |
| 9 | PRK3 | It can be risky to switch to new food technologies too quickly. | 0.837 (0.000) |
| 10 | PRK4 | New food technologies are likely to have long-term adverse health effects. | Removed. Problems with Cronbach’s Alpha and AVE |
|
Variable: Healthy Choice (HCH) Cronbach’s alpha (>=0.7): 0.809; Dijkstra-Henseler’s rho (>=0.7): 0.811; CRI(>=0.7): 0.913; AVE(>=0.5): 0.840 |
Loading Factors (p-value) (>=0.7) | ||
| No. | Item | Indicators | |
| 11 | HCH1 | New products produced using new food technologies cannot help people have a balanced diet | 0.910 (0.000) |
| 12 | HCH2 | New food technologies do not give people more control over their food choices. | 0.922 (0.000) |
|
Variable: Information Media (IFM) Cronbach’s alpha (>=0.7): 1.000; Dijkstra-Henseler’s rho(>=0.7): 1.000; CRI(>=0.7): 1.000; AVE(>=0.5): 1.000 |
Loading Factors (p-value) (>=0.7) | ||
| No. | Item | Indicators | |
| 13 | IFM1 | The media usually do not provide a balanced and unbiased view of new food technologies. | 1.000 (0.000) |
| Food Innovation Technology (FINT) Factor by Vanhonacker (et al., 2013) | Loading Factors (p-value) (>=0.7) | ||
|
Variable: Quality and / or Nutritional Innovation (QNI) Cronbach’s alpha (>=0.7): 0.850; Dijkstra-Henseler’s rho (>=0.7): 0.872 ; CRI (>=0.7): 0.893; AVE(>=0.5): 0.630 | |||
| No. | Item | Indicators | |
| 14 | QNI1 | Using organic raw materials | 0.604 (0.000) |
| 15 | QNI2 | New process improving safety | 0.782 (0.000) |
| 16 | QNI3 | Reduction of the fat content | 0.868 (0.000) |
| 17 | QNI4 | Reduction of sugar content | 0.853 (0.000) |
| 18 | QNI5 | Reduction of salt content | Removed. Problems with collinearity |
| 19 | QNI6 | Addition of ingredients providing additional health benefits | 0.828 (0.000) |
|
Variable: Convenience Innovation (CIN) Cronbach’s alpha (>=0.7): 0.781; Dijkstra-Henseler’s rho (>=0.7): 0.799; CRI(>=0.7): 0.847; AVE(>=0.5): 0.527 |
Loading Factors (p-value) (>=0.7) | ||
| No. | Item | Indicators | |
| 20 | CIN1 | Individual portions | 0.771 (0.000) |
| 21 | CIN2 | Availability all over the year | 0.769 (0.000) |
| 22 | CIN3 | Packaging that can be used in oven or microwave | 0.725 (0.000) |
| 23 | CIN4 | Frozen food | Removed. Problems with AVE |
| 24 | CIN5 | Pre-cooked food, ready-to-eat dishes | 0.640 (0.000) |
| 25 | CIN6 | Package deal (traditional food products sold together with e.g. accompanying, spices, wine, sauces) | 0.714 (0.000) |
|
Variable: Market Efforts (MKE) Cronbach’s alpha (>=0.7): 1.000; Dijkstra-Henseler’s (>=0.7): 1.000; CRI(>=0.7): 1.000; AVE(>=0.5): 1.000 |
Loading Factors (p-value) (>=0.7) | ||
| No. | Item | Indicators | |
| 26 | MKE1 | Label that guarantees the origin of the raw material and the authentic recipe | 1.000 (0.000) |
| 27 | MKE2 | Introduction on the market under a strong brand name | Removed. Problems with Cronbach’s Alpha and rho. |
|
Variable: Assortment Expansion (ASE) Cronbach’s alpha (>=0.7): 0.825; Dijkstra-Henseler’s rho (>=0.7): 0.831; CRI(>=0.7): 0.895; AVE(>=0.5): 0.740 |
Loading Factors (p-value) (>=0.7) | ||
| No. | Item | Indicators | |
| 28 | ASE1 | More variety in the offer for a type of food | 0.873 (0.000) |
| 29 | ASE2 | New combinations of ingredients to create new flavor | 0.875 (0.000) |
| 30 | ASE3 | Diversification of shapes and/or texture | 0.832 (0.000) |
|
Variable: Market Innovations (MKI) Cronbach’s alpha (>=0.7): 0.751; Dijkstra-Henseler’s rho(>=0.7): 0.812; CRI(>=0.7): 0.842; AVE(>=0.5): 0.580 |
Loading Factors (p-value) (>=0.7) | ||
| No. | Item | Indicators | |
| 31 | MKI1 | Can be bought in vending machines | 0.491 (0.000) |
| 32 | MKI2 | Can be obtained via home delivery | 0.862 (0.000) |
| 33 | MKI3 | Can be bought for take-away from the specialty shop | 0.821 (0.000) |
| 34 | MKI4 | Can be bought directly from the manufacturer | 0.809 (0.000) |
|
Variable: Packaging Innovation (PKG) Cronbach’s alpha (>=0.7): 0.814; Dijkstra-Henseler’s rho (>=0.7): 0.814; CRI(>=0.7): 0.915; AVE(>=0.5): 0.843 |
Loading Factors (p-value) (>=0.7) | ||
| No. | Item | Indicators | |
| 35 | PKG1 | Packaging better preserving sensory quality (color, flavor…) | 0.920 (0.000) |
| 36 | PKG2 | Reclosable packaging | 0.916 (0.000) |
Source: Cox & Evans (2008) and Vanhonacker (et al., 2013) under own adaptation and using SmartPLS 3.3.3. Software
Notes:
• CRI. Composite Reliability Index. Values 0-1.; rho_A. Values between 0.6-0.7 are acceptable in exploratory research, 0.7-0.9 reflect satisfactory to good results (Dijkstra-Hanseler, 2015). Values >0.95 suggest that the indicators could be measuring the same phenomenon and they are semantically redundant (Hair et al., 2019; Drolet & Morrison, 2001) with a potential common bias; this is, the variation is from the instrument not by respondents (Straub et al., 2004); AVE. Average Variance Extracted Index. >0.5 suggests that more than 50% of the construct represents the items variance (Fornell & Larcker, 1981), Indicators are according to Likert Scale 1-7 (1. Strongly disagree; 2. Disagree; 3. Somewhat disagree; 4. Neither agree nor disagree; 5. Somewhat agree; 6. Agree; 7. Strongly agree). This type of scale provides a balance between the respondents' complexity and the ease of analysis of the information (Hair et al., 2019).
b. The measurement model discriminant validity
It was computed with SmartPLS 3.3.3 software. It points to if an underlying variable is measuring a different construct and the degree to which indicators show an example of the target construct. It was calculated according to the traditional discriminant validity assessment method, which requires all relationships between constructs to be less than the lowest of the AVE’s square root values. (Fornell & Larcker, 1981). See Table 4.
Table 4 Measurement model discriminant validity, HTMT
| Fornell-Larcker Criteria (Diagonal= Root Square (AVE)) | ||||||||||
|---|---|---|---|---|---|---|---|---|---|---|
| [1] | [2] | [3] | [4] | [5] | [6] | [7] | [8] | [9] | [10] | |
| [1] ASE | 0.86 | 0 | 0 | 0 | 0 | 0 | 0 | 0 | 0 | 0 |
| [2] CIN | 0.601 | 0.726 | 0 | 0 | 0 | 0 | 0 | 0 | 0 | 0 |
| [3] HCH | -0.137 | -0.109 | 0.916 | 0 | 0 | 0 | 0 | 0 | 0 | 0 |
| [4] IFM | 0.105 | 0.069 | 0.336 | 1.000 | 0 | 0 | 0 | 0 | 0 | 0 |
| [5] MKE | 0.443 | 0.41 | -0.063 | 0.186 | 1.000 | 0 | 0 | 0 | 0 | 0 |
| [6] MKI | 0.65 | 0.613 | -0.13 | 0.147 | 0.465 | 0.762 | 0 | 0 | 0 | 0 |
| [7] NFT | -0.002 | -0.034 | 0.584 | 0.315 | 0.045 | 0.004 | 0.733 | 0 | 0 | 0 |
| [8] PKG | 0.587 | 0.565 | -0.207 | 0.144 | 0.544 | 0.657 | -0.093 | 0.918 | 0 | 0 |
| [9] PRK | 0.062 | -0.006 | 0.528 | 0.368 | 0.137 | 0.056 | 0.695 | -0.032 | 0.809 | 0 |
| [10] QNI | 0.493 | 0.538 | -0.133 | 0.177 | 0.543 | 0.548 | 0.019 | 0.592 | 0.025 | 0.794 |
| HTMT Ratio<= 0.85<=0.90 | ||||||||||
| [1] | [2] | [3] | [4] | [5] | [6] | [7] | [8] | [9] | [10] | |
| [1] ASE | 0 | 0 | 0 | 0 | 0 | 0 | 0 | 0 | 0 | 0 |
| [2] CIN | 0.729 | 0 | 0 | 0 | 0 | 0 | 0 | 0 | 0 | 0 |
| [3] HCH | 0.166 | 0.135 | 0 | 0 | 0 | 0 | 0 | 0 | 0 | 0 |
| [4] IFM | 0.112 | 0.137 | 0.372 | 0 | 0 | 0 | 0 | 0 | 0 | 0 |
| [5] MKE | 0.481 | 0.445 | 0.071 | 0.186 | 0 | 0 | 0 | 0 | 0 | 0 |
| [6] MKI | 0.828 | 0.78 | 0.154 | 0.156 | 0.513 | 0 | 0 | 0 | 0 | 0 |
| [7] NFT | 0.084 | 0.108 | 0.707 | 0.348 | 0.067 | 0.074 | 0 | 0 | 0 | 0 |
| [8] PKG | 0.713 | 0.684 | 0.256 | 0.16 | 0.604 | 0.801 | 0.126 | 0 | 0 | 0 |
| [9] PRK | 0.082 | 0.097 | 0.682 | 0.425 | 0.158 | 0.091 | 0.873 | 0.069 | 0 | 0 |
| [10] QNI | 0.566 | 0.597 | 0.175 | 0.196 | 0.597 | 0.656 | 0.114 | 0.7 | 0.106 | 0 |
Source: Own using SmartPLS 3.3.3 software
Notes:
HTMT. It ensures that different constructs capture different concepts. The cut-off value is 0.90 if the constructs are conceptually similar); a more conservative cut-off value is 0.85 (Henseler, et al., 2015). Bootstrapping ensures that HTMT results are statistically significantly different from 1.0 because cut-off values have a high likelihood of falsely rejecting discriminant validity and are very conservative (i.e., Type II error) (Franke & Sarstedt, 2019)
It includes the heterotrait-monotrait (HTMT) criterion of the relationship to evaluate discriminant validity. An estimate of what the true correlation between two constructs would be if they were perfectly measured is represented through the HTMT approach is (i.e., when they are perfectly reliable HTMT<=0.85<=0.90) (Henseler, et al., 2015; Hair et al., 2017). Hence, the framework fulfills the discriminant validity. The structural model assessment evaluates a series of regression equations that represent the relationships of the constructs that, in essence, they must not represent similar concepts (Hair et al., 2019b). For assessing collinearity, the Variance Inflation Factor (VIF) is used with all the values <=3.0. The researcher could consider using a second-order construct if collinearity remains an issue (Sarstedt et al., 2020).
c. The significance of the structural model relationships
Path coefficients are the hypothesized relationship among the constructs. They are ranged in standardized values between −1 and 1 (strongly negative or strongly positive). Values close to 0 are weak relationships. The p-values and the f2effect sizes dictate the significance of path coefficients used on bootstrapping. It produces a sample distribution approaching the normal distribution; the result is used to establish critical t-values (Hair et al., 2017b), and subsequently the p-values to discuss the clinical or practical significance (Kraemer et al., 2003). Besides, to modify research conclusions, practical significance involves the magnitude of the observed effect and if it is enough. Therefore, a statistically significant relationship may not be practically significant. In addition, some path coefficients might be very small effect size but significant; therefore, they are essential to draw appropriate conclusions. There is no consensus, so judgments on the practical significance rely on experts’ considerations about measuring practical significance (Kraemer et al., 2003). In this way, the significance of the structural model relationships is proved according to the hypotheses following Figure 2.
d. Model´s explanatory power
The coefficient of determination explained variance, or R2 value, is an essential critical measure in PLS-SEM because it measures the model’s explanatory power. Each endogenous construct, R2 measures the proportion of variance explained. In our case, the variable ASE with R2 = 0.343 means that 34.3% of ASE variation is explained by all the constructs that point to ASE.
The level of explanatory power is placed according to the results between 0-1. Threshold values are not provided because they depend on the model’s complexity and the subject matter. Thereby, the adjusted R2 criterion is a good practice to consider because it adjusts the R2 value based on the model size (James et al., 2013). A specific exogenous underlying variable can be assessed if it substantially affect the endogenous ones, using the f2 effect size (Cohen, 1988).
It measures if the exogenous construct has a substantial impact on the endogenous one. Thresholds values: <.02 represents no effect; 0.02-0.15 for small effect size; 0.15-0.35 for a medium-sized effect; >0.35 a large effect size was proposed by Cohen (1988). Therefore, the framework fulfills the required conditions (Hair, 2017, Hanseler et al., 2015). See Table 5.
Table 5 Structural Measurement Model and Hypotheses tests
| Hypotheses | Paths | Path (t-value; p-value) | Result Approved Rejected/ | 5%-95% confidence interval | Interval Result (<> 0) | f 2 Effect Size (>=0.02) |
|---|---|---|---|---|---|---|
| H1: “MKE contributes positively on HCH” | MKE→ HCH | -0.062 [1.292;0.098] | Rejected | [-0.139, 0.017] | No | 0.004 |
| H2: “MKE contributes positively on IFM” | MKE→IFM | 0.130 [1.896; 0.029] | Approved | [0.019, 0.244] | Yes | 0.012 |
| H3: “QNI contributes positively on IFM” | QNI→IFM | 0.106 [1.749; 0.040] | Approved | [0.005, 0.206] | Yes | 0.008 |
| H4: “PKG contributes positively on HCH” | PKG→HCH | -0.190 [3.882; 0.139] | Rejected | [-0.270, 0.111] | No | 0.038 |
| H5: “IFM contributes positively on HCH” | IFM→HCH | 0.207 [4.523; 0.000] | Approved | [0.131, 0.281] | Yes | 0.056 |
| H6: “IFM contributes positively on PRK” | IFM→ PRK | 0.368 [7.096;0.001] | Approved | [0.074, 0.206] | Yes | 0.157 |
| H7: “IFM contributes positively on NFT” | IFM→NFT | 0.019 [0.486; 0.313] | Approved | [0.282, 0.454] | Yes | 0.001 |
| H8: “PRK contributes positively on NFT” | PRK→NFT | 0.531 [13.297;0.000] | Approved | [0.464, 0.596] | Yes | 0.425 |
| H9: “PRK contributes positively on HCH” | PRK→HCH | 0.454 [9.674;0.000] | Approved | [0.376, 0.530] | Yes | 0.266 |
| H10: “HCH contributes positively on NFT” | HCH→ NFT | 0.299 [7.197; 0.000] | Approved | [0.230 0.367] | Yes | 0.137 |
| Endogenous variable | Adjusted R2 | |||||
| ASE | 0.343 | |||||
| CIN | 0.436 | |||||
| HCH | 0.345 | |||||
| IFM | 0.038 | |||||
| MKE | 0.215 | |||||
| NFT | 0.546 | |||||
| PRK | 0.133 | |||||
| QNI | 0.298 |
Source: Own using SmartPLS 3.3.3 software.
Notes:
NA. Not Applicable; One-tailed t-values and p-values in parentheses; bootstrapping 95% confidence intervals (based on n= 5000 subsamples); f 2 . Effect size. 0.02, 0.15, and 0.35 are small, medium, and large (Hair et al. 2017); R 2 . Coefficients of determination represent the amount of explained variance of the endogenous constructs in the structural model. Therefore, values of 0.25, 0.50, 0.75 for target constructs are considered weak, medium, and substantial, respectively (Hair et al. 2017); SRMR. The Standardized Root Mean Square Residual is a common fit measure for CB-SEM (Henseler et al., 2015). For misspecification of PLS-SEM, models detection is also used (Henseler et al., 2014).
Discussion
The COVID-19 pandemic has changed the population, some consumption patterns. Several consumers have preferred less fresh, less nutritious, and more economical diets in a crisis.
For the COVID-19 pandemic, the reason for this decision was the significant decline in household income and the government's movement restrictions to prevent the spread of the disease. Poor nutrition produces a higher risk of disease (FAO, 2020). This is an even more severe public health issue in times of the COVID-19 pandemic because of malnutrition due to overweight, obesity, and undernutrition. Such a problem affects the entire world, not only in developed countries but overweight and obesity are now very much on the rise in developing countries, especially in city-based settings.
Almost of overweight or obese children, live in low-middle income countries, where the increase is more than 30% higher than that of high-income countries. Since 2016, 1.9 billion adults worldwide have been overweight, 650 million are obese, 39% of adults aged 18 years were overweight, and 13% were obese (WHO, 2021).
Because of the broad evidence that the COVID-19 pandemic is especially dangerous for overweight and obese people, healthy eating is necessary to minimize the risk of disease (FAO, 2020), and opportunity for the food industry to tackle overweight, obesity, and COVID-19 ravages for the next normal through.
For instance, since the efforts on the reformulating ultra-processed foods (Harastani et al., 2020), on the use of probiotics and prebiotics on food texture (Guimaraes et al., 2020) until Giordano (et al., 2017) describing the benefits of several kinds of technologies. For example, nanotechnology, genetically modified organisms, nutrigenomics, food irradiation, animal cloning, insects' food, and an extensive list of possibilities. However, are the consumers ready to face the food innovations technologies?
a. Theoretical implications
To respond it and based on a literature review, the main contribution of this research is to determine how two of the most recognized scales: the food innovation technology (FINT) by Vanhonacker (et al., 2013) and the food technology neophobia scale (FTNS) by Cox & Evans (2008) are interrelated. Such a relationship is to identify what underlying variables are most relevant in supporting the consumers against overweight, obesity, and COVID-19 for the next normal.
• The measurement model
Based on PLS-SEM with SmartPLS 3.3.3. Software, Table 6 results show the measurement model main indicators.
Table 6 The measurement model explanation
| Main indicators | Explanation |
|---|---|
| PRK4:“ New food technologies are likely to have long term negative health effects” | It is removed due to Cronbach's Alpha and AVE problems to assure the reliability, and convergent values index required. It is predictable that the innovation-related perception, customer perceived value, are all-important variables related to the acceptance of an innovative food product (Albertsen et al., 2020). However, many new foods are expensive and not readily available to all families, especially those living in vulnerable communities (Shelden, 2020). Therefore, it might be necessary to include more indicators that involve the awareness of innovation-related perception, customer perceived value, and price into food innovation technology (FINT) construct to reduce the consumer's perceived risk (PRK). |
| QNI5: "Reduction of salt" | It is removed for high collinearity with QNI4: "Reduction of sugar content" and both, very closed with QNI3 |
| QNI3: "Reduction of the fat content" | This is a consequence of how the consumer perceives the high dependence of such three food ingredients. For instance, one of the reasons that salt has become so pervasive is that it is a cheap preservative that allows the product to last longer, mask sour flavors, and be sold for less money. Sugar helps sell foods because it makes the taste of food and drinks "irresistible" (DMN, 2013). The variable quality and/or nutritional innovation (QNI) needs to be improved by emphasizing their reduction indicators, how to reduce them, and the benefits of such reduction (Moss, 2014). For instance, excessive salt consumption can cause water gain high blood pressure leading to potential heart failure, heart attack, and stroke; too much sugar can cause insulin resistance, obesity, and diabetes. Hence, adding and improving the precision of QNI3, QNI4, and QNI5 indicators into the food technology neophobia scale (FTNS) is suggested. |
| CIN4: "Frozen food" | It is removed by problems with AVE; in other words, this question does not represent more than 50% of the variance that explains it. The question is not as descriptive as convenience innovations (CIN) and needs a complementary context. For instance, according to Crawford (2021): "Natural and organic brands catering to alternative eating styles and combining better nutrition with convenience are shifting consumer perceptions of frozen to boost purchase intent and sales that could outlast the pandemic pantry stocking surge of 2020". Thereby, it is necessary to introduce more context in the variable convenience innovations (CIN) to make it more descriptive, suggesting the intention to buy for the consumer context. |
| MKE2 indicator: "Introduction on the market under a strong brand name” | Problems with Cronbach's Alpha and rho were removed. The indicator MKE1: "Label that guarantees the origin of the raw material and the authentic recipe" was more descriptive than MKE2 and is redundant. Thereby, it is suggested to remain this with a single item (Diamantopoulus et al., 2012) for the variable market efforts (MKE), to further the analysis. |
| IFM1: “The media usually do not provide a balanced and unbiased view of new food technologies.” | Based on Figure 2 and Table 5, all the Adjusted values are set up among 0.133-0.546. The exception is the value of IFM (0.023) that is described with a single item. This condition has practical advantages such as ease of application, brevity, and lower costs associated with their use from a validity perspective. However, it is a risky decision for predictive validity considerations (Hair et al., 2017). Therefore, it is suggested to improve the variable information media (IFM) by adding more descriptive items, for instance, based on social media in consumer intention to purchase innovative food products. Reputation, consumer perception, intentions towards innovation in food products could be more descriptive items to achieve a rise of IFM (Balakrishnan & Foroudi, 2020). |
Source: own.
• The structural model
Regarding the 10 posed hypotheses (see Table 1), we believe that all of them represent a great opportunity to consider the firm and government decisions in benefit to the consumer about FINT-FTNS described in Table 7.
Table 7 Hypotheses explanation as structural model
| Hypotheses | Explanation |
|---|---|
| H1: “MKE contributes positively to HCH” it is not supported. | The main reason is that MKE (marketing efforts) based on 2 indicators to describe the relationship with HCH (healthy choice) were not enough. To improve the framework, it is necessary to add more indicators in MKE (MKE2 was removed, see Table 2) related to HCH (healthy choice) and vice versa. In fact, it is expected that marketing efforts provide more consistent and quality information about how to drive balanced diets to improve the decision in food selection (Zucker, 2017). However, this result is the first contact of the relationship of FINT with FNTS, and it seems that there is still a null-scarce relationship among MKE-HCH. For instance ( f2= 0.004) is considered with no effect (<0.02), and the coefficients of determination (R2) are for MKE= 0.217, and HCH= 0.352 (see Figure 2). This is an opportunity to consider the firm and government decisions in benefit to the consumer. |
| H2: “MKE contributes positively to IFM” it is supported. | Its size effect (f2= 0.012) is considered with no effect (<0.02), and the coefficients of determination (R2) are for MKE= 0.217, and IFM= 0.043 (see Figure 2); hence, R2 for IFM needs to be improved. In other words, the consumer still does not perceive how MKE (marketing efforts) based on 2 indicators is related to IFM (information media) with a single item. It is necessary to add more indicators in MKE (MKE2 was removed, see Table 2) that involve the power of digital marketing channels, such as web pages, blogs, vlogs, and e-mail marketing (Mejía-Trejo, 2019), to foster the information of FINT. Likewise, it is necessary to add more indicators in IFM (IFM1 is a single item), related to MKE, and vice versa to improve the framework. It is a very hard task if we noticed in the last times about Artificial Intelligence, Chatbots, Machine Learning, etc., just to mention a few. Such software algorithms decide our news feed, programmed to prioritize the user attention over truth to optimize for engagement, outrage, anger, and awe (Wheeler, 2017) |
| H3: “QNI contributes positively to IFM” it is supported. | Its size effect (f2= 0.008, see Table 5) is considered with no effect (<0.02), and the coefficients of determination (R2) are for QNI= 0.300, and IFM= 0.043 (see Figure 2); hence, R2 for IFM needs to be improved. In this case, the consumer still does not perceive how QNI (quality and / or nutritional innovation) based on 6 indicators is related to IFM (information media) with a single item. It is necessary to precise each one of the 6 QNI indicators (QNI5 was removed, see Table 3); also, it is necessary to add more indicators in IFM (IFM1 is a single item), to relate it to QNI, and vice versa related, to improve the framework. In this sense, this is a challenge of how to relate QNI with IFM is crucial based on the data veracity in the digital economy of the new normal to believe in the information. How will we determine if the data is real or overestimated or underestimated? (Accenture, 2018). |
| H4: “PKG contributes positively to HCH” it is not supported. | The main reason for this is that the consumer still does not perceive how PKG (packaging innovation) based on 2 indicators is related to HCH (healthy choice) based on 2 indicators, too, were not enough. Although the success of new food technologies hinges on consumers’ behavioral responses to the innovation, the healthy choice theoretically depends on the new packaging technologies associated with improved quality and safety introduced; however, it is unclear if they will be successful (Chen & Anders, 2013). Therefore, it is expected and necessary to precise the indicators in PKG and related to HCH (healthy choice) and vice versa, to improve the framework. It is necessary to consider adding more indicators such as the food labeling content (FLC). Food labels become the only tool for consumers to acquire additional information about products to make the purchase decision, supported in different technologies based on mobile marketing tools, like QR Code (Quick Response Code) (Bacarella et al., 2016). The result in this fourth contact of the relationship of FINT with FNTS seems that there is still a scarce relationship among PKG-HCH. For instance (f2 = 0.038, see Table 5) is considered with small effect (0.02-0.15), and the coefficients of determination (R2) are for PKG= NA, and HCH= 0.352 (see Figure 2); however, it is not supported (see Table 5). |
| H5: “IFM contributes positively to HCH” it is supported | Its size effect (f2= 0.056, see Table 5) is considered with small effect (0.02-0.15), and the coefficients of determination (R2) are for IFM= 0.043, and HCH= 0.352 (see Figure 2) and hence, R2 for IFM needs to be improved. In this case, the consumer still does not perceive how IFM (information media) based on a single item is related to HCH (healthy choice) based on 2 indicators. It is necessary to add more indicators in IFM (IFM1 is a single item) and relate it to HCH and vice versa to improve the framework. About IFM, it is a topic under misinformation. The problem originated as a social condition that requires constant monitoring and adjustment that impacts veracity (Anderson & Rainie, 2017). |
| H6: “IFM contributes positively to PRK” it is supported | Its size effect (f2= 0.157, see Table 5) is considered with medium effect (0.15-0.35), and the coefficients of determination (R2) are for IFM= 0.043, and PRK= 0.145 (see Figure 2); hence, R2 for IFM needs to be improved. This condition could theoretically confirm that the prevailing media engagement has a significant role in creating an intention to purchase innovative food products (Balakrishnan & Foroudi, 2020). Social media encourage the rapid spreading of food-related information and potentially act as a policy measure to improve food literacy, healthy eating, and well-being. However, some authors warn about the lack of control over the quality of the shared information and the risks of knowledge distortion (Steils & Obaidalahe, 2020). Also, this corresponds to the fact of how the internet is overburdened with tantalizing graphical and textual depictions of high-fat, high-calorie, high-sugar, and high-sodium snacks, pastries, beverages, and fried foods, without ethics. Usually, it is aimed to trigger consumers’ motivation to buy such foods and, in turn, incur burdens to their health (Yang-Chu et al., 2018). It could be theoretically complemented in further studies, assuring the firms are more active in engaging their consumers, truthfully informative when advertising the product but not repetitive, and listening to consumers’ feedback (Bermoy et al., 2021) diminish distorted information. Furthermore, new communication and information techniques are expected to acquire new markets (Cillo et al., 2019). |
| H7: “IFM contributes positively to NFT” it is supported | Its size effect ( f2= 0.001, see Table 5) is considered with no effect (<0.02); the coefficients of determination (R2) are for IFM= 0.043, and NFT= 0.549 (see Figure 2) and hence, for IFM needs to be improved. In this case, the consumer still does not perceive how IFM (information media) based on a single item is related to NFT (new food technologies are unnecessary) based on 6 indicators. To improve the framework, it is necessary to add more indicators in IFM (IFM1 is a single item), relate it to NFT, and vice versa. We believe that the variable IFM is crucial to reinforce it with more predictors in the construct because it can be a source of disinformation, misinformation, and misinformation (UNESCO, 2018). |
| H8: “PRK contributes positively to NFT” it is supported | Its size effect (f2= 0.427, see Table 5) is considered with large effect (>0.35); the coefficients of determination (R2) are for PRK= 0.135, and NFT= 0.549 (see Figure 2). In this case, the consumer perceives how PRK (perception risk) based on 4 indicators is related to NFT (new food technologies are unnecessary) based on 6 indicators. It is suggested to precise more PRK, because PRK4 was removed (see Table 3) to improve the framework. These results theoretically could be complementary. The perception risk and perception benefits are significant determinants of consumer acceptance of new food technologies. The individual can make an initial assessment based on the trade-off between risk and benefit perceptions (Albertsen et al., 2020). |
| H9: “PRK contributes positively to HCH” it is supported | Its size effect (f2= 0.266, see Table 5) is considered with medium effect (0.15-0.35); the coefficients of determination (R2) are for PRK= 0.135, and HCH= 0.352 (see Figure 2). In this case, the consumer clearly perceives how PRK (perception risk) based on 4 indicators is related to HCH (healthy choice) based on 2 indicators. It seems that the perceived risk of consumers (PRK) boosts the interest in a balanced diet (HCH1) and the control of food (HCH2), no matter the consequences. Theoretically, it might be a possible consequence of a trend food; trends are plastic, happen for a long time, and are driven by macro events that cross the whole society. On the other hand, fashion is the visible cultural effect of trends (F&B, 2021). Due to the COVID-19 pandemic, consumers’ diets have changed for the near future and possibly for the long-term, revealing a focus on foods that support immunity, are affordable, and provide comfort, as well as a major shift in snacking habits (Pollock, 2021) being probably a trend. |
| H10: “HCH contributes positively to NFT” it is supported | Its size effect (f2= 0.137, see Table 5) is considered with small effect (0.02-0.15); the coefficients of determination (R2) are for HCH= 0.352 and NFT= 0.549 (see Figure 2). In this case, the consumer clearly perceives how HCH (healthy choice) based on 2 indicators is related to NFT (new food technologies are unnecessary) based on 6 indicators. It seems that the prevailing and boosted interest in a balanced diet (HCH1) and the control of food (HCH2) still produce a dissonance about the results on the consumer perception over “new food technologies are still unnecessary” (NFT). Theoretically, if HCH1 and HCH2 are a product of a trend, then “more healthy choice (HCH) more perception of new food technologies are unnecessary (NFT)”. This healthy choice (HCH), based on technology, looks like a contradiction. For instance, modern biotechnological techniques have facilitated research on and development of genetically modified organisms (GMOs). Applications of GMOs offer prospects for better human and animal health, food improvement, new ways to produce biofuel and fiber, and environmental protection. However, there are different opinions on whether GMOs and GM food represent risks of harmful effects on health and surroundings. Part of the arguing over GMOs may start in the new experience of the genetic modification techniques, the time before health and environmental impacts can be evaluated, and the differences in value promises, ranging from safety to social and sustainability issues (Nordgard et al., 2013). The American Medical Association and World Health Organization conclude from the research of independent groups worldwide that genetically modified foods are safe for consumers (Norris, 2015). However, there are still significant gaps in the literature documenting the impacts of innovations in food systems, for instance, on cardiovascular health factors such as dyslipidemia, excess body weight gain, high blood pressure, and insulin resistance (Anderson et al., 2019). Foods contain major and minor components and bioactive compounds that are of primary importance for human nutrition. The importance of these compounds has accelerated the development of innovations in the food industry, generating the so-called functional foods and nutraceuticals. Therefore, we believe there is a grand opportunity to foster this new generation of FINT (Galanakis, 2017). |
Source: own.
Hence, there is evidence that innovations based on technology can favorably alter eating behaviors; developing a food system that is both healthy and sustainable requires innovation (Galanakis, 2017). The market success of food innovations depends critically on consumers’ perceptions of and response to the technologies (Chen & Anders, 2013). Disgust, along with food neophobia and related traits, has been identified as a major barrier to accepting novel food alternatives (Tuorila & Hartmann, 2020). Finally, it is important to involve the consumer with the knowledge or regulation, which determines that any health benefits of foods announced must be scientifically proven (Guiné et al. 2020).
b. Practical implications
This study makes several practical contributions to the context of how the food innovations technology (FINT) and food technology neophobia (FTNS) are perceived as consumers' nutrition conditions as a basis of design against overweight, obesity, and COVID-19 for the next normal described as follows in Table 8.
Table 8 Practical contributions
| Item | Description |
|---|---|
| 1 | It is facing two important scales about food innovation technology (FINT) (Vanhonacker et al., 2013) with 6 variables and 23 items or indicators with food technology neophobia scale (FTNS) (Cox & Evans, 2008) with 4 variables and 13 items or indicators. |
| 2 | The FINT-FTNS framework is the first attempt, never used before in one framework. To measure and determine the relationship of the main underlying variables using SmartPLS 3.3.3 to explain how the specialists can handle them (e.g., marketing strategies, new product development of business, food engineers, managers, etc.), academic and government authorities. Suppose a firm or government decision about introducing new FINT in the market or how the current food technology affects the consumers' nutrition and quality of life; such FINT is based on organic raw materials, a new process improving safety with a noticeable reduction in fat, sugar, salt contents, with ingredients providing more health benefits, etc. This situation elicits intense scrutiny of a market target or social group with malnutrition, obesity, overweight, or, furthermore, the COVID-19 pandemic and its consequences. Besides, let us consider the kind of people to require answers, e.g., younger Millennials, Centennials, X generation, or gender, or monthly incomes, or education level. In our case, the study respondents were 62.6% at 18-29 years old, 60.8% females, 73.3% single, 39.2% with higher education, 42.4% with less than 9,000 pesos monthly income pesos. The facing FINT to FTNS is useful because it helps to prevent the reaction in three actors: consumer decision (to improve the perception of how it is nurtured), food industry (to improve marketing strategies, new product development in business both to minimize the FTNS), and health government authorities (to improve public policies about how to assimilate the FINT). |
| 3 | It is strongly suggested to introduce into the FINT (Vanhonacker et al., 2013) construct more indicators improving the description of the following variables: marketing strategies (in market efforts, MKE, and in assortment expansion, ASE), or innovation issues (in quality and/or nutritional innovation QNI, market innovations, MKI and packaging innovation, PKG and convenience innovation, CIN). On the other hand, FNTS (Cox & Evans, 2008) is also strongly suggested to include more indicators to describe in this regard, in healthy choice (HCH) and Information Media (IFM). The measurement of FINT-FNTS framework underlying variables could determine, or even more, dictate public policies about introducing the FINT interrelated with FNTS. It is aimed to determine consumers' nutrition conditions as a basis for enhancing consumer acceptance and promoting successful food market introduction for the next normal. |
Source: own.
We determined framework suggestions to achieve its improvement for the business. See Table 9.
Table 9 Framework suggestions to improve
| Item | Descriptions |
|---|---|
| 1 | FTNS may predict food neophobia, and it is also relevant for manufacturers; it is highly specific and may not embrace all aspects that impact neophobia. FTNS is highly relevant for manufacturers and researchers within consumer science but is inefficient in measuring the intention to purchase innovative food products. It needs to measure attitude towards purchasing new and innovative foods and foods produced with technology (Damsbo-Svendsen et al., 2017) |
| 2 | To achieve the measure of attitude to purchase and according to our results. The FTNS construct needs to be complemented with a new variable called in this way (ATP); the statements of marketing efforts (MKE) and information media (IFM) must be incremented (currently 2 and 1 items, respectively) and enough differentiated to avoid collinearity. Regarding IFM, it is suggested as the inclusion of social media repercussions. |
| 3 | About FINT, it is suggested the addition of the variable type of technology (TOT) (Galanackis, 2017) with items around the organic, functional, GMO, nutraceutical, cosmeceutical, etc., to the scope of such technologies in the preference of the consumer. Besides, it would be interesting the addition of a variable called regulation (REG) (Guiné, et al. 2020)) to verify the level of consumer knowledge of public policies in the environment, health, social impact, etc. about the current food technologies or the introduction of new FINT. There is evidence about innovative food system policies that have documented proof with a favorable impact on dietary behaviors and, in several cases, health outcomes (Anderson et al. 2019). With all the suggested new variables and items, it would be worth applying exploratory factor analysis (EFA) redesign to be confirmed through PLS-SEM and achieve a solid and unique framework called food innovation technology consumer nutrition acceptance (FITCNA). It would be aimed to assess the level of acceptance and tolerance of FINT-FTNS from the consumer nutrition point of view. |
| 4 | With all the suggested new variables and items, it would be worth applying exploratory factor analysis (EFA) redesign to be confirmed through PLS-SEM and achieve a solid and unique framework called food innovation technology consumer nutrition acceptance (FITCNA). It would be aimed to assess the level of acceptance and tolerance of FINT-FTNS from the consumer nutrition point of view. |
Source: own.
Conclusions
It is imperative to reach a quality of life resulting from changes in healthy behavior (Rodríguez-Leyva & Pierce, 2021). Businesses must contribute to such commitment because they are not immune to the impacts of malnutrition (Wellesley et al., 2020). This study is the first attempt to solve it. It offers first insights into how the food innovation technologies scale FINT (Vanhonacker et al., 2013) with the food technology neophobia scale FTNS (Cox & Evans, 2008), in one framework, never used before. The main purpose is to use the FINT-FTNS framework to determine consumers' nutrition conditions to design a balance on nutrition and business for the next normal insights using PLS-SEM. It is a preliminary study mostly based on 401 respondents (Oct-Dic-2021) with 63% persons between 18-29 years old, 61% female, 73% single, 42% with less than 9,000 Mexican pesos monthly incomes we conclude the Table 10.
Table 10 Conclusions
| Item | Description |
|---|---|
| 1 | On the FINT side is necessary to improve for business:
|
| 2 | On the FTNS side is necessary to improve for business:
|
| 3 | The final construct, FINT-FTNS, suggests its improvement by adopting a marketing point of view. Based on the information media, the intention to purchase, the type of food technology to be consumed, and regulation policies to protect the consumer from answering the consumers' nutrition conditions as a basis of design to foster a healthy food intake against chronic diseases for the next normal. |
| 4 | It is highlighted that the FINT (Vanhonacker et al., 2013) and FTNS (Cox & Evans, 2008), do not include questions about the intention to purchase in an emergency context (e.g., COVID-19, overweight or obesity), motivations, attitudes, and features of the web (Mejía-Trejo, 2021), amongst other relevant indicators. However, we remark the possibility of achieving the suggestions mentioned above using exploratory factor analysis (EFA) to be confirmed through PLS-SEM to compute and determine a solid redesign framework called food innovation technology consumer nutrition acceptance (FITCNA) to solve it. |
| 5 | The use and value of such a model would be possible to support firms and government decisions in the new kind of development in foods that protect consumer nutrition conditions (organic, functional, nutraceutical, GMO, nanotechnological, etc., as food innovation technologies). It would be focused on fighting several diseases elicited from malnutrition and fostering a healthy food intake against chronic diseases. |
Source: own
Limitations and future studies
All empirical studies have certain limitations. See Table 11
Table 11 Limitations and future studies
| Item | Description |
|---|---|
| 1 | Sampling methods may limit survey results due to recruiting respondents' "snowball self-report" nature. The survey results are based on the questionnaire's self-reported data to remind them of their opinions. |
| 2 | The innovation models used by the food industry indicate that the sector is moving towards open models focusing on the acquisition of external knowledge and on the ability of the companies to adapt themselves to socio-economic and institutional change (Bigliardi et al., 2020). The supporting novelties such as biotechnology, nanotechnology, eating patterns, etc. represent an important opportunity for the food industry, which requires significant investments by companies towards research and development (He et al., 2019). |
| 3 | With adjustments of FINT-FTNS for the new framework design, based on a marketing point of view, we would obtain a new model that we would call food innovation technology consumer nutrition acceptance (FITCNA). Therefore, more research on how to foster it is ahead waiting. |
| 4 | It is suggested the application of fuzzy set Qualitative Comparative Analysis (fsQCA) (Ragin, 2008; Mejía-Trejo, 2021b) to the final FITCNA. This fsQCA verifies how many different underlying patterns would be obtained (or not) to the same result about consumer nutrition conditions, besides the unique results obtained from PLS-SEM. |
Source: own

