


 nueva página del texto (beta)
 Inglés (pdf)
 Artículo en XML
 Referencias del artículo
 Enviar artículo por email
 Citado por SciELO
  Similares en
SciELO
Similares en
SciELO 
 Permalink
1. Introduction
The dental sealer aim is to prevent a phenomenon known as microfiltration, which may be present between intraradicular dentine and cement. Avoiding this problem, the interior of the root canal must not show bacterial growth at the Surface (1,2). An ideal dental sealer must accomplish the following requirements (3,5):
Non-irritant to the tooth and periapical tissues
Insoluble in tissue fluids
Non-staining the tooth
Dimensionally stable
Non-resorbable
Radiopaque
Good mixing consistency
Biocompatibility
To exhibit effectiveness, a dental sealer must pass through several tests as push out resistant dislodgment, hydrophobicity properties measurement, spectrophotometry analysis, rheological measurements, radiopacity, etc.
Methodologies in vitro are used to estimate sealing capacity, by measuring microleakage that allows the tracer agent to penetrate the filled canal. The commonly used tracers are dyes, radioisotopes, bacteria, and their products. Other methodologies, such as fluid filtration and dye extraction methods have also been used, their advantage is the high reproducibility (6).
Several filtration methodologies reported in the literature applied to colorants, fluids, and gas, have been used to evaluate the sealer capability of different types of cement and endodontic materials. According to these methodologies, the sealer hermetic importance at the obturation favors the periapical chronical damage obturation. Besides, the principal conduit different ramifications can exhibit bacterial presence that induces necrosis and pulpal infections, resulting in periodontal problems. This remarks the sealer penetration value on non-visible spaces (7, 9).
Fundamental physical laws give direction to the fluid penetration model, necessaries for endodontic microfiltration studies, to develop experimental methods and understand the obtained results. Microfiltration is the space created between the surfaces at the root canal interior, it is a complex process that can be experimentally reproduced by fluid model penetration. Nevertheless, each experimental technique presents advantages and disadvantages (10). The model was proposed by Pashley (11), which involves the bubble air movement through a capillary tube filled with liquid. This method presents many advantages in comparison with other methods as dye penetration, as the samples are not destroyed, allowing apical and coronal sealing being assessed after a long period. The results are recorded automatically, avoiding operator errors and providing quantitative measurements, the results are precise, and it is more sensitive than dye penetration method (12).
The microfiltration can be measured by the fluid filtration method, which is more according to the clinical conditions. Despite there is no standardization, a study reported in (13) suggests better values for pressure and time for the experimental setup. The system requires of a certainty pressure, generated by a nitrogen or oxygen tank, and the optimal pressure was reported as 15 psi, due to clinical conditions and is ideal for a high sensibility system. The same study reports also that 1-hour measurement time should be adequate even when other authors present times from 50 seconds to 3 hours because the uncertain between the clinical conditions and experimental conditions.
The LabVIEW software can be used for several purposes such as computations, instrumentation, machine vision, etc. The image processing using block representation is a simple method, IMAQ Vision includes edge detection, object tracking, histogram, pattern matching, etc. Then, the increased application of LabVIEW virtual instruments is due their flexibility and the ability to satisfy specific user requirements combined with construction simplicity (15).
This paper presents the development of experimentation and automatization of permeability fluid technique. The following objectives are desirables:
To generate a 15 Psi of pressure in a closed system having the pressure source in one extreme and the obturated tooth in the other.
To introduce the air bubble to the system and record it along its way.
To measure the bubble's total path length through digital imagen processing
To develop an easy user interface capable to save the images obtained during the process, establish the test time, and automatically returns the distance traveled by the air bubble.
2. Materials and equipment
Materials: venoclysis equipment, syringe, obturated dental piece, hose couplers, electrical transformer, diodes, resistors, capacitors, voltage regulator, LED’s.
Equipment: USB camera Logitech C920 Full HD 1920x1080, Laptop Dell Inspiron 15 5000 series, LabVIEW 2014 with IMAQ Vision toolbox, Ecko cooking pot of 5L, Presto analog manometer.
3. Methodology
The fluid penetration model prototype developed in this work consisting on a pressure system built with a cooking pot, a source to reach the pressure as nitrogen tank or an air compressor, generating 15 psi of pressure, to a liquid with a contrast medium. The equipment has three main parts: the cooking pot, a conditioned USB camera for image processing linked to a computer with LabVIEW and a sealed tooth connected through a capillary tube (with 4 mm of diameter) to the system, as shown in the CAD design in Figure 1.

The cooking pot has a manometer installed to visualize the correct pressure at the system. The second box in Figure 1, represents the voltage source for the LED light, it is consisting on a transformer, a diode bridge, a capacitor to reduce the voltage ripple and a voltage regulator to provide 5V and 1.5A on DC voltage.
An air bubble is introduced to the system at 15 psi using a syringe, and the USB camera monitored its position. If the bubble moves, it indicates tooth filtration, otherwise, if the bubble is almost static, the dental sealer will be clinically apt for use.
To avoid perturbation of other light intensities, the USB camera must be conditioned, so then, it is implementing a sealed box with LED light and a capillary tube, as shown in Figure 2.

The digital image processing is performed on LabVIEW and IMAQ vision toolbox. IMAQ vision toolbox presents a complete set of digital image processing and acquisition functions that improve the efficiency of the projects and reduce the programming effort. The main objective is to measure the bubble displacement in the system, for this purpose the methodology described on Figure 3 is implemented.
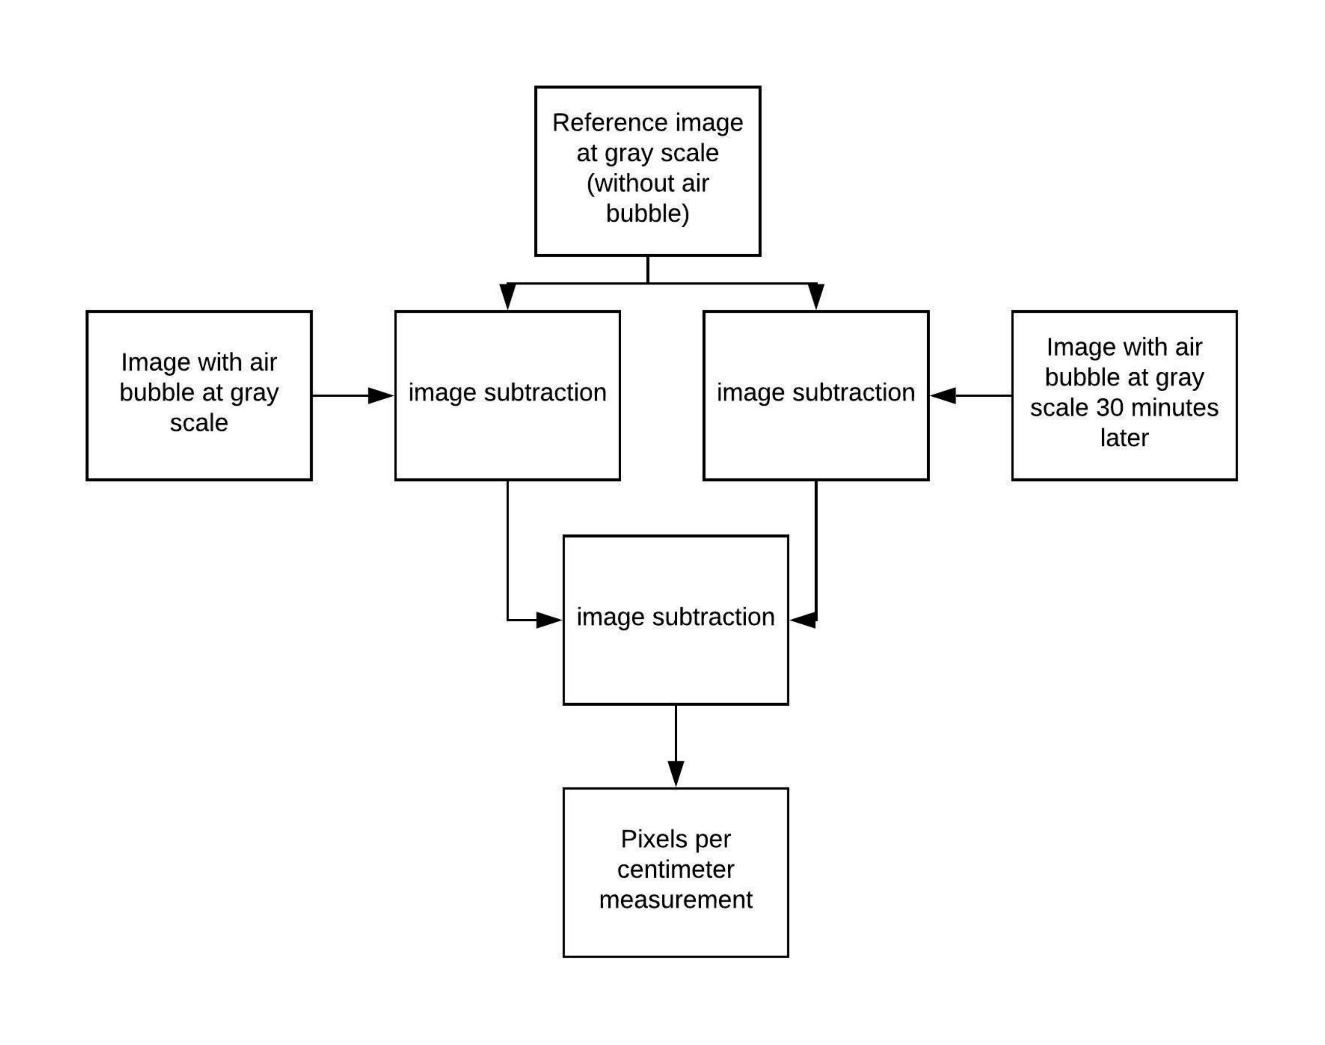
As we can see on Figure 3, firstly, a reference image at a grayscale is taken with the system at conditions stated above without an air bubble. Then, the second image in grayscale capture the air bubble presence when this it is injected to the system, and the program automatically performs the subtraction between the reference image and the second one to isolate the region of interest. Next, the third image at grayscale is taken 60 minutes later and it is subtracting with the reference image. Finally, a subtraction between both regions of interest is performed and the result is measured in pixels per centimeter using the VI IMAQ clamp horizontal block. The whole experiment consists of taking three images and making the digital image processing to obtain the microfiltration. The max range of measure depends on the image covered by the camera (approximately 5 cm).
3.1 Program development
The program developed in this paper was performed following the methodology stated previously with the main objective of making it friendly for the user. It is split into two user interfaces, the first interface obtains the regions of interest for the air bubble at the beginning of the experiment and at the end of the experiment, the second interface computes the longitude path achieved by the air bubble. The user interface I is as shown in Figure 4.

The interface displays the real-time camera, the reference image (image A), the picture with a bubble at the beginning of the experiment (image B), the image at the end of the experiment (image C), and the subtraction of these pictures. The final user must choose the camera port, set the experiment time, set the folder address where the pictures will be saved, give a click on the image without bubble and press the begin button and the program automatically performs the process described above.
The block diagram of the interface I is displayed in Figure 5, where the main processes are enclosed on boxes. The black box shows the real-time camera initialization, the red box depicts the process for transforming the image in grayscale, this block is repeated inside the other boxes (three times), because each image taken, is transformed at grayscale. The yellow box exhibits the process for picture B and the subtraction with the image A to obtain the region of interest. Finally, the blue box presents the subtraction between image A and C, and picture B and C. The whole results are saved in a specified route established by the user.

For the measurements process, a second interface was developed, and this user interface is shown in Figure 6. The last image of the first interface is exported by clicking on the folder icon, where the user specifies the route. The customer has the options to zoom the picture, handle it, and enclose the region of interest in a box. The system counts the pixel per dots containing at the region of interest and transforms this quantity on centimeters, this value represents the distance achieved by the air bubble.

The interface II block diagram is shown in Figure 7. The user must enclose the region of interest, and then a property node to get the last event obtained from the image display icon. If this is true, IMAQ clamp horizontal max VI icon measure the distance and it is divided by a constant of 560, this constant is obtained by the calibration process, and represents the pixel’s quantity per centimeter. The result is displayed on a numerical indicator.

3.2 Device testing
For testing the prototype, three different dental sealers are proposed:
A commercial dental sealer (AH Plus) as control.
The dental sealer developed in (14).
A new development of a dental sealer reformulating the cement used in (14) by researchers of the Physics Institute at Autonomous University of San Luis Potosí, this development is not available yet in paper due to a patent process.
The dental sealers are placed on obtured dental pieces, three teeth per cement, the commercial will serve as control and the results will be compared to the reference (13).
4. Results
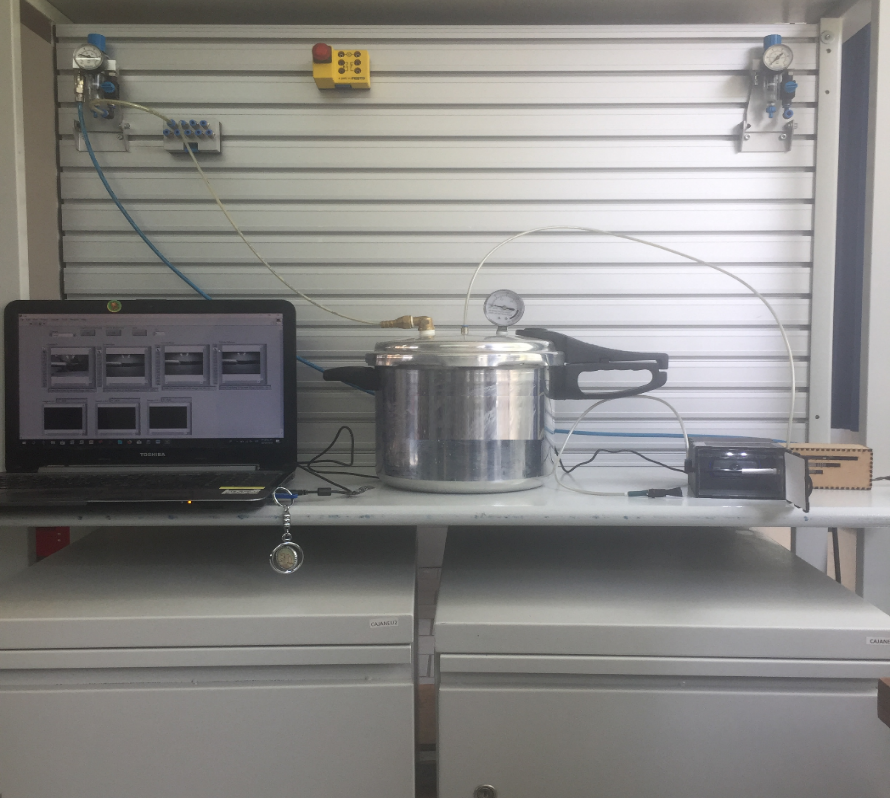
The system described was built following the description at the CAD design. A liquid (water) with contrast (white colorant) at 15 psi and an obtured tooth with a commercial dental sealer was used to prove the prototype performance. Figure 8 depicts the experimental setup with a cooking pot linked to an air compressor, the camera conditioned with LED light, the voltage source for the LED’s, and the computer with the interface developed in LabVIEW.
Then, Figure 9 shows the results obtained with the interface I, where clause a) depicts the reference image without air bubble. Clause b) shows the figure obtained where the air bubble is into the system, and the subtract between clause a) and clause b) is shown in clause d). Then, clause c) displays the air bubble captured after the time stablished by the user (60 minutes) and clause e) presents the subtract between clause c) and clause a). Finally, clause f) shows the subtract between clause d) and clause e).
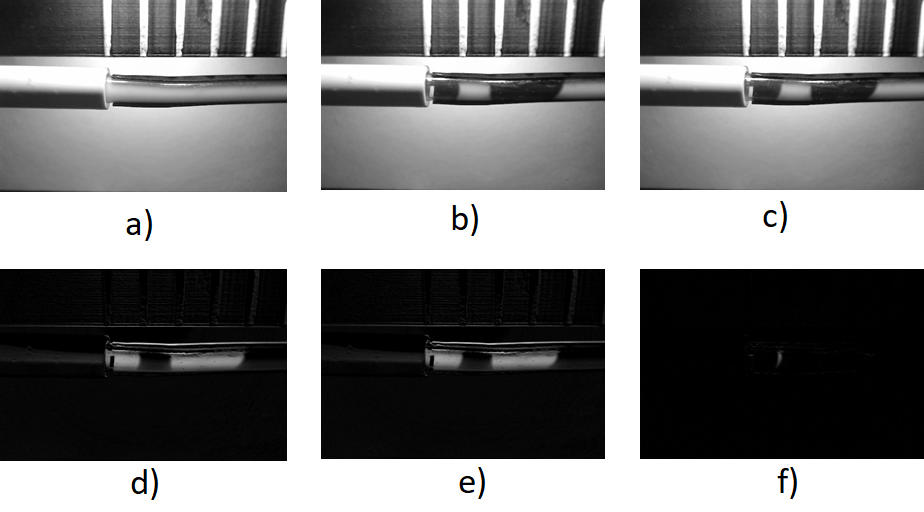
The image at clause f) in Figure 9, is exported
to the second interface to compute the air bubble path length. Figure 10 shows the result obtained, where the region of
interest is enclosed in a box and automatically the program computes the distance on
centimeters. For this case was of 0.05 cm. The result is expressed in

Different dental sealers were proved for verified the prototype performance, one
commercial (AH Plus) and two experimental developments. One of these experimental
developments were presented in (14), and the
other one is in a patent process for researcher of the Physics Institute of UASLP.
Each test was made by triplicate for giving ensure the results, obtaining the
average data described in Table 1. The whole
values obtained are in the range of
Table 1. Average results in three different dental sealers.
| Dental sealer | Distance (cm) | Result in μL/min/cmH 2 O |
| Commercial | 0.05 | 9.9x10⁻⁵ |
| Dental sealer developed in (14) | 0.06 | 11.9x10⁻⁵ |
| New experimental dental sealer | 0.04 | 7.9x10⁻⁵ |
4.1 Discussion
The prototype developed presents similarities, advantages, and disadvantages against others system based in Pashley test presented in previous works. The similarities are the pressure, closed system, controlled source for pressure, and air bubble injection. In (16), the authors use a digital SLR camera with AutoCAD as interface; the experiment is mounted on a dark surface with a rule to measure the bubble displacement. In (1), a graduated pipette is used to visualize the bubble movement, and no camera is used. On the other hand, in (14) presence sensors are used as a barrier for determining if there exists microfiltration.
The advantages are:
The user can establish the pressure and the time of the test. There is no standardization of these values in the literature, however the values used in this paper are according to reference (13).
A high definition USB camera was used for recording the bubble displacement, this camera is low in price than an SLR digital camera. The minimum resolution achieved by the camera is 1.79 mm (obtained by divide each centimeter by the constant of 560 pixels) and the maximum value is 5 cm.
The automatized process in LabVIEW for taking images, processing them and the test duration.
The captured images are saved on a specified route established by the user.
It is possible to calculate the bubble displacement using digital image processing and automatically return the distance.
The observed disadvantages are:
The using of two interfaces for achieving the whole process, and it complicates the easy use of the test.
The need to use a contrast medium to visualize properly the air bubble.
The tooth fixation in the system is complicated, it is necessary to use better materials to attach it.
The camera resolution is low (560 pixel’s per centimeter), with a more powerful camera the results can be improved.
5. Conclusions
This paper presents the developing and automatization for permeability fluid method to prove microfiltration on dental sealers.
The experimental setup consists of a cooking pot linked to a nitrogen tank or air compressor to generate 15 psi of pressure with a liquid (water) with a contrast medium (white colorant). At the cooking pot output a box, conditioning with white LED light and a camera are connected and then, at the box output, an obtured tooth with a commercial sealer is fixed. The air bubble is injected into a capillary tube through a syringe. The program has two interfaces developed in LabVIEW, the first one, captures the images on grayscale, isolates the region of interest (air bubble) and perform the subtract between the image with the air bubble at the beginning of the experiment and the image with the air bubble at the end of the experiment (60 minutes later).
The second interface uses the image obtained from subtracting between air bubbles, and the user encloses this result in a box. The box computes the pixels per dots quantity of the figure and changes this value to centimeters.
Experimental results were carried out with two experimental sealers and a commercial sealer on an obturated tooth and the distance measured in a triplicated experiment, and results are consisting between them. It can be concluding that the experimental setup works properly.
As future work, it will perform more test with different dental sealers and improve the user interface to make it friendlier.

