


 nueva página del texto (beta)
 Inglés (pdf)
 Artículo en XML
 Referencias del artículo
 Enviar artículo por email
 Citado por SciELO
  Similares en
SciELO
Similares en
SciELO 
 Permalink
Introduction
According to the world bank, air pollution is the 4th leading cause of premature death in the world, causing 1 in 10 deaths in 2013 [1]. Mexico City has had a historical problem with air pollution, which has led to traffic restricting regulations and the plan to ban Diesel cars by 2025. Nitrogen Oxides (NOx) are a contaminant produced as a by-product of combusting fuel at high temperatures and are inclusive of NO and NO2. In Mexico, the biggest contributor of NOx is private vehicle use, accounting for 78 % of its generation [2]. It has been identified that NO2 is harmful to human health as it can cause inflammation of the airways, reducing lung function and thus increasing the susceptibility to respiratory diseases [2,3]. Although aircraft-born NOx emissions represent only 5% of anthropogenic NOx generation in Mexico City, it is the concentration of this contaminant around airports that is a concern. According to the Mexico City Emissions Inventory, the highest NOx concentrations in the Mexican capital are found around the airport [2], and the levels are high enough to double the allowable threshold imposed by national and international regulations.
With an annual forecast in aviation demand increase of 5.1 % [4] this problem is bound to get worse. In Mexico, civil aviation increased by 50 % in the past four years, suggesting that by 2021 there could be twice as many aircraft landing at Mexico City’s airport than there were in 2013 [5].
Efforts are being made around the world to mitigate the environmental impact of aviation, both, at high altitude, and around the airports. A comprehensive review of airport-related pollutants can be found in [6]. Balakrishnan and Deonodan [7], evaluate different mitigation measures focused on reducing Taxiing emissions. There are also initiatives focused on reducing emissions and fuel burn through alternative fuels [8,9], or new aircraft configurations like the NASA NX-3 Blended Wing Body [10]. Although many of these initiatives are useful and necessary to reduce emissions, few of them are focused on reducing emissions during take-off and climb.
The importance of reducing emissions at these flight stages is that it is here where NOx productions rates are the highest. According to the International Civil Aviation Organization (ICAO), near ground aircraft operations can be described by the Landing and Take-Off (LTO) cycle. This cycle is composed of approach (4 minutes, 30 % power), Taxi (26 minutes, 7 % power), Take-Off (0.7 minutes, 100 % power) and Climb out (2.2 minutes, 85 % power). Since NOx is proportional to engine power setting, and thus operating temperature, its production is highest at high power settings. Despite the short time this flight stage lasts, the take-off and climb out phases account for around 70 % of the LTO cycle NOx production depending on engine type [11].
Water injection into an aircraft gas turbine during these critical flight phases can considerably reduce the compressor’s operating temperature, achieving compressor delivery temperatures that can be even lower than the ideal isentropic case [12]. This decrease in temperature brings about a reduction in the production of NOx, which Daggett [13] evaluates in 47 % when a 2 % water to air ratio is injected into the engine. The purpose of this article thus is to explore the potential of including this as a new technology on board an aircraft.
When water is injected into an aero-engine the gas properties will change due to the reduced operating temperature coming from the heat transfer between the gas and the water droplets. This intercooling effect reduces the compressor specific work, thereby increasing the thermal efficiency of the engine. The injected water, however, evaporates and increases the humidity of the air, also affecting gas properties. These effects will be isolated and commented for a constant thrust take-off case. In addition to this, the model used to evaluate the compressor temperature drop and water evaporation model will be commented and compared to other models available in the literature.
Evaporative Cooling inside a Compressor
Dalton’s law of additive pressures states that the pressure of a gas is equal to the sum of the pressures each gas would exert if it existed alone at the mixture temperature and volume. The pressure of atmospheric air is then the sum of the partial pressures of water vapour and dry air (which is the sum of the partial pressures of N2, O2, Ar, and other constituents). The mass fraction of water vapour (v) to dry air (a) is known as the absolute or specific humidity of the air.
Where Rv and Ra are the specific gas constants of water vapour and dry air and are equal to the universal gas constant, Ru divided by the molecular weight (μ) of the components. Taking μv= 18.015 kg/kmol and μa= 28.97 kg/kmol, Eq. (1), becomes.
It can be seen that the amount of water vapour in dry air depends on its partial pressure, Pv. If water is added to dry air, w will increase up to a maximum value after which any addition of water will condense rather than add to the humidity content in the air. The relative humidity of a mixture is the ratio of the water vapour partial pressure, to the saturation pressure of the mixture at that temperature. It can be understood as a relation of the amount of particles of vapour (number of moles) in dry air, compared to the maximum amount of water particles that air can hold at a certain temperature and pressure.
Combining Eqs. 2 and 3, an expression that relates absolute humidity to relative humidity and saturation pressure can be obtained (Eq.4). This analysis is only valid as long as the gasses don’t react between them to create new constituents.
Water cannot vaporize unless it absorbs energy from the surrounding air in the form of latent heat of vaporization, hfg, which for water is 2501 kJ/ kg [14].
Also, the mass, internal energy and enthalpy of a mixture are the sum of the individual gas component contributions.
For a dry air-water vapour mixture (m) the enthalpy would be,
Where the subscript m, stands for water vapour-dry air mixture and a, for dry air. The enthalpy of water vapour (v) is the sum of the required enthalpy to vaporize that quantity of water if it was in its liquid form to start with, plus the enthalpy due to the actual temperature compared to a 0 degrees datum.
When air is sprayed with water, some of this water will evaporate (enough to saturate the air), and increase the moisture content of the mixture. The energy required for this process to occur will come from the air-water vapour mixture and so its temperature will decrease. The sensible heat lost by the air will equal the latent heat gained by the water, used to increase the moisture of the air. The steady-state energy equation then becomes.
Where h
f
is the enthalpy of the liquid water at the injection temperature. The quantity of water injected,
By combining Equations 4, 7, and 8, an expression for the energy balance that depends on inlet known conditions of the gas (state 1) and exit conditions (exit temperature, and exit absolute humidity) can be derived. However, the exit absolute humidity depends on the saturation and ambient pressures. The values for P sat depend on the mixture temperature and can be computed using the correlations found in Saul and Wagner [14]. In this way, an equation that depends only on T 2 can be solved iteratively to obtain the saturation temperature and absolute humidity of a water-vapour mixture, given the initial ambient temperature, pressure and relative humidity.
The water injection limit, assuming that all the water evaporates and that the evaporation rate is constant, would be that of saturating the exit air of the compressor [15]. In that case, the relative humidity along the compressor will be constant and equal to 100 %. The absolute humidity, or water vapour content will increase as the air gets hotter and can absorb more water. The rest of the water will remain in liquid form until the end of the last stage where the outlet is saturated.
This case would achieve the highest temperature reduction; however, it will be seen that to achieve this a considerable amount of water would be needed. In reality, for wet compression, quantities around 1 to 2 % water to air mass flow are used. This water is quickly evaporated inside the first stages of the compressor. The efficiency of this process depends heavily on water droplet diameter, ambient conditions and water injection rate.
Different evaporative models have been suggested, and they summarize into three main models that Kim et al. [16] compare and classify as: Diffusion model, Natural convection model, and Stokes model.
The natural convection model is based on detailed droplet thermodynamics, it accounts for sensible and latent heat transfers due to natural convection. The assumption of natural convection as opposed to forced convection arises from the fact that the droplet quickly accelerates to the flow speed (<10 milliseconds) [17]. A detailed analysis using this method is offered by Chaker et al. [17], and was later on used by Sanaye and Tahani [18], Zheng et al. [12] and Kim et al. [16,19]. The correlation for the evaporative rate based on the natural convection model can be represented by Eq. (9).
Where Sh is the Sherwood number and is a function of the Grashof number and Schmidt numbers which can be assumed to be constant and equal to 2 (Stokes model). Dv is the diffusion coefficient of water vapour in dry air, Ps and Ts the saturation pressure and temperature of air, and Pa, Ta is the ambient pressure and temperature.
The development of this method requires the calculation of many dimensionless quantities that add computational cost with little gains in precision. Since the aim of incorporating an evaporation model is to precisely predict the reduction in compression temperature and not the detailed drop behaviour, a more straightforward method was used, which is based in mass convection theory [20].
Defining the injection ratio as f, and the absolute humidity as w, we can state that, the injected water will be equal to the mass of each droplet (volume times density) multiplied by the amount of droplets per kilogram of dry air, n.
The rate of change of liquid water, by conservation of mass, has to be the rate of change of water vapour in the air.
Based on mass transfer, Spalding [20] gives the following expression for the rate of change of droplet size with time and was later written by White [21] and Bagnoli [22] in terms of the fraction of mass of water vapour to the mass of dry air (w). The expression, known as diffusion model [10] can be found below.
The mass diffusion coefficient, Dv is a function of pressure and temperature, and expressions for this are shown in Chaker et al. [17], Roumeliotis et al. [23], Bagnoli [22] and Eckert [24]. The correlation proposed by Eckert was chosen for this analysis, although they all seem to deliver similar results.
Integrating Eq.(12) an expression for the radius change for a given time-step can be found.
The compression equation can be computed from
Where nwet is the polytropic coefficient of compression which is the ratio of Cp* and R*. The wet polytropic coefficient of compression will be lower for wet compression than it is for dry air. This variation also brings about a reduction in compression work. Expressions for Cp* and R* can be found in White and Meacock [21] and are shown in Eq. (15).
The compressor is described here based on a compression rate, as suggested by White and Meacock [21] and Kim et al. [16], taking the compression rate to be 200s-1. With the average axial velocity of 75 m/s, the pressure, temperature, droplet diameter and moisture content, w is computed at each time step. The final moisture content or absolute humidity is obtained from Eq. (11) and increases at each time step as water evaporates.
Results and Discussion
The temperature along the compressor is shown below for the case of a day at 298 K and 25 % relative humidity, under take-off conditions. The compressor is modelled based on a common 2-spool turbofan engine similar to the CFM-56. The cases analysed are with (wet) and without (dry) water injection, at a rate of 2 % water to air ratio by mass. It is assumed that the water is injected between the Fan and the Booster or Low-Pressure Compressor (LPC).
The Dry Compression line depicts a normal process of compression, the temperature and pressure will have an initial rise after passing through the Fan, then the temperature will be unchanged between the Fan and the LPC. As the air enters the LPC and gets compressed the temperature will increase. The slope of the curve depends on the polytropic coefficient of compression, which in this case is 0.2857, corresponding to dry air. The booster exit temperature for this case is 461 K.
When water is injected into the duct between the Fan and the LPC, the air sees an immediate cooling, and hence there is an initial temperature drop from 349 K to 329 K corresponding to constant pressure evaporative cooling, also known as inlet fogging. Since the water is not fully evaporated, it will flow into the compressor, and a phenomenon is known as wet compression, and described by Equations (14) and (15) will start. The slope of the temperature curve for this case is initially smaller, while the polytropic coefficient of compression is still affected by a heat transfer from the gas to the water droplets. This coefficient is around 0.12, in agreement with what was suggested by White and Meacock [21]. At “x” coordinate 0.6 the water is fully evaporated, and the slope of the curve changes and is very similar to that of dry air. The slight difference in the polytropic coefficient of compression is due to the presence of humidity in the air (Humid air n=0.2842, for this case).
For this case, a 13 % reduction in compressor exit temperature is achieved under the injection conditions and with droplets of initial diameter of 5μm. According to Ref. [21] droplets, this size will follow the flow path, meaning they will not impact on the blades nor will they be centrifuged outwards, opposite to what would be expected of rain droplets which can be 10 or 100 times bigger.

The effectiveness of this process is heavily influenced by the droplet diameter. The droplet diameter reduction model adopted here (Diffusion model) (Eq.13) was compared to Kim et al. [19], with acceptable results (Fig. (2)). Kim et al. [16] is a comparison of three of these models. In the study, the longer evaporative time associated with the diffusion model is acknowledged. The differences between the models and a more thorough comparison can be found in ref. [16].
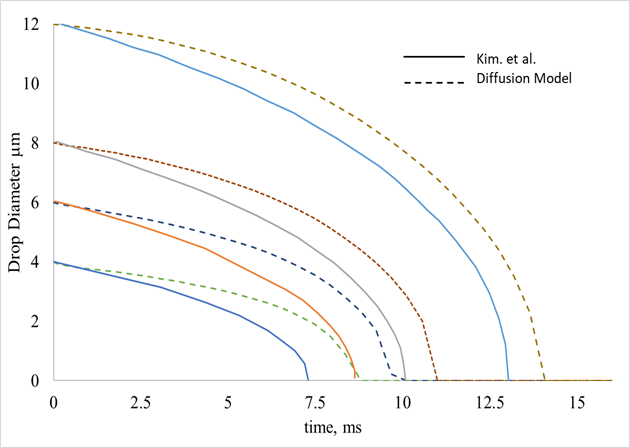
Figure 2 Influence of Droplet diameter with Evaporative time for initial droplet diameters of 12, 8, 6, and 4 micrometres, and comparison with Kim et al. [16].
From Fig. (2) It can be seen the strong effect that initial droplet diameter has on evaporative time and rate. As expected droplets with a larger diameter take longer to evaporate, but most interestingly is the change in slope of the curves as the diameter decreases. This change comes about as the surface area to volume ratio changes. Smaller droplets have a higher surface area to volume ratio, and thus are more effective at absorbing heat from the surrounding air than bigger droplets. This leads to the conclusion that the evaporative rate is not constant but is a function of droplet diameter and thus, time. For the same injection rate, smaller droplets will have a cooling effect mainly at the front stages of the compressor, while bigger droplets will have it at the rear.
For a given nozzle size, the droplet diameter is a function of water pressure [17]. This means that for a fixed water quantity, a user can decide where the cooling effect is desired, at the back or front stages of the compressor, just by controlling system pressure.
Figure (3) shows how droplet diameter might impact compressor exit temperature for a fixed injection ratio of 2 %.
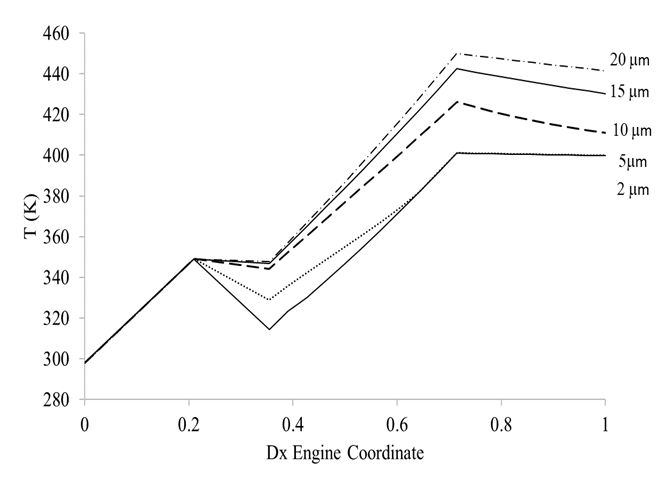
Figure 3 LPC Temperature change for the cases of dry compression, and wet compression at different initial droplet diameters.
It can be seen that the curves corresponding to droplet diameters of 2μm and 10 μm do not change their slope as seen for the 5 μm case. For the 2 μm case, the reason is that since the droplets are so small and the evaporative process is so efficient, all the water evaporates in the duct between the Fan and the LPC, and hence the slope of the temperature curve is almost the same as that seen for the dry case. For the 10 μm droplets, the mechanism is quite different. The bigger surface area to volume ratio of these droplets allows for a slower evaporation, which means the droplets will evaporate throughout the whole compression process. The intercooling effect last for longer and the slope of the curve will be less than for dry compression.
The final effect will heavily depend on compression rate, axial flow velocity and compressor length. Smaller droplets though have a higher intercooling effect as the mass of water (2% of the core airflow) is distributed into more droplets of smaller diameter, compared to the case of larger droplets.
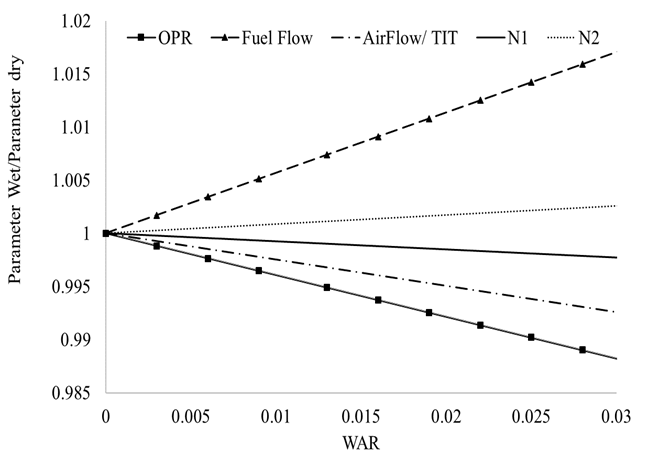
It has been mentioned that injecting water into a gas turbine will have two main effects: Reduce compressor operating temperature and increase the humidity of the working fluid. The effects of humidity have been studied since the 1950s and widely accepted methods to correct gas properties for humidity can be found in [25, 26]. For this analysis, a method similar to Fishbeyn [27] was adopted. According to Fishbeyn, the presence of humidity in the air will decrease the air flow rate, Turbine Inlet Temperature (TIT) and Overall Pressure Ratio (OPR), while it will increase Specific Fuel Consumption (SFC). This method was compared to Samuels and Gale [25] with good agreement. The effects of humidity were isolated to those from temperature by doing Gas Turbine performance simulations at a fixed ambient temperature but varying absolute humidity or water to air ratio (WAR) for a constant thrust case. The former was achieved using the in-house 0-D software for gas turbine performance, Turbomatch. This tool uses standard compressor and turbine maps to model the aero-components and takes as inputs the engine characteristics such as turbine inlet temperature, pressure ratios, efficiencies and by-pass ratios. More details on this tool can be obtained in [29,30].
The results can be found in Fig. (4). It can be seen that although humidity affects the engine’s performance parameters (this engine is a two-spool turbofan, with a by-pass ratio of 5), the impact is in the order of 1-2 % depending on the parameter and the Water to Air Ratio.
The effects of decrease LPC exit temperature can also be plotted against injection ratio. Notice that in this case, water injection ratio is not the same as WAR or absolute humidity. The cases analysed for a 25 % relative humidity assume that when the injection rate is 0, the air still has water vapour since the ambient relative humidity is higher than 0 %.
Figure 5 represents the change of performance parameters with decreased temperature as an effect of different water injection ratios. It can be seen that the effect of temperature is a lot more pronounced than the effect of humidity. Properties vary in the range of 10- 15 % depending on the performance parameter and injection ratio. Daggett et al. [28], found similar changes in SFC and temperature reduction as those presented in this study. The performance parameters, again, were obtained by means of Turbomatch.
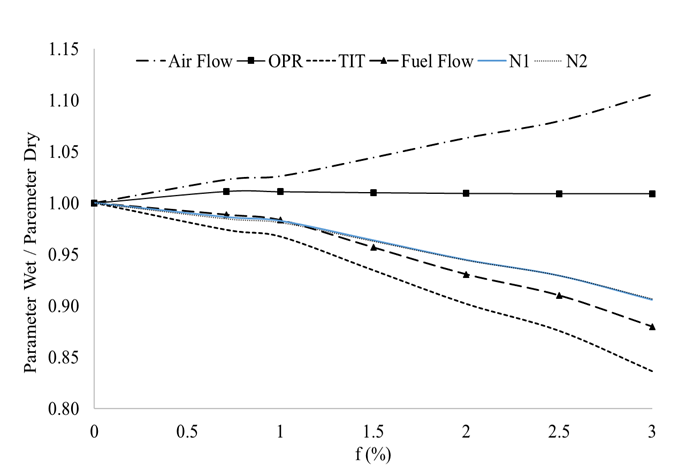
Figure 5 Effects of LPC exit temperature reduction as an effect of water injection for various levels of injection, f.
For example, injecting close to 2 % water to air ratio by mass will reduce the engine’s fuel flow in about 5 % as a consequence of reduced operating temperatures (and reduced compressor work), but the increase in humidity will affect this parameter by increasing its value by about 1 %. We can conclude thus, that the effects of temperature reduction due to water spraying are a lot higher than those seen by the gas property changes due to the increase in water vapour.
Estimation of NOx reduction due to Engine Water Injection
Preliminary design point performance calculations show that for the case studied here (298 K, 25 % RH atmospheric pressure and take-off), with an injection ratio of 2 % a reduction in NOx of around 45 % is achievable. This is done by analysing injection into a two spool turbofan engine with take-off rated thrust of 133.4 kN, and a By-Pass Ratio of 5, similar to what is found on the CFM56-5B engine. The results so far agree with previous studies where reductions in the order of 40 - 50 % were achieved for higher injection rates [31]. These higher reductions would come especially in situations where the ambient temperature is high and the relative humidity low.
The former is calculated by using the ICAO engine exhaust emissions data bank for the before mentioned engine [11] and correcting the published values for temperature and humidity. The correlation found to correct these values can be found in the NEPAIR report [32], and is regarded as an ICAO certified method for emissions corrections at different altitudes and ambient conditions (Appendix A).
According to Heathrow airport (London), the main sources of NOx emissions around this travel hub are: aircraft on the ground, airport-related road traffic, ground support equipment and boilers. Out of these sources, aircraft on the ground have the biggest contribution, accounting for 54 % of this emission. Moreover, aircraft ground movements can be classified into, taxiing, holding, APU use, landing roll and take-off roll. Take-off roll accounts for the highest NOx production, with a value of 46 % [33]. Considering these values, then if every aircraft departing from Heathrow was to be equipped with Water Injection, the overall London airport NOx emissions could be reduced by up to 12 %. This value might depend on environmental conditions (ambient temperature, and relative humidity) and is calculated assuming that water injection can reduce NOx emissions by up to 47 % as noticed by Daggett [13].
Concluding Remarks
The mechanism behind compressor air cooling through water injection has been explained. The influence of droplet diameter and quantity have been mentioned. It is proven that injecting atomized water into a gas turbine has the effect of reducing compressor delivery temperature (~10%), therefore reducing the overall cycle’s operating temperature. This reduction in temperature is proven to lead to a decrement in the production of NOx emissions. For the case of Heathrow Airport, these reductions could be as high as 12 % of the overall NOx production.
Future studies of this research involve a more comprehensive model that can calculate NOx emission reductions for different engine operating conditions (off-design cases), ambient temperatures, injection ratios and droplet diameters. In addition to this, efforts are being made to evaluate the impact that water injection can have on hot component life due to lower TIT. This translates into maintenance costs savings for airline operators.
Despite the negative effects that humidity can have on the gas properties, such as a small increase in SFC, it has been proven that the benefits of decreased temperature outweigh humidity effects, having as an overall outcome a fuel saving which can contribute to the reduction in other emissions such as CO2.
The model presents limitations such as the lack of ability to model the aerodynamic changes inside the compressor when water is injected. Also, droplet brake-up and blade impingement are not considered. The droplets are assumed to follow the flow path with no-slip velocity.
Nomenclature
| CAEP | Committee on Aviation Environmental Protection |
| CO2 | Carbon Dioxide |
| HPC | High-Pressure Compressor |
| HPR | High-Pressure Ratio |
| ICAO | International Civil Aviation Authority |
| LPC | Low-Pressure Compressor |
| LTO | Landing and Take-Off Cycle |
| NOx | Nitrogen Oxides |
| PR | Pressure Ratio |
| TIT | Turbine Inlet Temperature |
| ρ | Density (kg/m3) |
| η | Efficiency |
| γ | Specific heat ratio |
| φ | Relative humidity |
| A | Cross-sectional area (m2) |
| Cp | Specific Heat (J/kgK) |
| Dv | Mass diffusion coefficient (m2/s) |
| f | water injection rate (kgw/Kga) |
| h | Specific enthalpy (J/Kg) |
| H | Enthalpy (J) |
| kN | Kilo Newtons |
| L= hfg | Enthalpy of vaporization (J/kgK) |
| m | Mass flow rate (kg/s) |
| n | Number of droplets |
| Nu | Nusselt number |
| P | Total Pressure (Pa) |
| r | Radius (m) |
| R | Gas Constant (J/kgK) |
| Sh | Sherwood number |
| t | Time (s) |
| T | Total temperature (K) |
| w | Specific humidity |
| Subscripts | |
| 1 | inlet |
| 2 | outlet |
| a | Dry air |
| m | mixture |
| s | saturation |
| v | vapour |
| w/f | water |

