


 text new page (beta)
 English (pdf)
 Article in xml format
 Article references
 Send this article by e-mail
 Cited by SciELO
  Similars in
SciELO
Similars in
SciELO 
 Permalink
Introduction
Recent changes in the climate are noted for a high intensity and frequency (Shelffield and Wood 2011), as well as spatial and temporal heterogeneity. Specialists predict that climate change will multiply and amplify hazardous and extreme hydrometeorological phenomena causing emergencies and natural calamities (IPCC 2007, Heim 2015). In developing economies, weather hazards of hydrometeorological origin are fraught with catastrophic effects for agriculture and food security. Increased frequency and intensity of extreme climate events have serious implications for socio-economic security and human health (Sepannen et al. 2006). Since global climate change is an integral index of regional changes, identification of the climate change at the local and regional level is a pressing task. It is there, at local and regional scales, that specific measures are taken to mitigate and adapt to current climate change (Gbegbelegbe et al. 2014, Jahn 2015, Shannon and Motha 2015).
The World Meteorological Organization (WMO) declares the priority of studying climate extremes and taking actions to mitigate the impact of extreme weather events. Extreme weather events are more variable. That is why recent studies of weather and climate variation have increasingly used the derivatives of climate extreme indices (Karl et al. 1999). The Intergovernmental Panel on Climate Change (IPCC) has recommended using a set of indices for extreme climate events. The indices are calculated from preprocessed meteorological datasets (IPCC 2007, Peterson 2005).
The known complexities of big data processing and analysis are labor-intensity, occurrence of incomplete and inconsistent datasets, and computation errors (Hall et al. 2009). A possible solution is to create a software application that can quickly process daily temperature and precipitation data covering large time intervals. Some software products exist such as RClimDEX, ClimPACT or RclimTool (Zhang and Yang 2004, Alexander et al. 2013, Herrera 2014) written in the R language and designed for the computation of climate indices (Alexander et al. 2013, Herrera 2014). This article dwells upon the ICC (Indicators of Climate Change) software written in Java. The aim was to design and create a software that fulfills the following tasks for agriculture purposes: storage of meteorological datasets; calculation of climate change indices for various time series; calculation of indices for growing vines; analysis of climate change trends; analysis of deviations from the mean; analysis of climate anomalies.
Materials and methods
The ICC software was design conforms to the NMX-I-045-NYCE standard (SE 2005). The waterfall life cycle model was chosen. The programming language was Java, its benefits being operating system independence, high productivity, open source code. Eclipse was used as an integrated development environment for writing, testing and tuning modular cross-platform applications.
Other tools used were: a) Plugins generate the functionality permitting Eclipse to be optimized for the development of specific applications; b) Apache Derby is a 2 MB relational DBMS, owing to JDBC support Derby can be embedded in any Java-based solution. Derby DBMS is easy to install, deploy and use, supports the SQL syntax and the client-server mode; and c) Database managed by Derby DBMS was designed and developed to store information about meteorological datasets.
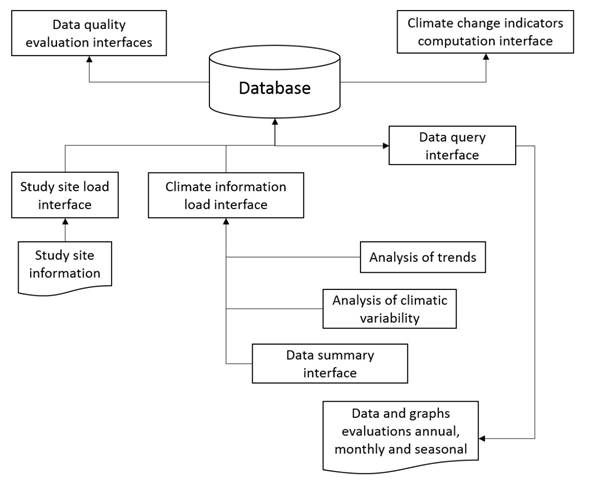
Equations for the calculation of indices, correlation and trend analysis were translated to algorithms for processing of the datasets stored in the DBMS. The results of calculations and analysis are visualized in table or graphics format through programming interfaces (Figure 1).
Minimum system requirements for ICC operation: 1GHz or higher Intel or AMD processor; 384 MB dedicated RAM; VGA display with 1200x800 resolution and 32 MB video memory; Java virtual machine (JVM) 1.8; for Windows OS - Windows Vista, 7, 8, 10; any versions of Linux and Mac OS supporting JVM v. 1.8.
Results and discussion
ICC software is installed to the computer by the setup wizard (ICC.exe file) and the database and the system are located in a directory (C: ICC:). Once the installation is complete, a shortcut icon to ICC will be found on the desktop. ICC software can be run in English and Spanish, is user-friendly, providing a graphical environment consisting of a set of screens, pop-up tabs and icons. ICC main menu additionally offers a set of common tools such as Save, Copy Cut and Paste (Figure 2)

The ‘File’ menu provides information about the weather stations included in the ICC database in tabular form (Figure 3). Station search can be based on one or several fields of the table. There are options to enter data on a new station, as well as edit, duplicate or delete data of a selected station. For entering a new station, a window will be displayed requesting the input of general facts about the station (Reference, Name, Country, State, and Origin) and its geographical data (Latitude, Longitude, Altitude).

Activating the ‘Load’ menu one can capture data on mean, minimum and maximum temperature and precipitation at selected stations for a given time interval. Where some values are missing, the system will run an automatic recalculation from the average of the data from five days before and five days after the gap.
The ‘Review’ menu, allow open the window with daily temperature graphs for the chosen time interval and station, as well as export data in the form of tables or text (.xls and .txt formats) or graphs (.pdf, .svg, .png formats). The ‘Edit’ menu can be used to make any changes to the data on mean, minimum and maximum temperatures and precipitation. There is also an option to remove a selected range of data. The ‘Calculation’ menu contains the key functions of the software. The necessary calculations can be selected from the drop-down tab menu.
ICC performs calculations for 27 core climate indices defined by IPCC (Karl et al. 1999, Peterson 2005), and an additional index DC40 (Consecutive days greater than or equal to 40 °C) (Bautista et al. 2015). The ‘Calculation’ menu contains the ‘Climate change indicators’ submenu. Unlike others softwares, with ICC each index can be calculated for a year- or a month-long interval or for a specific season (Figure 4). Calculation results are displayed in tables, which can be saved in the database or exported as .xls or .txt files.

ICC software unlike others features the function of calculating agroclimatic indices for growing vines (Table 1) (Alexander et al. 2013, Herrera 2014). Four indices are used to analyze the potential of certain regions for growing vines (Winkler et al. 1974, Ortiz-Solorio 1987, Gladstones 2002, Snyder et al. 2005). The ‘Grape indices’ submenu of the ‘Calculation’ menu should be chosen for this purpose.
Table 1 Grape indices.
| Designation,units | Equation | Values | Origin |
|---|---|---|---|
| Growing degree days, °C |
|
Tm - average dailytemperature, °C | Winkler et al. (1974) |
| Frost-free period, days |
|
Tioa - average minimum temperature for the period from October to April, °C | Snyder et al. (2005) |
| Cold hours, hours |
|
Tm - average temperature for the period from November to February, °C | Ortiz-Solorio (1987) |
| Average maximum temperature, °C |
|
Tmax - average maximum temperature for the period from April to October, °C i and j - lower and upper analysis interval limit | Gladstones (2002) |
A climate diagram can display data on the minimum, maximum and mean temperature and precipitation for two times intervals to be compared within a single graph (Figure 5). So far, this function is only possible in ICC. The data can be exported in graphics, table or text formats.

ICC allows calculating climate change trends by analyzing time series, just as other software does, the difference lies in the use of climate change indicators instead of climate elements (Table 2) (Zhang and Yang 2004, Alexander et al. 2013, Herrera 2014). The tests used for this purpose are Mann-Kendall test, Sen’s test and Pearson correlation coefficient (Sen 1968, Kendall and Gibbson 1990). The degree of linear relationship between two variables is usually measured by the Pearson correlation coefficient. Correlation analysis can be used as a first approximation to detect changes in climate data and will work even for discrete data. The Mann-Kendall (MK) test is a non-parametric rank correlation coefficient. It is used to identify non-linear trends in ‘non-Gaussian’ data series sampled at equal time intervals (Kendall and Gibbson 1990). Where the MK test displays a monotonous trend which appears linear, Sen’s slope can be estimated to determine the trend in the dataset. These tests are robust against outliers, data gaps (lacunae) and non-normality.
Table 2 Comparison in the operation of the ICC software with other softwares.
| # | Functions | ICC | RClimTool | ClimPACT | RClimDex |
|---|---|---|---|---|---|
| 1 | Daily data analysis | Yes | Yes | Yes | Yes |
| 2 | Analysis of monthly data | Yes | No | No | No |
| 3 | Developed on R language | No | Yes | Yes | Yes |
| 4 | Developed on Java language | Yes | No | No | No |
| 5 | Data persistence (Database) | Yes | No | No | No |
| 6 | Analysis of data series | Yes | Yes | Yes | Yes |
| 7 | Calculation of climate change indicators annual | Yes | Yes | Yes | Yes |
| 8 | Calculation of climate change indicators by monthly, seasonal temporality | Yes | No | No | No |
| 9 | Climate diagram for one or two time periods | Yes | No | No | No |
| 10 | Review of temperatures graphically and tabularly | Yes | Yes | No | No |
| 11 | Interface to modify the captured data | Yes | No | No | No |
| 12 | Agroclimatic indices for the cultivation of the vine | Yes | No | No | No |
| 13 | Trend analysis with Mann-Kendall and Sen's | Yes | No | No | No |
| 14 | Summary of annual and monthly trends with Mann-Kendall and Sen's | Yes | No | No | No |
| 15 | Friendly interface | Yes | No | No | No |
| 16 | Export tabular data to *.xls, *.txt format | Yes | No | No | No |
| 17 | Export tabular data to *.csv format | No | Yes | Yes | Yes |
| 18 | Export of graphic data to *.pdf | Yes | Yes | Yes | Yes |
| 19 | Data capture based on a template | Yes | No | No | No |
| 20 | Analysis of data homogeneity (Maximum, average, minimum and precipitation temperature) | Yes | No | No | No |
| 21 | Analysis of homogeneity from other software (RHTest WMO) | No | Yes | Yes | Yes |
| 22 | Available in Spanish and English | Yes | No | No | No |
| 23 | Estimation of missing data | Yes | Yes | No | No |
| 24 | ENSO conditions (El Niño/Southern Oscillation) | No | Yes | No | No |
| 25 | BoxPlot graphs and histograms to represent time series | No | Yes | No | No |
| 26 | Data dispersion graphs (ICC also implements linear regression) | Yes | Yes | No | No |
| 27 | Analysis of anomalies and extreme annual and monthly events | Yes | No | No | No |
| 28 | Analysis of deviations from the mean in annual, monthly and seasonal temporality | Yes | No | No | No |
| 29 | Based on Microsoft Excel | No | No | No | Yes |
| 30 | Summary of daily to monthly climatic variables for Clic-MD® | Yes | No | No |
The ‘Trends overview’ menu is useful for saving analysis time. It enables viewing data tables with summaries of climate change trends and choosing the indicators and / or months with changing trends to plot graphs only where changing trends were identified. In this menu one can select a range of years or months within a year for the chosen weather station, group indices into temperature or precipitation categories and pick out the necessary ones, run calculations for the selected time ranges and indices, and remove the unnecessary data. The results can be exported as .xls or.txt files.
Only with the ICC software it is possible to plot the deviations to the average value of the indicators of climate change, this function is of great importance because it allows knowing the increases or decreases of each indicator of climate change over the years (Figure 6, Table 2). Graphs for climate indices can be plotted by opening the ‘Calculation’ menu, choosing the ‘Graphics of increases and decreases’ submenu and the item ‘Climate change indicators’ A new tab will open, where one can choose the weather station, time range and index, data visualization options and then export graphical files in .pdf, .svg, .png formats. By choosing the ‘Grape indices’ item in the ‘Graphics of increases and decreases’ submenu, one can plot vines growing indices using data from the chosen weather station.

Another exclusive function of the ICC software is the identification of the anomalous values in climate change indicators and in the elements of the climate (Table 2). The ‘Graphics of the annual / monthly normal distribution’ menu is used to identify climate anomalies. This is done by investigating the difference between the means over the chosen period and the reference period considered as normal (usually a period before 1990) (IPCC 2007). Very high or very low values with 0.01-0.05 probability of occurrence are deemed abnormal (Beniston 2008). They correspond to the extremes of the normal distribution curve. To plot annual or monthly normal distribution graphs open the ‘Calculations’ menu and proceed to the corresponding submenu. A new tab will open, where one chooses the weather station, first and second reference periods, index and month to be analyzed. The data can be edited and saved in .pdf, .svg, .png formats.
The ‘Data summary Clic-MD’ submenu is used to generate summary tables with data on mean, minimum and maximum temperatures and precipitation for each month over the given range of years for the chosen weather station. The contents of the tables can be exported as .xls and.txt files. The interface language (English or Spanish) can be chosen through the ‘Options’ menu. The ‘Help’ menu provides information about the software (name, version, description), copyright, information about the company and authors.
ICC software offers a set of tools for storing and processing large sets of daily weather data. The software permits the calculation and analysis of 27 climate change indices and four indices for growing vines. The data can be analyzed over monthly, seasonal and annual time intervals to identify trends and climate anomalies. Understanding of climate change can help work out more effective strategies for mitigating the effects of extreme events in agriculture and ecosystems in general.
In comparison with other softwares (RClimTool, RClimPACT and RClimDex), ICC is friendlier and contains more functions, besides functioning as a database (Table 2) (Zhang and Yang 2004, Alexander et al. 2013, Herrera 2014). With this new ICC software researchers and technicians have a tool to analyze millions of data in seconds in a friendly environment and easy to interpret. ICC software might help in the implementation of mitigation measures for climate change based on the data of each location.

