


 nova página do texto(beta)
 Inglês (pdf)
 Artigo em XML
 Referências do artigo
 Enviar este artigo por email
 Citado por SciELO
  Similares em
SciELO
Similares em
SciELO 
 Permalink
INTRODUCTION
A lactation curve starts at calving, and is a graphic representation of the relationship between daily milk yield and day of lactation (Papajcsik and Bodero 1988), and it can be useful in genetic breeding programs, herd nutritional management, decision making on the culling of cows, simulation of milk production systems and the calculation of emissions of greenhouse effect gasses. Brody et al. (1923) and Brody et al. (1924) were the first that attempted to represent mathematically the lactation curve. However, only after the development of the function of Wood (1967) the use of lactation curve functions became more frequent, in spite of it having major limitations like the poor fit around the peak and a large margin of error to estimate total milk yield (Cobby and Le Du 1978). On the other hand, it has the advantage of estimating three parameters closely related to the biology of lactation, and because of this, Wood's is the most widely used function to describe the lactation curve.
To overcome those shortcomings, many have developed lactation curve functions from mechanistic conceptions (Dijkstra et al. 1997, Pollott 2000) that attempts to provide an understanding of the factors controlling the variation in milk production throughout lactation, which most empirical models cannot give. Rook et al. (1993) proposed twelve multiplicative mechanistic functions to describe the lactation curve that were the product of a scale parameter, a positive monotonically increasing function and a positive monotonically decreasing function. Dijkstra et al. (1997) developed a mechanistic model to describe proliferation and death of mammary gland cells during pregnancy and lactation. Pollot (1999) proposed a mechanistic model in which daily milk yield is the difference of two logistic functions, one describing the increase in secretory cell numbers, the other describing their later decline. This research aim was to find a nonlinear function that best fitted the lactation data of grazing F1 Holstein-Zebu cows in the Mexican humid tropics.
MATERIALS AND METHODS
Site of study
Milk yield data were generated at the Centro de Enseñanza, Investigación y Extensión en Ganadería Tropical, Facultad de Medicina Veterinaria y Zootecnia, Universidad Nacional Autónoma de México. The climate is hot and humid with a mean temperature of 23.5 °C and 1991 mm of annual rainfall. Altitude varies from 108 to 123 meters above sea level, and its geographic coordinates are 20o 01' 50” Northern-latitude and 97o 06’ 11" Western-longitude. Mixed-grasses pastures are composed mainly of native grasses (Paspalum spp, Axonopus spp), and introduced ones like African Stargrass (Cynodon nlemfuensis) and grasses from the Brachiaria genus.
Cow management
Milk yield per cow was recorded daily, after milking once a day in the morning between 8:00 and 10:30 h. Cows received 1 kg of concentrate (88% DM) with 16% CP and 2.8 Meal EM/kg DM at milking time. After milking cows grazed the aforementioned pastures. Rotational grazing had variable times of grazing (1 to 3 d) and recovery (18 to 54 d) that depended on seasonal pasture growth. The stocking rate was 1.2 cows ha-1. Drying-off of cows occurred when their pregnancies reached seven months or their individual daily milk yield diminished to 2 and 3 kg. Right after birth, calves were separated from their dams and bottlefed whole milk up to weaning at 4 months of age.
Data base
Ninety-two lactations were recorded for the year 2006 and of those twenty-three were used for the present study, because they showed the typical shape of the lactation curve. These lactations comprised 6835 ‘x-y’ pairs of data, and had the following descriptive statistics (mean ± standard deviation): 85 ± 47 months of age at last calving; 5 ± 4 parturitions; 310 ± 107 days in milk; and 2528 ± 1096 kg of milk per lactation.
Least squares means for daily milk yield
In order to estimate daily milk yield means unaffected by the different number of observations available per day in milk, the following lactation days were chosen: 1, 7, 14, and so on every seven days until 301, and day 305. Then per each day of lactation a least squares mean and its standard error was generated by an analysis of variance with the model: y ij = μ + D j + ε ij , where: y ij is the milk yield of the i-th cow (i = 1 - 23) on the j-th day of lactation (j = 1, 7, 14, ... 301, 305), μ is the overall mean, D j is the effect of the lactation day and ε ij is the error. The cow (subject) and day (repeated measurement) were respectively random and fixed effects. The covariance structures: ante-dependent, autoregressive, autoregressive-heterogeneous variance, compound symmetry, compound symmetry-heterogeneous variance and Toeplitz were tested, and based on its lowest AIC c value, the most appropriate was Toeplitz. The final SAS code used was as follows: PROC MIXED; CLASS COW TIME; MODEL MLKDY = DAY/DDFM = KR; REPEATED DAY/SUBJECT = COW TYPE = TOEP; LSMEANS DAY; RUN; (SAS 2010). The tested covariance structures AIC c values and least squares means and their standard errors from this analysis are not presented, but are available on request.
Functions for the lactation curve
Table 1 presents the functions used to describe the lactation curve. In all cases, 'y' is the least squares mean for daily milk yield in kg/cow and ‘x’ is days in milk. Functions F01 to F12 were described by Rook et al. (1993) and their general form is y = Aϕ 1(x)ϕ 2(x), where: 'y' and 'x' were already defined; A, is a positive scalar in kg•cow-1•day-1; ϕ 1 is a positive monotonically increasing function with asymptote at ϕ 1 = 1, and ϕ 2 is a monotonically decreasing function with asymptote at ϕ 2 = 0 and initial value of one. Six nonlinear functions represented ϕ 1 namely, Mitscherlich, Michaelis-Menten, generalized saturation kinetics, logistic, Gompertz, and hyperbolic tangent, whilst two nonlinear functions represented ϕ 2 , namely, exponential and inverse linear. ϕ 1 and ϕ 2 gave in combination the twelve functions presented in Table 1. Functions F13 (Wood 1967) and F14 (Pollot 2000) were also fit to data as they represent the more used and the more biologically meaningful functions, respectively.
Table 1 Rook et al. (1993) functions (F01-F12) plus Wood (F13) and Pollot (F14) functions, used to describe the lactation curve of grazing F1 Holstein-Zebu dual-purpose cows in the humid tropics of the State of Veracruz, México.
Function fit and fit comparisons
Fit by least squares (Motulsky and Christopolous 2003), was performed by the Marquardt-Lavenberg iteration assuming that errors are normally distributed and thus, parameter estimation is similar to the use of the maximum likelihood principle (Silvert 1979). Commercial software (CurveExpert Professional v. 2.5.0. The mention of a trademark is not an endorsement by the authors or the National Autonomous University of México) was used to fit functions to the data. Fits were compared with the Akaike's information criterion corrected (AIC C ), calculatedas: AIC C = [N*(ln(SS/N))] + [2*K] + [2*K*(K+1)], where: N is the number of pairs of observations, ln is the natural logarithm, SS is the sum of squares of the vertical distances of the observed points and the fitted curve, and K is the number of model parameters plus one. The rule of thumb when comparing two functions is to choose the one with the smaller AIC C value. The probability of choosing between two functions the correct one, can be calculated as: p = e -0.5*ΔAICc /(1 + e (-0.5*ΔAICc) ), p = 0.05 being considered as enough evidence of a better fit, value that is reached when Δ AlC C (the absolute difference in AlCc values from both models) is equal or bigger than 5.89 (Motulsky and Christopolous 2003).
Lactation curve features
The days to peak daily milk yield were obtained by numerical methods. The persistence was considered the instantaneous slope of the curve half way between peak and end of lactation, which was obtained by differentiation for that particular day, thus, the more negative the slope, the less able is the cow to maintain yield. Total milk yield was obtained by integrating the function from day one to day 305.
RESULTS AND DISCUSSION
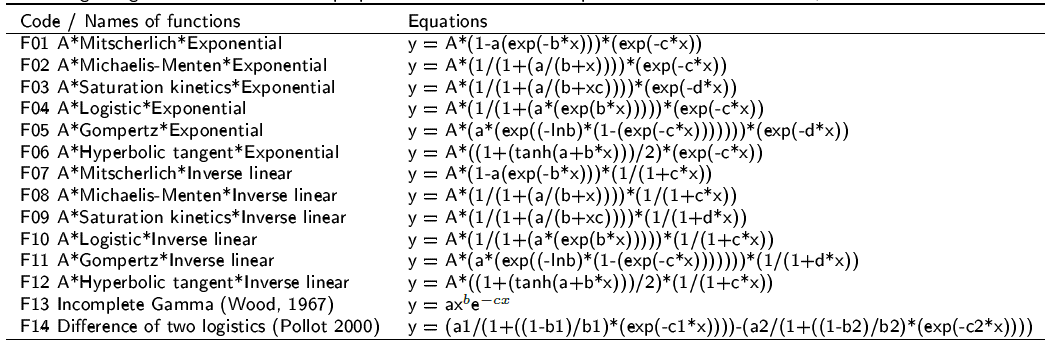
The function F14 (Pollot 2000) was the one with the best fit. The ΔAIC C between Pollot's and the second best function, F03, A*saturation kinetics*exponential, was 15.31, that led to a p = 4.735E-4, that is, the latter was less likely to have a better fit than the former. The remaining functions gave a lower fit than that of Pollot's, with even smaller p-values ranging from 1.485E-04 to 7.799E-19. The Wald-Wolfowitz runs test indicated that only the residuals from functions F03 and F14 showed a random distribution around the predicted line that indicated an appropriate description of the data, while the remaining ones did not (Figure 1). The number of iterations to converge varied from four in F13 (Wood 1967) to 74 in F03, while F14 required twelve iterations.
Figure 1 Plot of least squares means ± standard errors (dots and vertical bars), the fitted function (continuous line), and its residuals, from functions proposed by Rook et al (1993) with the larger (F03) and smaller (F08) fit, and the functions of Wood (1963; F13) and Pollot (2000; F14), used to describe the lactation curves of grazing F1 Holstein - Zebu dual-purpose cows in the humid tropics of Mexico.
Table 2 shows that the days to peak were shorter than are those expected for temperate milking breeds, ranging from 4 to 37 d. On the other hand, peak daily milk yield per cow varied from 11.91 to 12.62. The half way between peak and 305 days went from 134.0 days in F10 to 150.5 days in F05, and the slopes varied from -0.0308 in F05 to -0.0423 kg cow-1day-1day-1 in F10 and F12. The predicted milk yield per 305-day lactation ranged from 2423.3 kg cow-1 in F04 to 2443.3 kg cow-1 in F08. Pollot's function predicted a peak of 12.33 kg cow-1 day-1 reached at 21 days of lactation. The slope was - 0.0347 kg cow-1 day-1 d-1 at 142 days after peak (163 d after parturition) and a predicted milk yield of 2428.8 kg cow-1.
Table 2 Lactation curve features calculated from the fitted functions.
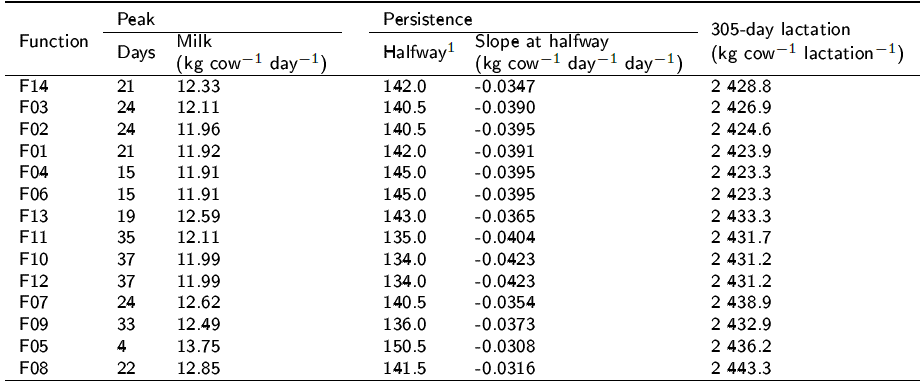
1 Halfway is half the days between 305 days minus days to peak.
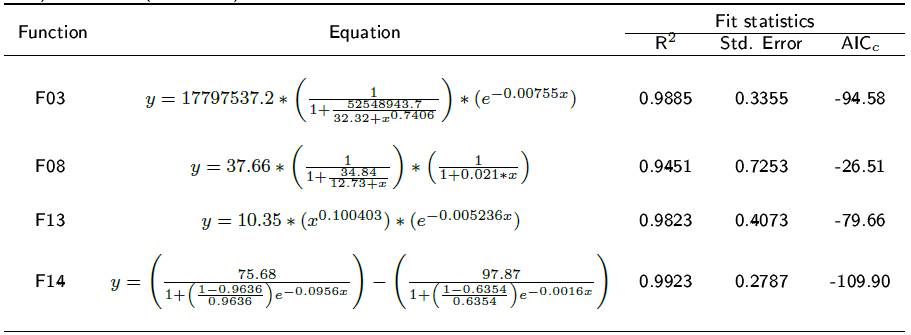
Figure 1 presents the plots of the fitted line and residuals as well as the fit statistics for functions F03 and F08, the ones proposed by Rook et al (1993) that had the highest and lowest fit, respectively, and F13 (Wood 1963) and F14 (Pollot, 2000), considered the more used and the more biologically explicit, respectively. Only Pollot's function did not over or under estimate data, showing a random distribution of residuals. Pollot's function had 'al' and 'a2' values within the biologically possible, but the 'A' scalar (in kg cow-1 d-1) of function F03 did not, and the same happened with its 'a' parameter, extremely large values in either case (Table 3). This in fact supported the decision to prefer Pollot's function over the remaining ones.
Table 3 Parameter values the functions proposed by Rook et al (1993) with the best (F03, A*Saturation kinetics*Exponential) and worst (F08, A*Michaelis-Menten*Inverse linear) fit, and the functions of Pollot (2000; F14) and Wood (1963; F13).
Models are fit to data for prediction, in which case a high fit is desirable, and to quantitatively explain the processes that trigger and maintain a biological or physical mechanism. In the case of the lactation curve one cannot have one without the other, as necessary it is to get a good fit as well as it is also necessary to explain the biological processes that generate and keep milk flow. Then, if the parameters of a particular model do not have a physiological meaning, no matter how high the fit, their interest is doubtful.
The biology of the commonly peaked lactation curves has been the subject of study from the early twenties of the preceding century. Brody et al. (1924) thought of milk secretion after calving as the result of the development and decline in number and vigor of the milk secreting cells. First, cells increase in number, vigor or both according to the function y = ae-c1x, and then they decrease according to the equation y = be-c2x, resulting in a change in number and vigor of udder cells, and thus milk flow described by the difference of both functions, y = (ae-c1x) - (be-c2x). They explained that it seemed quite reasonable to consider the process of rise and decline of milk secretion with the advance of the stage of lactation as a species of growth and senescence possessing, however, with the unique property of being renewed with every gestation. One can only notice the similarities of the biological and mathematical concepts advanced by Brody et al. (1924) and those proposed later on by several researchers.
Wood (1977) proposed that the expression of the lactation curve was the product of cellular growth and death. Following the same rationale, Neal and Thornley (1983) proposed a mechanistic model based on the premise that the curve surged from the growth in number of differentiated secretory cells under hormonal control, and its death, modified by the effects of milk off-take. Nevertheless, the practical application of the model required data unavailable at farm level, such as milk secretion rate. The same explanation served as a basis for Rook et al. (1993) to propose their multiplicative and mechanistic functions, tested in the present research.
Knight and Wilde (1993), Wilde et al. (1997) and Knight et al. (1998) showed that the number of secretory cells present at any given time is the net effect of proliferation and apoptosis. Early in lactation, the increase in milk production is largely due to the cell differentiation rate, and the decline in milk yield in later lactation is due to apoptosis rate. In either case, secretion rate, the amount of milk produced per secretory cell per day, can modify the shape of the curve. With this knowledge as a baseline, Pollot (2000) proposed the hypothesis that the three major processes involved, mammary parenchyma cell proliferation, their differentiation into cells showing secretory activity, and the reduction in their number due to apoptosis, all follow a logistic response with time. Then, so far, Pollot's function appears to be the more biologically explicit of all functions used to describe the lactation curve. In our case, it fitted data very well, with few of the actual points under or overestimated (Figure 1). Nevertheless, it also has some drawbacks. One is that it requires the fitting of many parameters and this causes problems of convergence on individual lactations. Val-Arreola et al. (2004) applied Pollot (2000) function to Mexican Holstein cattle and found that it was over parameterized. Because of this, and to facilitate fit, Pollot and Gootwine (2000) proposed a simpler two-parameter multiplicative function.
In the form of the logistic equation used by Pollot (2000), 'a1' represents the milk secretion potential of the whole udder and 'a2' is the loss in total milk secretion due to apoptosis; 'b1' and 'b2' are the proportion of 'a1' and 'a2' present at the start of lactation, respectively. 'b' is a shape parameter with a restriction 0 < b < 1, and as it approaches unity it produces an exponential relationship with an intercept very close to 'a'. On the other hand, as 'b' approaches zero, the curve becomes S-shaped with a lower asymptote value nears zero. The parameter 'c' is a rate parameter that determines how fast the upper asymptote is reached, and the higher its value the faster the predicted line approaches the upper asymptote. In our case, al was lower than a2, indicating a potential for production loss higher than the potential for milk secretion. Whether this characteristic is more affected by genetics than by environment remains to be studied in this type of tropical cattle.
The incomplete gamma function of Wood (1967) has been so far the most used in dual-purpose cattle in tropical México. Such is the case of investigations by Galaviz et al. (1998) with Brown Swiss cattle in a subtropical climate and Osorio-Arce and Segura-Correa (2005) and Vinay-Vadillo et al. (2012), with F1 Holstein - Zebu crosses in tropical climates. The fact that it has only three parameters to fit leads to a few iterations to converge. This constituted an advantage when the computational resources were limited, but not anymore, as there are several software programs available to solve nonlinear functions. In the present case, five out of the six functions (F03, F02, F01, F04 and F06) that had the exponential component for de decreasing part of lactation presented a better fit than the Wood function, and all of them could predict accurately the sharp peak and short time to reach it exhibited on the average by this type of cattle. The examination of residuals indicated a pattern of over-under-over estimation of the fitted line along the course of lactation, this in fact lead to Wood not being among the best-fitted functions. Furthermore, it implied that at calving milk yield was zero, which is not the actual case in practice. These are the two main drawbacks of this function. Although Wood (1967) function has been deemed as not being biologically meaningful, it shares with others the relevant components of potential yield or scalar ('a', increasing part (x b ) and decreasing part (e -cx ) of the lactation curve, the last two that can be related to cell growth and death (Wood 1977).
Rook et al. (1993) found that function F01 was better than F13 and other functions tested by them, and that the superiority of the former over those with a sigmoid function as the increasing part of the curve suggested that the growth in number of secretory cells was already in the decreasing phase. In the present case, the function chosen to describe the declining part of the curve was more important in determining fit than that used for the increasing part, as the inverse linear did not give as good a fit as that obtained with the exponential. In fact, the larger the AIC C value, the more pronounced overunder-overestimation pattern of function residuals were (Figure 1), with some even showing a marked conical pattern of residuals (data not shown). Furthermore, the fitted line of functions F11, F10, F12 and F09 exhibited an initial depression followed by the peak, something rather unusual and never found quoted in the literature, that did not happen with the fits of functions presented in Figure 1. Therefore, the exponential function should be preferred over the inverse linear to describe the decreasing part of the curve for this type of cattle.
The best function was the difference of two logistics so its use to continue the study of the lactation curve and factors affecting it in this particular herd, is recommendable. It not only provided a sound theoretical basis of the biology of lactation, but also an excellent fit to the data used in the present investigation. There is no doubt that secretory cell dynamics in the udder lead to the shape of the lactation curve, as cause and effect relationships have made clear by research throughout the years. At the same time analytical capability to data analysis has improved. Thus, the breaches between the statistical precision to describe the lactation curve and the biological processes that drive milk off-take have become narrower. In this sense, there is the need to in-depth studies on cell population changes at the udder level while at the same time describing the physiological mechanisms that trigger those changes.

