


 nueva página del texto (beta)
 Inglés (pdf)
 Artículo en XML
 Referencias del artículo
 Enviar artículo por email
 Citado por SciELO
  Similares en
SciELO
Similares en
SciELO 
 Permalink
Introduction
Analysis of agrifood systems must today address two methodological challenges. The first of these is the need to analyze an increasingly globalized system in which food products are subjected to an ever-increasing number and diversity of processes, blurring the link between agricultural produce and food products (Carolan, 2016; Holt and Shattuck, 2011; Nestle, 2013). A system in which the number of actors is growing (producers, manufacturers, retailers, consumers, politicians, scientists, etc.), as is the physical and cognitive distance between them (Torre and Rallet, 2005). There has also been a shift in decision-making centers towards big corporations (Goodman, 1999; Marsden, 2013; Rivera-Núñez et al., 2020; Thompson and Scoones, 2009).
The majority of food studies analyze the perspective of just one actor within the agrifood system from a specific dimension: (i) consumer preference, (ii) the structuring of the supply side of agrifood systems (Goodman, 1999; McMichael, 2013), or (iii) the cultural and symbolic characteristics of food (Amaya-Corchuelo et al., 2018; Amrein et al., 2017; Zampollo et al., 2012). They do not often consider the perception of other actors or include a multidimensional approach, but rather tend to use qualitative or quantitative uni-mode approaches (de Leeuw and Suzer-Gurtekin, 2018). As highlighted by Creswell and Clark (2017), the use of a mixed methodology allows for reaching a greater variety of population profiles and these authors also recommend its use when the research objectives seek this diversification.
This raises a methodological problem. How can we collect information on what people know and think about the agrifood system and food products if these have become the object of increasingly opaque, invisible, and abstract studies? How could a methodological process be planned? How can we encourage the actors’ participation? What kind of challenges will arise in each social context? Which relevant data from those obtained could be highlighted?
The second challenge relates to methodological design and the changes brought about in this field. Changes which arise as a result of the need to adapt to new contexts and to specific dynamics, as well as the need to integrate new technologies. The technological development experienced in recent years has allowed the computerization of interviews, a fact that facilitates and reduces the costs of collecting and processing information (de Leeuw and Suzer-Gurtekin, 2018). According to Díaz de Rada, Domínguez and Pasadas (2019), telephone (using both landline and mobile technology) and web-based surveys allow us to reach a larger part of the population and cover a much larger territory. Surveys conducted on digital platforms (e-mail, web, etc.) are the least refused types of survey, followed by telephone surveys (Guinalíu and Díaz de Rada, 2021). Computerized surveys also offer more sensitive and anonymous answers (Buelens and van den Brakel, 2015; Vaisey, 2014). However, these new techniques also bring issues that affect their feasibility: an increasing number of unsolicited phone calls and calls from unknown numbers lead to increased refusals; the growth of households with more than two phone lines affects equiprobability; or the development of mobile technology replacing landlines (Buellens et al., 2018; Fricker et al., 2005; Kuusela et al., 2007; Lavrakas, 2008; Tucker and Lepkowski, 2007).
The potential of new technologies depends on the degree to which such technology has been rolled out (Kozinets, 2015). Their use currently makes sense in Europe, Asia and North America, where more than 73% of the population has access to the Internet (Miniwatts Marketing Group, 2016). Such use will not be appropriate in other contexts where technology is not so widespread among the population. And this is so not only in specific countries but also in certain regions within countries where technology is less developed, for example in rural areas, where a large part of agrifood industries is located. As noted by Dillman, Smyth and Christian (2014), this implies a shift from a fixed design method to a tailormade one, which in turn implies that it is not possible to establish global strategies to encourage participation, but rather that each type of respondent requires different strategies depending on their particularities and the specific characteristics of the research.
All these factors have resulted in a gradual increase in data collection through the use of combined techniques. Creswell and Clark (2017), De Leeuw (2005) and Dillman et al. (2014) suggest the development of mixed methods since they allow the combination of diverse qualitative and quantitative techniques for gathering information, as well as the use of new information technologies. The application of a mixed method approach implies that data collection is carried out using a main technique complemented with a secondary one; it even makes it possible to combine a series of techniques at the same level of importance (Heyvaert et al., 2013). De Leeuw, (2005) suggests a set of strategies that can be used for research based on mixed methods. These strategies, which consist in combining different modes of data collection, are classified as follows: (i) one sample, one time period, and one questionnaire; (ii) one sample, one time period but different parts of the questionnaire; (iii) one sample and multiple time periods; (iv) different samples, different modes.
This article aims to explore the potential of mixed methods in a cross-cultural analysis of two agrifood systems. Firstly, the article explains the methodological process applied in the analysis of strategies that were developed by producers and manufacturers of Iberian ham in Spain, and of chorizo from the Toluca Valley (VT chorizo) in Mexico, in order to place their products on the market, as well as in the analysis of consumer perceptions regarding these food products and the strategies implemented by producers. Secondly, it analyzes how this method contributes to overcoming the challenges resulting from: (i) carrying out research based on a cross-cultural perspective of two significantly different geopolitical contexts; (ii) analyzing two different products, Iberian ham, and VT chorizo, by integrating the perceptions regarding the quality of these food products of the different actors in the agrifood system1; and (iii) carrying out a more in-depth analysis of results through the combination of a variety of technologies and the implementation of different research techniques.
METHODOLOGICAL DESIGN
The territorial extension (Spain and Mexico), the crosscultural perspective of two food products, and the diversity of actors involved in the study represented challenges that influenced the choice of methodological strategy to be used. This research utilized a mixed method study design, which Creswell and Clark (2017); De Leeuw (2005); Dillman et al. (2014) establish as a type of research where researchers combine qualitative and quantitative techniques for data collection. This strategy allows us to develop a cross-cultural analysis between two contexts that cannot be addressed by qualitative or quantitative methods alone. In terms of its mixed methodological strategy, this research is based on a type of mixed-mode approach highlighted by De Leeuw (2005). Data is collected through different samples, different time periods and diverse data gathering techniques that are adjusted to each context.
Different samples
The first task for the definition of the sample was to establish the geographical location of each agrifood system based on a review of documentary sources. In order to obtain the territorial delimitation for the VT chorizo agrifood system in Mexico, the work by (Fernández-Zarza et al., 2011) was taken as a reference as it describes the area where chorizo is produced and marketed in the Toluca Valley in Mexico. This area covers the municipalities located in the upper area of the Lerma river basin. In the case of Iberian ham in Spain, research started out using the work of Amaya-Corchuelo and Aguilar (2012); Millán et al. (2016), which marks out the area on the basis of territories linked to the four existing Protected Designation of Origin (PDO) areas for Iberian ham: PDO Dehesa de Extremadura, PDO Valle de los Pedroches, PDO Jamón de Jabugo and PDO Guijuelo. These areas are located within the Autonomous Communities of Andalusia, Castilla y León, Castilla-La Mancha, and Extremadura (MAGRAMA, 2014). Iberian ham is sold, and therefore also consumed, throughout Spain, which meant that the data collection strategy had to be national in scope.
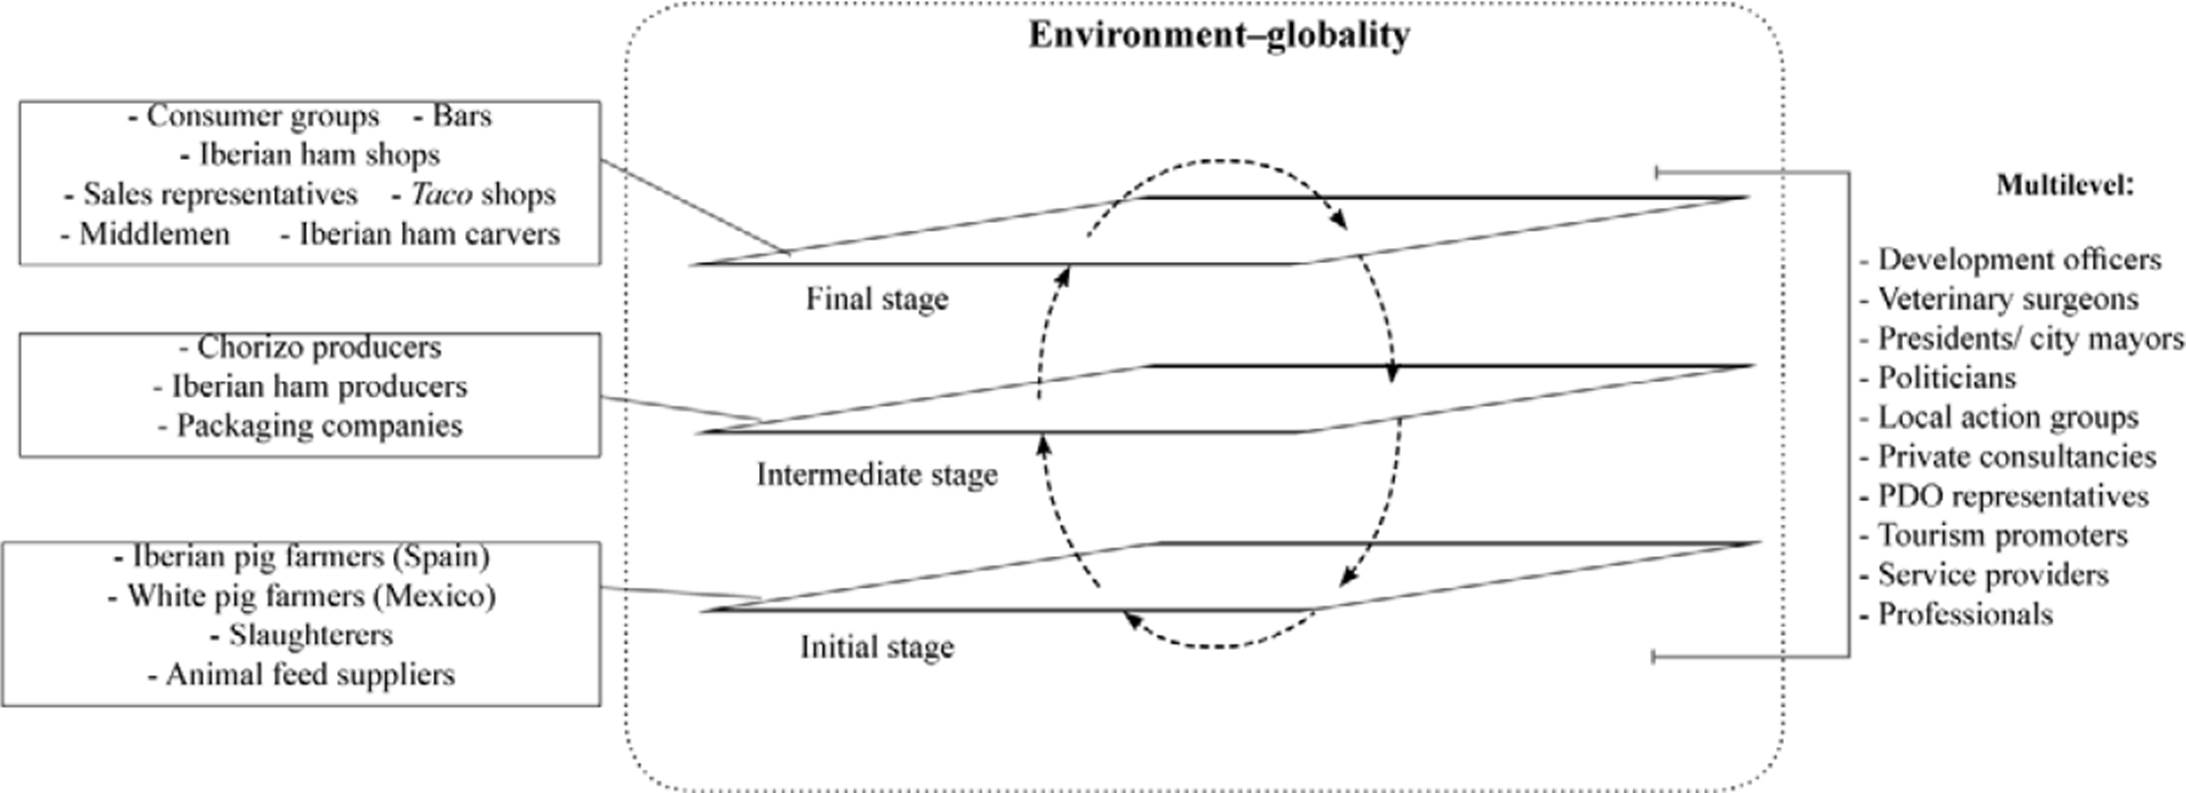
The second task consisted in categorizing the profile of actors involved in the production, distribution, marketing, and consumption processes for each food product. Based on the first fieldwork, participatory observation, and qualitative analyzes of all possible profiles, three main sample groups were established for each sociopolitical context (Figure 1): (i) chorizo producers and consumers in the case of Mexico, (ii) Iberian ham producers and consumers in Spain, and (iii) multilevel actors linked to each agrifood system.
Different modes for data collection
Data collection was carried out through a combination of qualitative and quantitative modes. The process flow and strategy followed during the research (Figure 2) were designed based on the proposals of Creswell and Clark (2017); De Leeuw (2005); Dillman et al. (2014) and enriched with the adaptation in an exploratory sequential design of the flow diagram suggested by Sinley and Albrecht (2016).
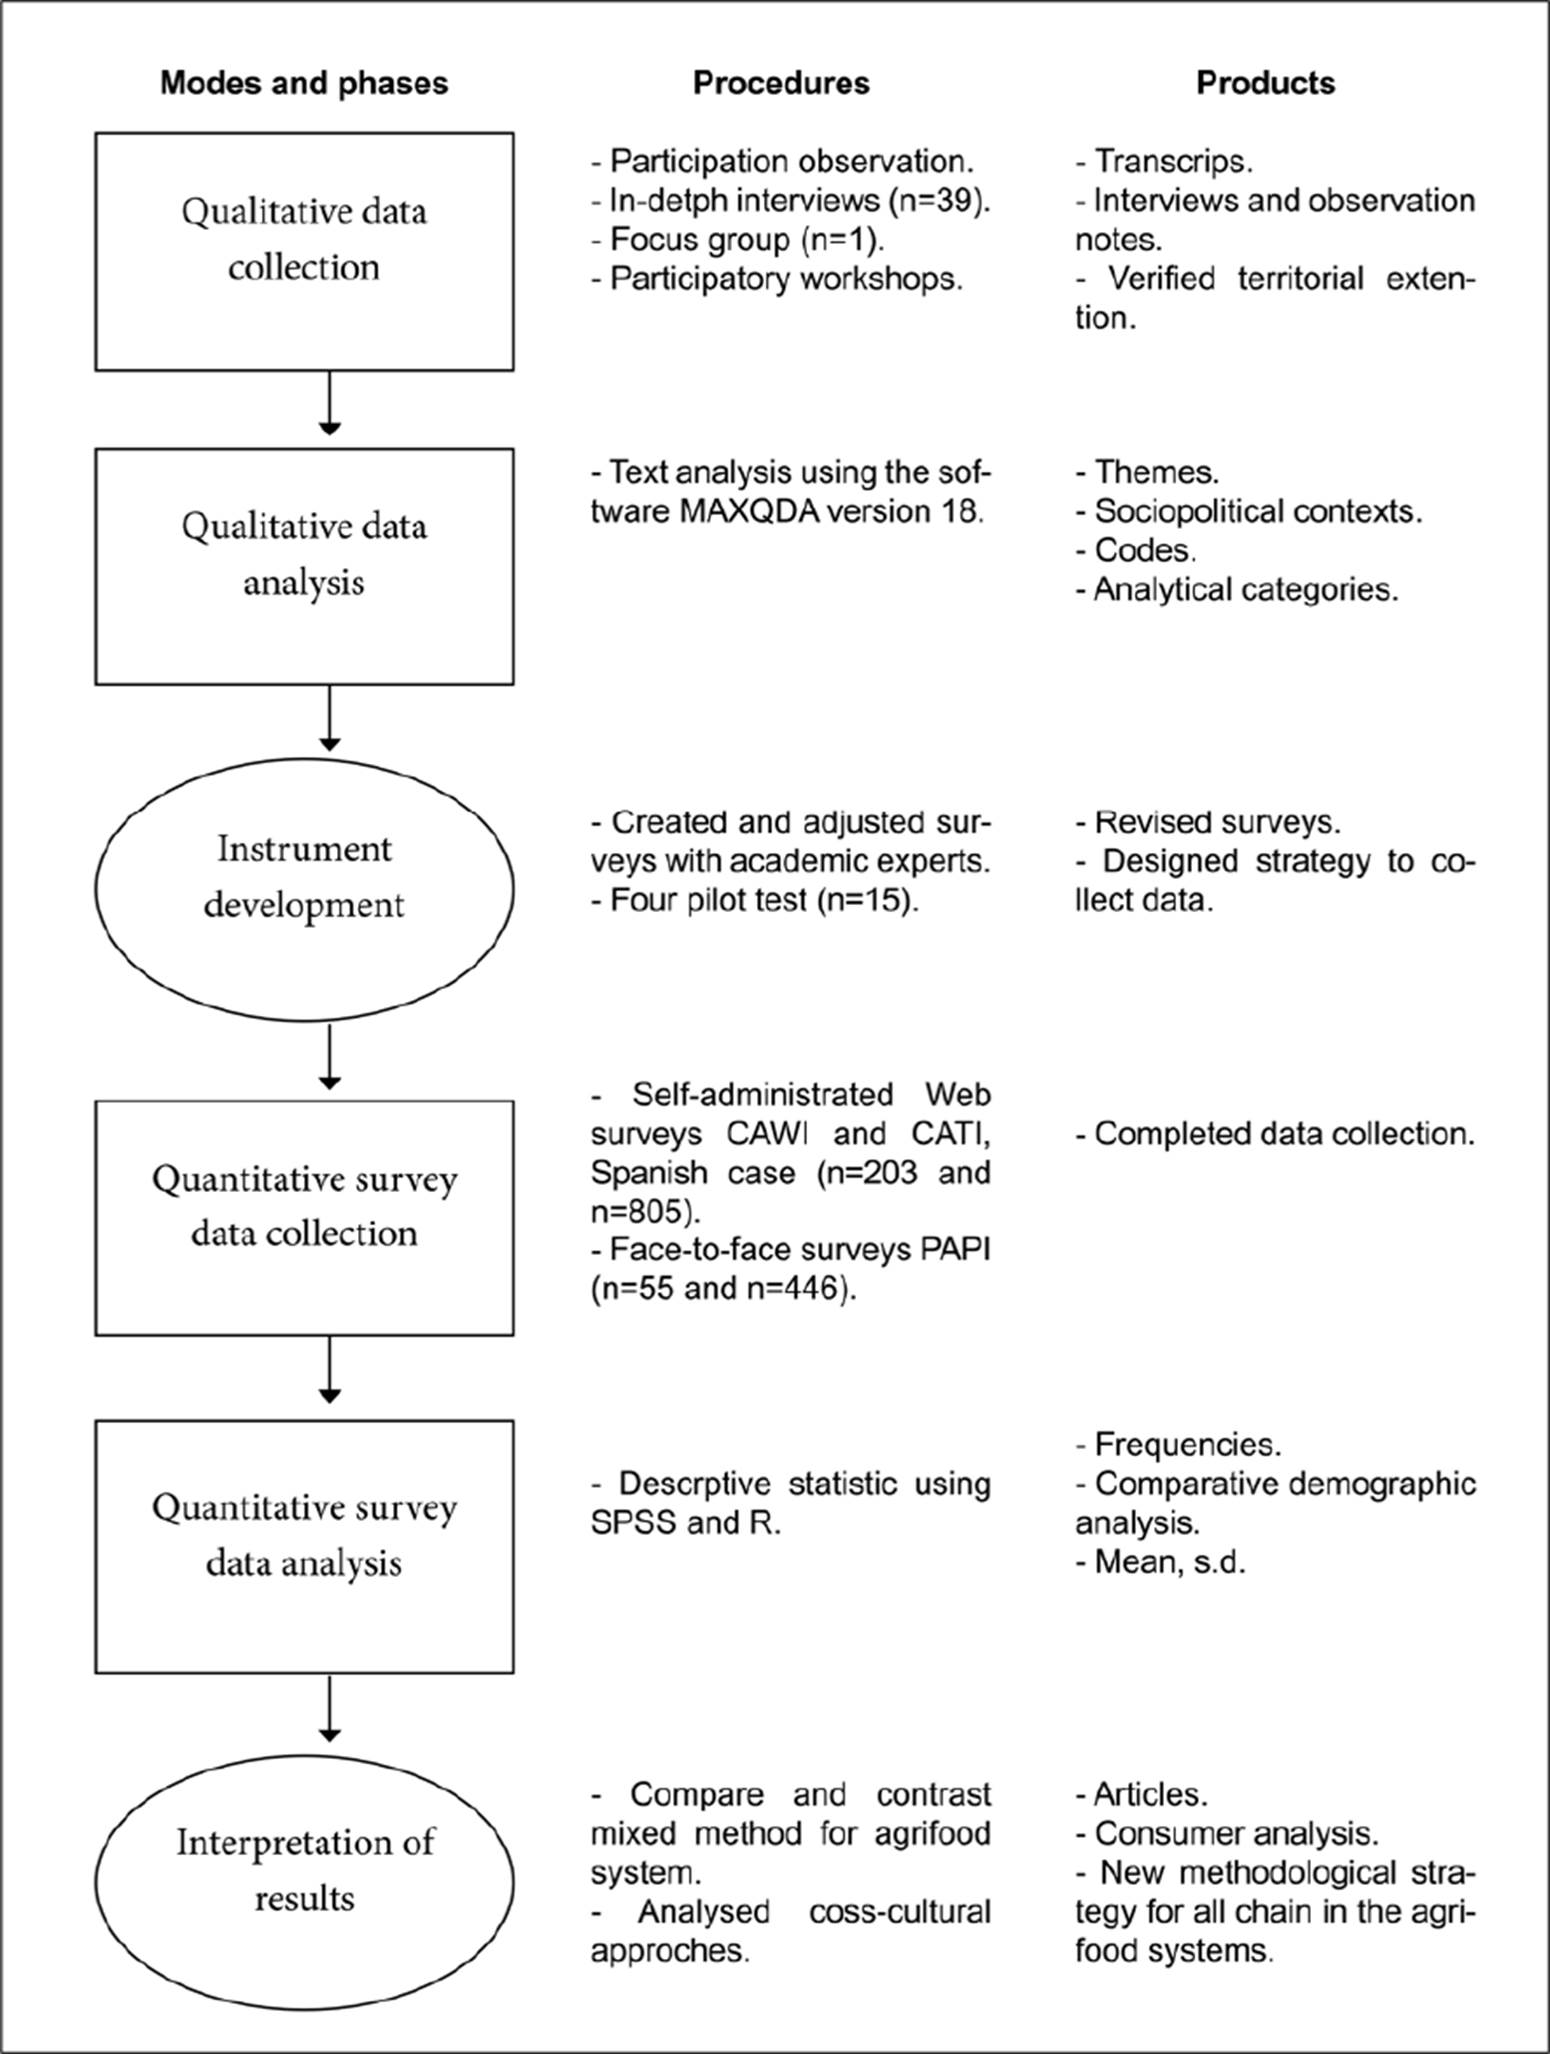
Source: Compiled from Sinley and Albrecht (2016).
Figure 2 Flow chart for the data collection strategy
Qualitative data collection and analysis
The qualitative mode was conducted by participant observation, the analysis of documentary sources, and the realization of in-depth interviews with key informants. A total of 39 semi-structured interviews (30 in Spain and 9 in Mexico) were carried out with farmers, producers, consumers, representatives of the four PDOs (Spain), political actors, tourism promoters, public institutions, and development officers. Furthermore, a discussion group is composed of seven officers directly involved in the implementation of rural public policies was held in Mexico, as well as five participatory workshops involving VT chorizo producers. The implementation of such techniques allowed for a deeper understanding of socioterritorial processes, cultural issues, and an analysis of the subjective experience of local actors (Harkness et al., 2006).
All qualitative information was recorded2 and subsequently transcribed. Information analysis was performed with the software MAXQDA version 18. For such analysis, the main codes were previously established and discussed under the grounded theory approach (Charmaz and Thornberg, 2021). The qualitative fieldwork allowed us to identify relevant categories used in the quantitative methodology. In addition, this strategy helped not only to verify the study area but also to contact other representative profiles.
Quantitative data collection and analysis
The quantitative mode was designed based on the data collected in the qualitative phase. In this approach, we focused on the study of producers and consumers (from both contexts). These two profiles are crucial to understanding the dynamics of both agrifood systems from marketing strategies to purchasing practices. In the case of Spain, two web-based questionnaires were employed, and, in the case of Mexico, paper-based instruments were used and applied face-to-face. We built surveys based on qualitative analyzes; information collected during in-depth interviews.
Each questionnaire was adapted to the characteristics of the relevant food product and production process, as well as to the specific language of the context being studied. In employing a transformative exploratory sequential instrument design (Sinley and Albrecht, 2016), each was tested through fifteen pilot projects conducted in Andalusia (Spain) from April to September 2015 and in Toluca (Mexico) in January and February 2016. These pilot tests verified the applicability of the variables used in the analysis, the wording and understanding of the questions by respondents, the response times, and the relevance of the variables used. Since the research was conducted in two specific contexts, the common blocks of questions in the surveys were designed to seek a related objective. The following table summarizes this information (Table 1).
Table 1 Blocks of analysis categories for producers and consumers in both agrifood systems
|
Producers Iberian ham and VT chorizo |
Consumers Iberian ham and VT chorizo |
|---|---|
|
Free word association Look into perception of ‘agrifood quality’ concept, tradition and first word in their mind for ham or chorizo. |
Free word association Look into perception of ‘agrifood quality’ concept, tradition and first word in their mind for ham or chorizo. |
|
General information of company / business Number of workers, annual turnover, products for sale, activities, etc. |
Screening question Important section for identifying consumers and non-consumers |
|
Trademarks and certifications Existence or absence, colours, symbols. |
Real purchase strategies How the product is really purchased. |
|
Marketing strategies Clients, channels, frequency, sales methods, new markets. |
Consumption habits Consumption methods, ways and habits for each product |
|
Sociodemographic information Age, position in company, level of studies |
Sociodemographic information Age, position, place of origin and residence, level of studies, gender, income. |
Source: Compiled from Fernández-Zarza et al. (2021).
For the first block of questions, the free word association technique was applied in order to trigger the subconscious mind of respondents (Rojas-Rivas et al., 2018), and obtain open answers that were not constrained by the questionnaire. Because in the qualitative phase we observed the complexity and discrepancy of three main words: (i) quality, (ii) tradition, and (iii) the product itself. The following sections of the quantitative questionnaires were prepared with multiple-choice questions through Likert-type scales from 1= Not at all to 5=Very Much. In some questions, besides the Likert-type scale and variables linked to quality classification, answers were ranked numerically, with 1 representing the lowest value. For qualitative multiple-choice questions, answers were randomized in order to avoid an acquiescence effect (De Leeuw, 2005; Jerolmack and Khan, 2014; Vicente et al., 2009).
Different times
The research was carried out from December 2014 to May 2018, and different timings were established according to the dynamics of each context (Table 2).
Table 2 Dates of qualitative and quantitative research
| Documentary research | December 2014-September 2015 |
| Pre-field | December 2014-March 2015 |
| Qualitative mode Spain | April 2015-December 2015 |
| Qualitative mode Mexico | January 2016-May 2016 |
| Quantitative mode manufacturers Spain | October 2015-December 2015 and February 2016- April 2016 |
| Quantitative mode manufacturers Mexico | February 2016-May 2016 |
| Quantitative mode consumers Spain | October 2015-December 2015 |
| Quantitative mode consumers Mexico | March 2016-May 2016 |
| Information analysis | October 2016-May 2018 |
Source: Author’s own elaboration.
Strategy
For carrying out the four surveys, an attempt was made to use new technologies as data collection tools by CATI (Computer Assisted Telephone Interviewing), CAWI (Computer Assisted Web Interviewing), CAPI (Computer Assisted Personal Interviewing), and face-to-face surveys by PAPI (Paper and Pencil Assisted Interviewing) (De Leeuw, 2005). This helped in reducing costs and covering a larger area (Abascal et al., 2012; Díaz de Rada and Domínguez, 2014). As suggested by Amrein et al. (2017), and with the aim of encouraging participation, one of the strategies employed was using scheduled reminders. Furthermore, Wolfson et al., (2017) have proven the importance of providing incentives for participation in quantitative studies. This strategy was used with Iberian ham producers, who were promised a report with the information obtained from the consumer study. A hamper was raffled among consumers participating in the survey, containing an Iberian ham from Extremadura, a 5-liter bottle of PDO olive oil, and an Idiazábal PDO cheese. In Mexico, we identified in the qualitative work the pride to be a chorizo producer and the need to be recognized. Chorizo producers were given an apron with the printed phrase: “Proud to be a producer of chorizo from the Toluca Valley”.
Ethics
Data collection was carried out in accordance with the Data Protection Laws of Spain (15/1999) and Mexico (DOF 05-07-2010), duly informing participants of their rights regarding data protection and the ethical regulation of information. In institutional letters, posted letters, and web pages, a confidentiality, and data protection section was included.
RESULTS
In both cases, it was so necessary to start the research with a qualitative phase, not only to build the quantitative instruments. But also, it let us know what kind of challenges exist and how can we solve them. In Mexico, the agrifood system being analyzed has been little explored, whilst in Spain, this is innovative research in terms of methods and contact strategies, bringing in a new way of researching reality which, in terms of its quality-cost ratio (human, financial), contributed to its efficiency. This research applies a data collection strategy approach using different samples and times and a mix of methodological techniques. This strategy closed existing gaps; however, the most enriching experience was blending a cross-cultural analysis of two contexts from totally different geographical locations. The timing in the implementation of techniques and data collection methods allowed for optimal representativity of the population profiles in both agrifood systems.
Challenges related to official information registered
In both cases, there were difficulties in defining the sample of producers and consumers to whom the survey was to be sent. In the survey for Iberian ham manufacturers, the target population was composed of producers and professionals engaged in Iberian ham transformation who are economically active. Existing data from the Spanish Ministry of Agriculture limited the producer population to western Andalusia, Extremadura, and the south of Castilla y León (MAGRAMA, 2014). However, Diez-Vial, (2011) located the cluster of Iberian ham producers within a territory which extended beyond the area contemplated by the Ministry. For that reason, it was decided to verify all existing official registers for every type of cured ham producer in Spain. This first frame was built from various business directories, but the main source of information comes from the General Sanitary Register of Food Businesses and Foods (RGSEAA), under the heading “Ham dry salting and drying” (RGSEAA, 2015)
A Data Base (DB) generated more than 1,600 registers. The discrimination criterion employed in this first list was the fact of producing Iberian Ham and/or Iberian acorn ham. This method allowed us to obtain an initial list of 682 manufacturers. To verify that these enterprises were active, we sent postal letters to all of them. This process allowed us to remove all inactive, untraceable, or dissolved enterprises, thanks to the return information contained on envelopes sent by postal mail. As a result, the final DB decreased from 682 to 565 registers, which corresponded to active Iberian ham producers. This strategy also enabled a first contact and introduction to the study.
Since the total N population (565) was a finite, nonlarge population, we decided to study all manufacturers. From the data registered in the first DB, it was observed that 416 (73.6%) of them had a website, while only 149 (26.4%) did not. In addition, 497 manufacturers (88%) provided an e-mail address, as opposed to 68 manufacturers (12%) who did not indicate any address. For these reasons, data collection was performed through CAWI, CATI, or a combination of both. Each manufacturer was contacted by telephone and e-mail for data verification. The survey was administered by a Web domain (tecudejamon.es), through which participants and survey respondents could enter and answer each question of the corresponding questionnaire.
A postal letter was sent with information and an introduction to the study; as well as an attached individual qr code and link containing a customized password with direct access to a web questionnaire. Up to four reminders were sent via e-mail to those organizations failing to access their individual link or qr codes, and whose questionnaire was not completed fully. Individual reminders via e-mail included direct access to the web questionnaire. We telephoned those producers who did not complete the survey in an effort to obtain a complete questionnaire.
The study was conducted in two time periods, the first from October to December 2015 and the second from March to May 2016. After implementing a range of strategies described in the next section, a final sample of 203 (35.6%) completed questionnaires were obtained; 20 processors filled in at least half of the questionnaire and 16 abandoned it after filling in half of it. The mean amount of time spent on the questionnaire was 22.2 minutes (s.d. ± 9.7), a maximum of 58.4 minutes, and a minimum of 9.3 minutes. Performing self-administered questionnaires favour the participation of respondents at free moments during working days, the maximum and minimum values confirmed this. The verification of this argument also is proven by participation of 148 (72.7%) answers by CAWI, as opposed to 43 (21.2%) by CATI, and 12 (6.1%) by CATI-CAWI. We also found that combined self-administered questionnaires are more affordable, easier to access, and strengthen data collection.
For the survey of VT chorizo producers, there were also important limitations in finding sources that could help in setting up a sample of producers. In Mexico, there is neither institutional support for this agrifood product nor official data on its production and marketing. This forced a change in the methodological strategy already designed for the ham survey since the research faced a context in which reliable data was scarce. The technique selected for establishing the sample was the snowball sampling method. Using the key informants interviewed during the exploratory phase of the research in 2011, a group of producers was contacted. This facilitated the preparation of a “map of actors” showing the location of the various VT chorizo producers throughout the area. In addition, this method helped to solve the big problem of mistrust of strangers due to the situation of insecurity Mexico is going through.
In the qualitative phase, we identified a total population of N 115 producers showing economic activity in 2016 and producing both types of chorizo: red and green. The study was applied to the whole population of producers since it was a finite population of manageable dimensions. Data gathering was carried out from February to April 2016 through an individual survey that was applied in situ, customized, and addressed to every manufacturer through the implementation of a PAPI questionnaire. The data gathering process was: (i) hand-delivery of a letter of introduction and printed questionnaire; (ii) in situ implementation of the questionnaire, or possibility for its later submission once completed; and (iii) subsequent collection of those questionnaires that was not completed in situ. Based on qualitative information, the questionnaire was designed to be completed individually or with the support of the interviewer, paying special attention to font size so that it could be easily read by older producers; efficiency of the instrument so that it could be used in the workplace avoiding loss of time; as well as clarity in the various analysis categories; all with the aim of avoiding non-participation or unanswered questions. The final sample result was 55 completed questionnaires, representing the participation of 47.82% of the target population.
Challenges related to digital context
As already discussed, new technologies and the possibility of combining techniques are one potential of mixed methods, especially when the goal of the methodological design is to optimize data gathering. One of the goals of this study was to know the advantages of conducting research through smartphones and web platforms. However, such potential depends on the degree to which technology use is spread. For example, in 2016, 76.9% of the population in Spain had Internet access, whereas in Mexico this figure was less than 50% of the population (Miniwatts Marketing Group, 2016). This research has not only faced challenges regarding access to new technologies and the degree to which they are used, but also other difficulties associated with such technologies.
The survey for Iberian ham consumers was designed to be answered through mobile phones, given their widespread use amongst the Spanish population: in 2015, 96.7% of the Spanish population used a mobile phone (INE, 2015). However, there were a series of issues linked to new technologies when defining the sample. There was no reliable mobile phone directory, as is the case for landlines (Vicente et al., 2009). Mobile phone numbers are made up of nine digits and, by law, the first two identify the provider company. Therefore, a list of random mobile phone numbers was generated from the information of the National Markets and Competition Commission (CNMC), which manages the assignment of numeral ranges to each telephone company, a first database was generated with a total of 7,233 mobile phone numbers.
To confirm that mobile phones were assigned and that they were operating, we sent an SMS (Short Message Service) containing an invitation to answer the survey. This was done during November and December 2015. SMS were sent over various days and at specific times to validate assigned numbers. From SMS that were sent, in 3,457 cases the delivery report was positive. The rest were classified as non-existent. Subsequently, telephone fieldwork started for mobile phone numbers with a positive delivery report. Once the mobile phone list was created and/or established, direct access to the web questionnaire (CAWI) was sent (estudiojamon.es).
The survey was individual, and addressed to every real or potential consumer, through a self-administered web questionnaire, with an invitation and automatic participation reminders. Data collection was performed through CAWI and CATI. Numbers that failed to reply on the Web were contacted via CATI. Thus, individuals were contacted by phone until obtaining the n-sample size. In the sampling process, an RDD technique was used (a technique for randomly dialling numbers out of all possible telephone ranges). This equates to the Simple Random Sampling Method on the sampling frame (Dillman and Christian, 2005).
Two sub-samples were created at the beginning of the study: one was n=400 real Spanish Iberian ham consumers and n=400 potential consumers. However, after conducting 200 surveys, a tendency of almost 60 (30%) of potential consumers was observed. We decided to change the strategy and establish a general sample of n=800 to avoid an increase in the cost. Attempts were made to encourage participation with an average of 2.51 redials to phone numbers. This shows how this means of data collection allows contacting various participants without having to visit them personally. The final sample consisted of 805 completed questionnaires and 45 incomplete questionnaires. Redial strategy allowed us to get a final sample of just 5.5% of incomplete questionnaires. The participation rate was 21.15% out of the eligible contacts of the frame who answered the survey via CATI. Additionally, in 90 cases (2.24%), the survey was conducted in a self-administered manner due to SMS sent with a customized link redirecting to the questionnaire’s web domain. The average length of the interview was 6.46 minutes (s.d. ± 3.3), with a maximum length of 19.6 minutes and a minimum of 1.3 minutes.
In Mexico, the use of new technologies for data collection was not feasible for either producers or consumers. Firstly, because, as already highlighted, there is a low percentage of the population with internet access. Secondly, because in Mexico many people deem the fact of receiving calls from an unknown number as an invasion of their privacy and, as a security measure, they do not answer to prevent them from becoming a victim of phone extortion.
Challenges related to working and setting times
Some obstacles were found while conducting the qualitative phase of survey for Iberian ham producers; they mainly related to working and setting times. During the first weeks of the survey, when the questionnaire was conducted via CAWI, we realized that 28 producers opened the questionnaire and stopped at the first question. To encourage participation, two strategies were implemented: (i) a general content description of the questions to be answered was added to the first page on the Web, thus questions could be visualized (only questions, not categories) prior to the start of participation. This allowed the respondent to have a previous idea of the survey length and to consider the time required to answer it; (ii) the Web description also highlighted that a consumer study was being carried out at the same time. Producers would have access to this consumer analysis if they took part in the present research by answering the questionnaire.
Although an increase in participation was achieved, with 64 questionnaires completed (CAWI), this produced a delay in the implementation of the survey, which ended up coinciding with that qualitative information reported as the most intensive work period for the Iberian ham sector (from December until early March). Consequently, implementation of the producer questionnaire was postponed until the montanera season was finished. In February 2016, the study restarted by sending postal letters again to those enterprises that hadn’t participated, in order to restore contact. Simultaneously, the first results of the consumer study were sent to producers along with the open, yet unfinished, questionnaire. Additionally, telephone calls to every manufacturer began to determine the reasons for their refusal to participate until that moment, as well as to offer the necessary help. These strategies aimed to encourage their participation. The challenges described above tested both the flexibility and the degree of openness of the project to accommodate decisive facts, such as the researchers’ capacity to implement solutions to avoid decreasing data quality. This process shows that people increasingly abstain from participating in surveys if they need to invest working time to do so.
Challenges related to marketing, selling and consumption processes
Red and green chorizo from the Toluca Valley is wellknown in Mexico and abroad. However, it is marketed and consumed mainly in the upper Lerma river basin (Fernández-Zarza et al., 2011). For the survey to consumers of VT chorizo, the target population consisted of real consumers of red and green chorizo from the Toluca Valley (persons aged 18 years or over). In order to define the real population, the starting point was a finite population and a total sample of n=384 consumers who had tried one or both types of chorizo at least once. This strategy helped to gather the minimum population mandated for the study of chorizo consumers in Mexico. There was a 5% error rate with a confidence level of 95%.
Before starting a data collection strategy, it was important to be aware of the fact that there are two types of consumption: (i) persons purchasing the raw product for cooking and consuming at home, and (ii) consumption of the product at the point of purchase, usually as tacos or tortas. Both consumption types must be considered in order to avoid bias in the final survey sample of VT chorizo consumers. Consequently, there were two types of businesses selling chorizo, and such businesses were scattered across the territory. It was therefore decided to carry out data collection by cluster sampling or, in other words, by dividing the territory into areas and points of sale.
The instrument used for data collection was different from the others since the goal was to adapt it to surrounding conditions: open spaces in a noisy environment where people are in a hurry and where, in most cases, there are no chairs or tables. This led to the design of a one-page questionnaire that included all question blocks. In addition, emoji cards were used to rank questions using the Likert scale, together with pictures of the actual product to assess preferences and in order to facilitate consumer responses. The survey for VT chorizo consumers was carried out on a personal basis, addressed and customized to every consumer not completing the information on the questionnaire through PAPI, and conducted from April to May 2016. The total number of surveys conducted was n=446.
Contrasting quality of the final samples
In the quantitative analysis, data collection was carried out mainly through probability and non-probability sampling in each local agrifood system, along with strategies to avoid certain population profiles being excluded from the survey sampling frame. As noted by Vicente et al. (2009), when analyzing the quality of the sample, the quality of data depends on various factors, one of the main ones being whether the sample is representative of the studied population. Thus, when comparing frequencies and general characteristics of the population for the Iberian ham system, such as the type of enterprise counties where production is located, and if they belong to a Protected Designation of Origin (Table 4), it can be concluded that they have a similar distribution not only for the type of enterprise, but also for the enterprises with or without a PDO. However, in the case of the Autonomous Community, there is an over representation of producers classified in the rest of Spain (-7%). There is also a slight refusal bias of producers from Salamanca (5.1%).
Table 3 Division, characteristics and number of surveys by sales clusters
| Cluster name | Place | Type of place | Completion date / periodicity | Number of Surveys |
|---|---|---|---|---|
| Tianguis (traditional markets) outside Toluca | Santiago Tianguistenco, Tenancingo, Tenango del Valle and San Mateo Atenco | Butchers’ shops in municipal markets and taco shops in tianguis | Every day of the week in markets. Tuesdays, Fridays, Saturdays and Sundays in tianguis. | 98 |
| Markets and tianguis in Toluca | Toluca | Butchers’ shops in municipal markets and taco shops in tianguis Palmillas | Every day of the week in markets and on Fridays. | 108 |
| Permanent establishments in Toluca | Toluca | Butchers’ shops and torterías (typical sandwich outlets) | Every day of the week. | 120 |
| Tourist areas | La Marquesa, Edomex. Tres Marias, Morelos. San Nicolas Coatepec, Tianguistenco. | Restaurants | Higher number of visitors on weekends and Bank holidays. | 120 |
Source: Author´s own elaboration.
Table 4 Characteristics for Iberian ham producers DB and survey
| Initial framework | Survey | Difference | |
|---|---|---|---|
| Total number [n (%)] | 565 (100) | 203 (100) | |
| Mean total workers (s.d.) | 18.58 (45.2) | 16.58 (37.5) | 2 (7.7) |
| Mean male (s.d.) | 13.5 (35.4) | 11.89 (28.8) | 1.61 (6.6) |
| Mean female (s.d.) | 5.1 (11.7) | 4.68 (10.6) | 0.42 (1.1) |
| Mean social capital* (s.d.) | 794,859.7 (3,832,569.9) | 553,928.1 (1,384,713.6) | 240,931.6 (2,448,856.3) |
| Median constitution year | 1995 | 1995 | |
| Type of Enterprise [n (%)] | |||
| Private Limited Company | 395 (69.9) | 135 (66.5) | 3.4 |
| Public Limited Company | 93 (16.5) | 36 (17.7) | -1.3 |
| Sole proprietorship | 51 (9) | 26 (12.8) | -3.8 |
| Joint property ownership | 12 (2.1) | 1 (0.5) | 1.6 |
| Cooperative society | 10 (1.8) | 5 (2.5) | -0.7 |
| Civil Society | 4 (0.7) | 0 (0) | 0.7 |
| Autonomous Community [n (%)] | |||
| Badajoz | 112 (19.8) | 46 (22.7) | -2.8 |
| Cáceres | 46 (8.1) | 15 (7.4) | 0.8 |
| Córdoba | 37 (6.5) | 12 (5.9) | 0.6 |
| Huelva | 77 (16.6) | 21 (10.3) | 3.3 |
| Salamanca | 221 (39.1) | 69 (34) | 5.1 |
| Rest of counties | 72 (12.7) | 40 (19.7) | -7 |
| PDO [n (%)] | |||
| Without PDO - Andalucía | 102 (18.1) | 37 (18.2) | -0.2 |
| Without PDO - Castilla y León | 179 (31.7) | 64 (31.5) | 0.2 |
| Without PDO - Extremadura | 96 (17) | 38 (18.7) | -1.7 |
| Without PDO - Others | 16 (2.8) | 3 (1.5) | 1.4 |
| PDO Guijuelo | 70 (12.4) | 25 (12.3) | 0.1 |
| PDO Extremadura | 62 (11) | 22 (10.8) | 0.1 |
| PDO Jabugo | 26 (4.6) | 9 (4.4) | 0.2 |
| PDO Los Pedroches | 14 (2.5) | 5 (2.5) | 0 |
Source: Author’s own elaboration.
*Note: Quantity expressed in millions of euro.
This is attributed to the fact that within this category of Salamanca, 43.2% of manufacturers refused to participate, 30% had a positive response, 19.1% were untraceable enterprises (they did not explicitly refuse participation), and 6.8% did not complete the questionnaire. Analysis of the noted frequencies leads to the conclusion that it is not necessary to weight the sample for the specific case of PDO since such quality certification is part of the primary objectives of this study.
The characteristics of the study samples for the chorizo agrifood system are presented in Table 4. In this case, the analysis of sample quality is also different from the Spanish case since, as previously mentioned, there is a prevailing lack of official data on the production of VT chorizo. It should be noted that this is an exploratory study that complements previous work. Thus, an analysis of the results shows that most producers have their economic activity registered as small taxpayers (38.2%), while failure to register with any governmental institution still prevails (23.6%). Likewise, the year 1982, as the average year when the business was established, coincides with the quality of information collected. During non-recorded interviews, respondents mentioned that around that year, chorizo sales were widespread along the principal road connecting Mexico City and Toluca. Other exploratory characteristics are given in Table 5.
Table 5 Characteristics for manufacturers of VT chorizo
| Survey | |
|---|---|
| Total [n (%)] | 55 (100) |
| Type of Enterprise [n (%)] | |
| General partnership | 1 (1.8) |
| Public Limited Company | 5 (9.1) |
| Small taxpayer | 21 (38.2) |
| Natural Person with Business | 2 (3.6) |
| Other | 10 (18.2) |
| Not officially registered | 13 (23.6) |
| Median years of foundation | 1982 |
| Huber’s mean years of experience*(s.d.) | 35.3 (22.2) |
| Mean total workers (s.d.) | |
| Mean total workers (s.d.) | 6.8 (8.6) |
| Mean male workers (s.d.) | 4.8 (6.1) |
| Mean female workers (s.d.) | 2.1 (3.5) |
| Huber's mean for total kg. chorizo by month*(s.d.) | 456.2 (444.8) |
| Huber's mean for total red chorizo* (s.d.) | 278.3 (237.2) |
| Huber's mean for total green chorizo* (s.d.) | 120.9 (88.9) |
Source: Author’s own elaboration.
*Note: For some cases, Huber average was used to improve the calculation given extreme values in the sample.
By analyzing the results for Iberian ham consumers, and when we compare sociodemographic relations concerning gender, small variations in the sample with respect to the total Spanish (2015) population are observed. Age represents a slight bias for people over 66 years (11.6), but this was anticipated due to previous studies in this agrifood system (ASICI, 2010). In fact, when the survey was begun, registering calls rejected by elderly people was contemplated, something which occurred on 79 (2.11%) occasions. As underlined by Abascal et al. (2012), in face-to-face interviews, the sample used had a higher number of people with low educational levels. On the other hand, samples for phone-based techniques may present different demographic characteristics that do not match the population in terms of age, educational level, professional status, and a number of people living in the household.
Comparing by Autonomous Community, it is corroborated that the sample truly reflects the population without having to weigh the sample (Table 6). However, the educational level presented a difference in the representativity in university studies (6.8). This could be due to three main reasons: (1) in the quarterly study regarding the Labour Force Survey in Spain (EPA, as per its Spanish acronym), which contains the most objective data, results are based on estimations and not real values; (2) the Labour Force Survey (EPA) contains group categories differing from those of the present study, with the age group starting at 16; and (3) the question regarding educational level was the last of the questionnaire, and more than 100 participants did not answer it. However, it can be concluded that for a perfect SRS (Simple Random Sample) sampling (100% coverage and 0% refusal rate), with n= 805 cases, for the assumed proportion estimation (p=q=50%), the maximum error for a confidence level of 95% would have been 3.46%. Therefore, it is concluded that they have the same distribution and that it is not necessary to weigh the sample.
Table 6 Characteristics for consumers of Iberian ham in Spain
| Initial framework | Survey | Difference | |
|---|---|---|---|
| Total number [n (%)] | 565 (100) | 203 (100) | |
| Mean total workers (s.d.) | 18.58 (45.2) | 16.58 (37.5) | 2 (7.7) |
| Mean male (s.d.) | 13.5 (35.4) | 11.89 (28.8) | 1.61 (6.6) |
| Mean female (s.d.) | 5.1 (11.7) | 4.68 (10.6) | 0.42 (1.1) |
| Mean social capital* (s.d.) | 794,859.7 (3,832,569.9) | 553,928.1 (1,384,713.6) | 240,931.6 (2,448,856.3) |
| Median constitution year | 1995 | 1995 | |
| Type of Enterprise [n (%)] | |||
| Private Limited Company | 395 (69.9) | 135 (66.5) | 3.4 |
| Public Limited Company | 93 (16.5) | 36 (17.7) | -1.3 |
| Sole proprietorship | 51 (9) | 26 (12.8) | -3.8 |
| Joint property ownership | 12 (2.1) | 1 (0.5) | 1.6 |
| Cooperative society | 10 (1.8) | 5 (2.5) | -0.7 |
| Civil Society | 4 (0.7) | 0 (0) | 0.7 |
| Autonomous Community [n (%)] | |||
| Badajoz | 112 (19.8) | 46 (22.7) | -2.8 |
| Cáceres | 46 (8.1) | 15 (7.4) | 0.8 |
| Córdoba | 37 (6.5) | 12 (5.9) | 0.6 |
| Huelva | 77 (16.6) | 21 (10.3) | 3.3 |
| Salamanca | 221 (39.1) | 69 (34) | 5.1 |
| Rest of counties | 72 (12.7) | 40 (19.7) | -7 |
| PDO [n (%)] | |||
| Without PDO - Andalucía | 102 (18.1) | 37 (18.2) | -0.2 |
| Without PDO - Castilla y León | 179 (31.7) | 64 (31.5) | 0.2 |
| Without PDO - Extremadura | 96 (17) | 38 (18.7) | -1.7 |
| Without PDO - Others | 16 (2.8) | 3 (1.5) | 1.4 |
| PDO Guijuelo | 70 (12.4) | 25 (12.3) | 0.1 |
| PDO Extremadura | 62 (11) | 22 (10.8) | 0.1 |
| PDO Jabugo | 26 (4.6) | 9 (4.4) | 0.2 |
| PDO Los Pedroches | 14 (2.5) | 5 (2.5) | 0 |
Source: Author’s own elaboration.
*Note: Numbers expressed in thousands of people.
In the specific case of chorizo consumers, a comparison between the sample and the general population is not carried out, given that the sampling was done by clusters and a proportional distribution was established for each of them, without considering initial sociodemographic numbers. Moreover, the purpose was to mark out a profile for the chorizo consumer - starting from scratch -, and therefore no population representativity was pursued.
The study on the consumption of VT chorizo was designed as an exploratory study. Therefore, comparing the analysis with official demographic sources is not feasible and its description is considered to be more enriching (Table 7). The sample consists of n=446 consumers, 215 (55.7%) men, and 171 (44.3%) women. The average age was 39 years old (s.d. ± 11.9). Participation was predominantly from persons with secondary education level 111 (25.6%) and university studies 110 (25.3%). Occupations most frequently found at chorizo points of sale were domestic workers 121 (27.3%), traders 96 (21.6%), and salaried employees 90 (20.3%).
Table 7 Characteristics of VT chorizo consumers in Mexico
| Survey | |
|---|---|
| Participants [n (%)] | 446 (100) |
| Sex [n (%)] | |
| Male | 215 (55.7) |
| Female | 171 (44.3) |
| Total | 386 (100) |
| Mean age (SD) | 39 (11.9) |
| Age groups [n (%)] | |
| 18-25 | 40 (10.4) |
| 26-35 | 130 (33.7) |
| 36-45 | 110 (28.5) |
| 46-55 | 59 (15.3) |
| 56-65 | 37 (9.6) |
| 66 y + | 10 (2.6) |
| Total | 386 (100) |
| Education [n (%)] | |
| No education | 5 (1.2) |
| Primary education | 61 (14.1) |
| Secondary education | 111 (25.6) |
| Higher secondary | 81 (18.7) |
| Technical degree | 54 (12.4) |
| University | 110 (25.3) |
| Postgraduate | 12 (2.8) |
| Total | 434 (100) |
| Employment [n (%)] | |
| Employed | 90 (20.3) |
| Student | 30 (6.8) |
| Trader | 96 (21.6) |
| Entrepreneur | 20 (4.5) |
| Professional | 52 (11.7) |
| Housewife/domestic worker | 121 (27.3) |
| Retiree | 4 (0.9) |
| Unemployed | 1 (0.2) |
| Taxi driver | 8 (1.8) |
| Farmer | 1 (0.2) |
| Artisan | 14 (3.2) |
| Civil servant | 7 (1.6) |
| Total | 444 (100) |
Source: Author’s elaboration.
DISCUSSION
This research confirms that data collected through mixed methods with different techniques, samples, and at different times, allowed us to perform cross-cultural research. The mix of techniques not only produced valid and quality data, but also allowed us to use effectively and efficiently all human, material, economic, and time resources. The combination of qualitative and quantitative modes has been crucial (Creswell and Clark, 2017). Participant observations and in-depth interviews provided departure data to establish analysis categories and investigate the profile of social actors. The analysis of the interface between social actors (Arce and Fisher, 2007), or the existing connection between stakeholders and institutions in the promotion of agrifood models (Goodman, 2002), have been useful for the understanding of dynamics, relationships, interactions, and the context in which the relationship between local and global is developed. This is due to the fact that, once words are transferred among the actors of an agrifood system, they are embraced and transformed into a common code that must be considered an essential research variable.
Participation in this study of a multidisciplinary group of researchers was crucial in the design and validation of the strategy to be followed, in the production of the survey documents, analysis of information, and data triangulation (de Leeuw and Suzer-Gurtekin, 2018). Obtained data not only allows the verification of raised research questions but also the knowledge concerning the context of analysis which will, later on, allow the design of quantitative methodological tools to be efficiently addressed. In research where the sampling frame concerns a country’s population or sampling for a specific territory, previous knowledge of the context of the study, as well as the selection of a technique whose previous design guarantees an absolute accuracy, are essential.
The implementation of new technologies while conducting the surveys has proved successful, particularly in Spain (Díaz de Rada y Méndez, 2021). Collecting data via mobile phone in Spain is currently not only viable but also recommended, provided that there is strict control of participation. Carrying out mobile phone-based surveys amongst Iberian ham consumers allowed for a combination of CAWI and CATI methods. This has provided proportional participation of the total population and lower costs in terms of time, economic and human resources; despite the difficulties in determining the sample of Iberian ham consumers due to the absence of reliable mobile phone directories. The combination of diverse technologies (Pcs, mobile phones, tablets, etc.) is also crucial for solving various challenges. We consider that every resource should be used to avoid a bias when the respondent is not speaking, not answering or not located.
This research has confirmed that people have increasingly less time for face-to-face or telephone surveys. Employing a self-administered survey enabled manufacturers to control the timing of their response and, if they were to forget about the study, reminders were subsequently sent, encouraging their participation. The combination of different means of contact and data collection tools improved participation because telephone contact favoured participation of those who were reluctant to use the Internet or a Smartphone. In addition, according to Díaz de Rada and Domínguez, (2014, 2015) y Vicente et al., (2009), the average length of the survey and the strategy of creating random answer categories enabled avoidance of a no answer or an acquiescence effect. This confirms that telephone samples offer significant advantages in comparison to in-person samples: ease of access to the target population, greater anonymity provides better quality responses, less interviewer influence, and increased respondent control capacity (Díaz de Rada, Domínguez and Pasadas, 2019)
In the case of the chorizo, prior qualitative work allowed research in a territory with high levels of violence, and where the population is wary of strangers. Nevertheless, interviews with key informants and participant observation were decisive in identifying the sample in both cases. This was even more important in Mexico since referring to a social agent who was known by most producers was crucial for confidence building and for a willingness to be interviewed. Institutional letters were an additional help for creating greater confidence. Existing violence in Mexico has been mentioned as a key constraint regarding the strategy to be followed in order to guarantee the safety of the researcher and establish trust during data collection. In Mexico, people are extremely wary of strangers and of unsolicited phone calls from an unknown number, due to the many incidents of threats and extortions occurring through such means (Gutiérrez-Romero, 2015; Martínez-Dávila and Bustillo-García, 2010). These circumstances limited the implementation of the strategy used in Spain and made it necessary to underline data confidentiality and the fact that data collected would be used exclusively for academic purposes.
Using this mixed methodology allowed researchers to solve specific problems related to each context. Using different collection strategies enriched the information obtained, as noted by Amaya-Corchuelo et al. (2018); Fernández-Zarza et al. (2018). Although different technologies were used, the design of a similar questionnaire - with interdependent questions and answers - enabled the cross-cultural research of two different food products and two different social and economic contexts and, more particularly, contributed to the analysis of the viewpoints of different actors within an agrifood system for a specific product and production process. Designing the research to involve different actors in the agrifood chain was crucial for obtaining different points of view on the same product. More so if we take into account that both agrifood systems are heterogeneous and each of them faces specific problems. In fact, the various actors seem to have an interest in learning the opinion of other actors in the chain. As mentioned, the response rate increased among Iberian ham producers when they were informed that a survey was also being carried out amongst consumers and that they would receive information on consumer demands if they participated.
The most recent contributions of our computerised world are online platforms, applications and consumer panels that facilitate electronic data collection by selfadministered instruments (De Leeuw, 2005; Dillman et al., 2014). However, these means often have a pre-established network of users, who are far from constituting a reflection of the characteristics required for the analysis of complete agrifood systems. Mixed methods present a comparative advantage due to the variety of techniques that can be used and because they offer greater strengths when analyzing a complex reality of this nature, which requires answers linked mainly to internal contexts. Applying a mixed method approach has allowed us to adapt the tools to each situation, to different time periods and to a diversity of techniques and technologies, much as indicated by Creswell and Clark (2014) and De Leeuw (2005). The methodological strategy applied during this study is a significant strength in a cross-cultural analysis of agrifood systems.
CONCLUSION
The implementation of mixed methods in the cross-cultural analysis of agrifood systems offers the possibility of going beyond the limited perspective of most research studies, which tend to focus on only one context, one food product, one of the actors in an agrifood system, or a single methodology. Throughout this article, the potential of this approach has been proven, since it allows the perspective of different actors within the agrifood system to be collected and analyzed, providing a comparison of the perspectives of producers and consumers around the same food product through the implementation of different methodologies. In conclusion, it can be affirmed that the data presented and analyzed here allow us to validate different alternatives for applying mixed methods research. These results will contribute to supporting other research that not only seeks to develop comparative research but also to ensure its statistical reliability. Because the strategies and mixed methods applied here to set the basis for future studies to be carried out in contexts with similar sociocultural characteristics.
This method offers multiple opportunities for analysis in the medium and long-term, since it is based on the use of new technologies and the numerous possibilities, they provide in terms of cost savings deriving from the ability to cover larger areas and a larger part of the population. It also helps to collect data regarding relatively unexplored dimensions, as reflected by the richness of data collected. For instance: tools for analyzing perceptions about the agrifood system; exploring the level of knowledge that different actors have on the many processes that food products are subjected to; studying how actors interact within the agrifood system; or evaluating the effect of strategies developed by producers on the practices and perceptions of consumers, and vice versa. Another advantage is obtaining objective views from actors on sensitive topics, such as the public policies that are applied, how certifications are regulated, alternative means for marketing products, or ways of obtaining a product at a lower cost, amongst other topics that cannot be observed by the researcher when using a single method.

