


 nueva página del texto (beta)
 Inglés (pdf)
 Artículo en XML
 Referencias del artículo
 Enviar artículo por email
 Citado por SciELO
  Similares en
SciELO
Similares en
SciELO 
 Permalink
1. INTRODUCTION
Concrete structures exposed to aggressive environments (urban, marine, industrial, or combinations of them) develop premature damage during their service life (< 10 years after being built and put into service). Typical deterioration manifestations are cracks and rust stains on the concrete´s surface and may reach even more marked deterioration process by the delamination of the concrete cover if the corrosion of reinforcement or prestressing steel is not stopped. This pathology is quite common today in concrete structures; it is usually because they are not designed with durability criteria, but instead on mechanical strength only. (Torres et. al., 2002; Torres and Castro, 2013; Calado et. al., 2015; Mendoza-Rangel et. al., 2016).
1.1. Durability design
Concrete durability is the concrete´s capability to sustain physical, chemical, biological and climatic effects as established by national and international regulations. The service life is defined as the period of time in which the structure is put into service until it needs to be repaired, rehabilitated, or reinforced, due to some type of damage that could cause aesthetic reduction or compromise the safety of its occupants (users). In this way, the fact that a structure has fulfilled its service life implies that its aesthetics or safety conditions must be restored through corrective maintenance, and not necessarily assume that the structure is about to collapse, as it is erroneously defined in certain instances. (Troconis et. al., 1997; Shi et. al., 2012; Mendoza-Rangel et. al., 2016).
A durable structure is one which service life can be longer than 50 years, and in countries where concrete technology has evolved rapidly, the design service lives could reach between 80 to 100 years. Using concrete´s material selection criteria based on ambient aggressiveness, the process of designing concrete structures with durability criteria begins. Once the selected materials that could be used for concrete manufacturing, the next step is the design of the same structure by mechanical loading strength. Knowing the cement type, the mineral additions that could be used in the design mix, the amount of the cementitious content, and the water/cement ratio (w/c), structural engineers could forecast the compressive strength of the designed mix. This could allow structures to protect their service lives for over 80 years, thus avoiding costly repairs during their service lifespan. Another alternative of durability design could be through durability indexes as it has been investigating recently. (Torres et. al., 2002; Helene et. al., 2003; Solís et. al., 2012; Mendes et. al., 2018).
1.2. Construction of durable concrete structures
In the supervision and quality control of durable concrete, the manufacture, transport, placement, consolidation and curing, dosing, and concrete cover compliance of the elements to be manufactured, should be closely monitored. In the case of the concrete’s manufacture and dosage for durable mixtures, it is the obligation of the contractor and/or external supervisor to extract concrete cores in strategic elements to determine that the concrete already placed and hardened, meets the performance requirements of the projected durability. By this methodology, the owner assures that the materials used in the contracted construction are indeed quite durable. This need to verify that the concrete placed in the structural elements complies with the performance requested in the design is due to the fact that: performing these tests in standardized cylinders, manufactured by laboratories or accredited specialists for their manufacture, could not reflect what is actually being placed in the different concrete elements of the work. (Helene et. al., 2003; Torres and Castro, 2018).
1.3. Durability index tests
Concrete durability performance has been evaluated from physical and mechanical laboratory tests. The most commonly used are: wet electrical resistivity (WER), ultrasonic pulse velocity (UPV), total void content (TVC), Effective Porosity (εeff), and compressive strength (CS). All experimental values obtained from these tests are commonly known as durability indexes (Table 1). Such tests are regularly performed either in a field laboratory, or in a quality control/quality assurance (QC/QA) laboratory from the supervision company. Also, correlations between indexes had been made considering CS, WER and Water Capillary Absorption test (WCA) (Medeiros-Junior et. al., 2019). The methodology followed to characterize the durability (or obtain the durability indexes) of concrete mixtures before and during the construction work use specimens from various dimensions and shapes. (Troconis et. al., 1997; Mejía et. al., 2018).
Table 1 Durability index levels (Troconis et. al., 1997)
| Durability Index Test |
Low performance | Intermediate performance |
High
performance |
|---|---|---|---|
| WER, kΩ-cm | < 10 | 10 - 50 | > 51 |
| UPV, km/s | < 2.9 | 3 - 4 | > 4.1 |
| TVC, % | > 15 | 10 - 15 | < 10 |
| εeff, % | > 10 | 5 - 10 | < 5 |
| CS; MPa | < 30 | 30 - 50 | > 51 |
The well-known thematic project DURAR (Troconis et. al., 1997) indicates the height of the specimens should be <50 mm in some tests but the contact area could be variable. Typically, such sampling, are either cubes or cylinders with side dimensions from five to 30 cm. For example, typical cube dimensions are of 5 x 5 cm, 10 x 10 cm, or 15 x 15 cm; typical cylinder dimensions are 5 x 10 cm, 10 x 20 cm, and 15 x 30 cm. These variable shapes and dimensions may vary the durability index results obtained if the performance test has restrictions on the specimen dimensions, as observed in the literature with some mechanical testing affected by the dimension of the specimen (Bazant and Planas, 1997; Bazant, 2000). This dimension effect on the materials mechanical performance is defined as the size effect law (SEL), in which materials such as concrete with aggregate sizes quite large in dimension, may produce different mechanical performance depending on the specimen size used for testing. Hence, the objective of this investigation is to present an experimental program in order to determine if the durability index tests (WER, UPV, TVC, εeff, and CS) are affected by the specimen shape and dimension.
2. EXPERIMENTAL PROCEDURE
2.1. Materials
In order to determine if the shape and dimensions of the specimens affect the durability indexes, the present investigation discard the possible effect on the size of the aggregate, thus mortar (cement, water, sand) instead of concrete (cement, water, sand, gravel) was used as the tested material.
The mortars were defined in accordance with the durability indexes: low, intermediate and high performance (called N2, N1 and MR, and SR in this investigation). These variations on the mortar’s mixture were considered to review if were also affected by the variables evaluated.
For the mortars N1 and N2 the cement used was the so called CPC cement (Mexican name for Type I Portland cement with some unknown fillers to decrease the Clinker content; no specifications of the cement were provided by the manufacturer) according to NMX-C-414-ONNCCE-1999. The sand used was silica from a mine bank, mesh size number 89, as per ASTM C33 - 2003. The cement:sand proportions by weight used to fabricate the tested mortars was 1:2.75. The mixture proportions of the mortar mixtures used are described in Table 2.
Table 2 Mixture proportion of low (N2) and intermediate (N1) performance mortars
| Material | N2 [l / m3] | N1 [l / m3] |
|---|---|---|
| Cement | 128.04 | 186.24 |
| Water | 322.67 | 322.67 |
| Sand | 549.29 | 491.09 |
For mortars MR and SR were used two commercial trademarks, and were provided with certain dosage protected, thus no detailed information was obtained from the manufacturers.
The information from the MR mortar was that contains propylene fibers, but the manufacturer did not provide information on the fiber size nor the content. The MR mortar fabrication was performed following the manufacturer’s specifications written on the product´s bag: 190 ml of water per kilogram of product, providing 9.5 l of water per 50 kg bag. Both, dry product and water were prepared in a mortar mixer, waiting until the mixture was fully homogenized before placing it into a 5 x 5 cm cube or 5 x 10 or 10 x 20 cm cylinder molds. The physical properties of the product obtained by the manufacturer are listed in Table 3.
Table 3 Physical characteristics for MR mortar provided by manufacturer
| Physical characteristic | Description | Description |
|---|---|---|
| Dry volumetric mass | 1,413 kg / m3 | - |
| Hardened volumetric mass |
1,690 kg / m3 | - |
| Compressive strength | 16.0-18.0 MPa at 1 day | 35.0-45.0 MPa at 28 days |
| Flexure strength | 9.5-9.7 MPa at 1 day | 11.0-12.0 MPa at 28 days |
| Tensile strength | 3.2-4.0 MPa at 1 day | 40.0-46.0 MPa at 28 days |
The information provided for SR mortar was: CPC cement (without concentration defined), marble quarry sand, low water-to-cement (w/c) ratio (< 0.35), 3rd generation water reducer based on polycarboxilates (powder presentation integrated in the dry mixture). The product arrived in closed plastic buckets (20 l) and only tap water needed to be added in a mortar mixer (not allowed to be mix by hand, based on manufacturer recommendations).
2.2. Specimen dimensions
For this investigation, three dimensions were selected for mortar specimens: 5 x 5 cm cubes (cube), 5 x 10 cm cylinders (Cyl-5), and 10 x 20 cm cylinders (Cyl-10). For N1 and N2 mortars, the mixtures were prepared in order to obtain 15 cubes, four 5 x 10 cm cylinders (small), and nine 10 x 20 cm (large) cylinders. The specimens obtained of the mortars MR and SR were the same amount of cubes (15) and small cylinders (4), the remaining mortar was used to fill molds to obtain 10 x 20 cm cylinders. All the amount of specimens obtained are presented in Table 4.
Table 4 Amount of specimens elaborated in this investigation
| Type of mortar | Cube 5 x 5 cm | Cyl. 5 x 10 cm | Cyl. 10 x 20 cm |
|---|---|---|---|
| Low performance | 15 | 4 | 9 |
| Intermediate performance |
15 | 4 | 9 |
| Intermediate performance |
15 | 4 | 15 |
| High performance | 15 | 4 | 22 |
For some tests, the large cylinders were cut for the method defines a special specimen height (≤ 5 cm). There were a total of four specimens of this type for each cylinder (named Sl-10).
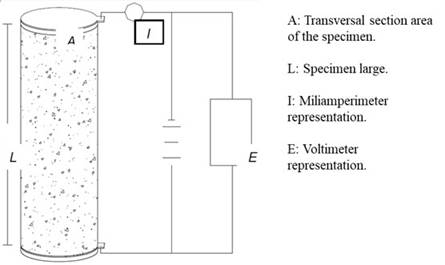
2.3. Wet Electrical Resistivity (WER) index
Determining the WER involves a simple technique that quickly measures the value of a concrete, and also it is cost effective, given the low cost of the required equipment. The specimen was removed from the curing chamber (hence the name WER), wet sponges placed on either end, and metal plates (normally a corrosion-resistant metal such as stainless steel or bronze) placed on either end touching the sponges. Afterwards the voltage was transmitted through the two plates and the resulting ionic current was measured. The voltage equipment to measure the current values were used to calculate the electrical wet resistance (WR) between the plates, that is, the resistance of the mortar specimen. The mortar was measured by using a commercial Resistance Meter following NMX-C-514-ONNCCE-2016 standard procedure (in kilo ohms, kΩ). The resulting value was multiplied by a cell constant dividing the specimen area (A) by its length (L): 5 cm for cubes, 1.96 cm for small cylinders, and 3.93 cm for big cylinders. Figure 1 represents this test.
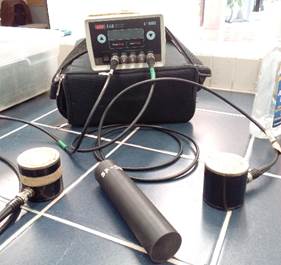
2.4. Ultrasonic Pulse Velocity (UPV) index
The UPV technique, an indirect method to determine the homogeneity of cement based materials, was used to estimate another physical property of the mortar cubes (Troconis et. al., 1997). In this method, an emitter sends an ultrasonic pulse that travels through the material until reaching a receptor. The distance between the emitter to the receiver was divided by the elapsed time for which the wave travelled from both transducers is known as UPV. After performing the electrical resistance testing, the same specimens were used to carry out the UPV technique. The UPV was measured by using a commercial ultrasonic pulse velocity tester. The procedure followed was in accordance to ASTM C597 - 2002 and project DURAR (Troconis et. al., 1997). Figure 2 represents this test.
2.5. Total Void Content (TVC) index
The TVC was measured following the ASTM C642 - 1997 procedure. After drying at 50 (C (122 °F) until constant mass (from 20 to 35 days), an initial measurement was taken and designated as dry mass (mD). The cubes were then placed in a high humidity plastic container and measurements were taken constantly until reaching constant mass, when a final saturated mass (mS) was recorded. The water-saturated specimens were weighed inside the water to measure saturated-submerged mass (mSS). The TVC (%) was estimated with the equation (1):
Since the method defines specimen height ≤ 5 cm, specimen used in this test needed additional preparation by slicing the large cylinders, to 5 cm deep slices approximately. This type of specimen was called Sl-10 in this investigation.
2.6. Effective Porosity (εeff) index
This index is obtained as a result of the Water Capillary Absorption test (WCA). In order to determine the capillary absorption of the mortar, the specimens were tested following the Fagerlund technique (Troconis et. al., 1997; ASTM C1585, 2004). This technique is the basis of the Swedish standard using four coefficients to describe mortar and concrete capillary absorption kinetics: water penetration resistance (m), capillary absorption coefficient (k), effective porosity (εeff), and capillary absorption (S). The same pre-conditioning was conducted in order to obtain 5 cm height specimens (Sl-10) for the large cylinder shapes.
The specimens were dried at 50 °C (108 °F) and < 30 % R.H. until a constant mass was achieved and subsequent drying in a desiccator. The cubes were then covered with a sealing material (wax) on four of their six faces, and the cylinders and slices at their curved perimeter, leaving the top and bottom faces uncovered. After recording the initial dry mass with wax cover (W0) the specimens were placed inside a flat-bottomed container (22 ± 4 °C [97 ± 18 °F] and ~ 100 % R.H.), making sure that the water level was reached between 3 and 5 mm (0.1 and 0.2 in.) deep. The water used for the small cylinders was contaminated with 3.5 % of chloride ions (by water mass). All the specimens were kept inside their recipient and the water level was daily monitored to maintain it at the same mark level (avoiding water loss due to evaporation, or specimens water absorption).
The change in mass of the mortar specimen per exposed unit area ((Wt - W0) / A) was then registered once a day, five days a week, during the first two months. Afterwards three measurements per week were recorded for the next three months. Finally, the measurements were taken once per week until the testing experimental period ended.
The absorption coefficients were calculated on the basis of the following equations (Troconis et. al., 1997):
where coefficient k can be evaluated as the slope of the linear region of graph (W t -W 0 ) / A as a function of t 1/2; the m coefficient can be determined by calculating the time t n required for water to get to the top face of the probe (i.e., when z = 10 cm [4 in.] for small cylinders).
2.7. Compressive Strength (CS) index
The cubes and cylinders were tested up to the failure limit under compression by a procedure in accordance to ASTM C109/C109M - 2002. The tests were performed by using a Universal Servo Hydraulic Testing Machine (nominal maximum capacity of 500 kN [112.4 kips]). The loading rate was ~0.25 MPa/sec [36.26 psi/sec]. A PC computer interfaced to the testing machine stored the output of the testing machine (maximum load) automatically.
3. RESULTS AND DISCUSSIONS
For a better interpretation, the results are presented as an average of three specimens per conditioning: mortar type, shape (cube or cylinder) and dimension.
3.1. Wet Electrical Resistivity (WER) index
The concept of electrical resistivity is a parameter which indicates the interconnection between pores in granular (i.e. soils) and porous materials. In porous materials, such as mortar or concrete, the electrical resistivity depends on the degree of pore saturation and, to a lesser extent, on paste hydration or the presence of dissolved salts in an aqueous phase (Troconis et. al., 1997). Figure 3 presents the average WER vs. time data from the three mortar types (average value of at least from three specimens per mixture, shape and dimension). The performance of mortar MR was variable between N1 and N2 parameters. It was decided to compare conventional mortars N1 and N2 vs. commercial mortar SR.
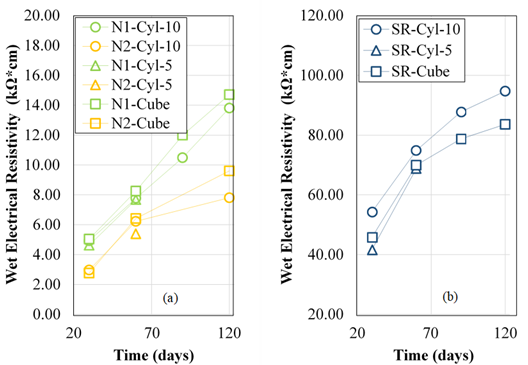
Figure 3 Average WER vs. time experimental values: (a) low (N2) and intermediate (N1) performance mortars; (b) high performance mortar (SR)
As in Figure 3, similar WER index performance was observed in all tested mortars: WER index increased with time. It is also observed from same figure that the different specimen shapes (cube vs. cylinder) and dimensions, did not affect the average WER results obtained using the direct method (NMX-C-514-ONNCCE, 2016), thus supporting the idea to measure WER regardless of specimen geometry but using a length dimension L ≥ 5 cm.
Comparing the performance of the three types of mortar testes, low performance mortar N2 increased with time and started to follow an asymptotic curve, reaching average WER index values of about 9 kΩ-cm very close to the target value in Table 1. In the case of intermediate performance mortar N1, the average WER index data continued increasing with time, which means that the cement was still hydrating and the porosity was still decreasing. The average WER index values obtained at 120 days reached about 14 kΩ-cm, which is quite close to the lower limit established in Table 1.
Finally, the average WER index data obtained with high performance mortar SR followed a nonlinear behavior after 60 days and, at 120 days of monitoring, the value reached was about 90 kΩ-cm, but it was still increasing at a low pace than at the beginning of the monitoring time. The value obtained at 120 days surpassed the 51 kΩ-cm value defined as the lower limit of such high performance mortars.
In a recent investigation (Mejía et. al., 2018), it is also observed that the commercial mortars are in the same range despite the size of specimen corresponding to an intermediate performance. The lowest mortar corresponds to a low performance with an average ±6 kΩ-cm at 120 days.
3.2. Ultrasonic Pulse Velocity (UPV) index
The UPV index performance vs. time is observed in Figure 4. For this performance index the material evaluated was only the high performance mortar SR. This was because the other mortars were not considered for this index evaluation due to a specimen shortage.

As observed, UPV index maintained almost constant during the experimental time (from 25 to 120 days). But the UPV values for the three different dimensions were different between them, showing smaller values when 5 cm cubes were used as specimens (~3.95 km/s), followed by the values obtained with 5 x 10 cm cylinders (~4.44 km/s), and finally by the 10 x 20 cm UPV results (~4.70 km/s).
Based on the evaluation criteria for UPV index in Table 1, SR stayed at high performance mortar if the specimen length L ≥ 10 cm. If the specimen’s length is less than 10 cm, same SR mortar shifted to an intermediate performance mortar.
The difference between the 5 x 5 cm cube and the 5 x 10 cm cylinder was about 12.4 %, and in regards to the 10 x 20 cm was about 19.0 %. Based on the present results and according to the Table 1, it is recommended that the UPV index needs to be measured using long enough specimens (L ≥ 10 cm), because the small ones could produce measurement errors. This could be a consequence of the components of the commercial trademark mortar because the cylinders, that are bigger than the cubes, presented a better performance which means a better hydration of the cement.
In a recent investigation (Mejía et. al., 2018), the results between the size mortars are different too. In their investigation, cubes (5 x 5 x 5 cm) presented high performance. Two of the mortars presented an average of ±4.2 km/s at 120 days, but the same mortars in 10 x 20 cm cylinder presented an average of ±3.85 km/s at the same age. This could be a consequence of the cement that has been hydrated, if the specimen is small, the voids will disappear and the pulse of the lecture in this test will be quickly.
3.3. Total Void Content (TVC) index
Figure 5 presents the results obtained of TVC vs. time for the three different specimen geometries used. For TVC index, the specimens used were full size cubes and small cylinders. The third specimen shapes and dimensions used were 5 cm in height and slices cut from the 10 x 20 cm cylinders (Sl-10).
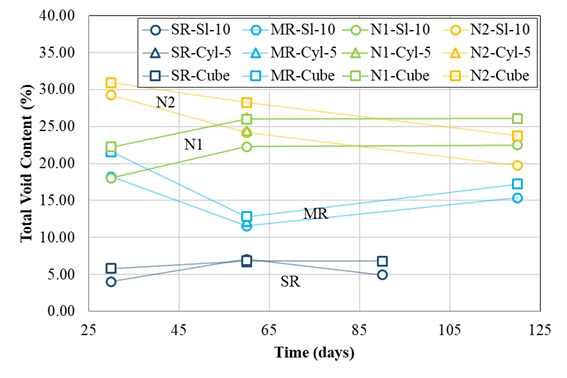
Figure 5 Average TVC index vs. time experimental values for low (N2), intermediate (N1, MR) and high performance (SR) mortars
A decision was taken on this dimension matter because all standardized methods to determine void content on hardened cement-based materials recommend using small specimens, such as 5 x 5 cm cubes or 5 cm slices cut from 10 x 20 cm cylinders. Therefore, it was tried to determine if full size small cylinders (5 x 10 cm) could provide differences in the results obtained.
As observed from Figure 5, low performance mortar N2 average TVC index was similar regardless of specimen shape (cube, cylinder or slice) and dimension, giving after 60 days and up to 120 days experimentation period values of 24.4 % in Sl-10, 26.3 % in small cylinders 5 x 10 cm and 27.6 % in cubes; (in accordance with the Table 1 performance criteria), with differences between specimens’ shape and dimension ± 10.5 %.
For intermediate performance mortars, N1 and MR, the TVC index results were similar regardless of the specimen shape (cube, cylinder or slice) and dimension, but have some interesting differences between them. Since N1 mortar was prepared as a typical cement-based mortar (cement, water, and sand), its average TVC index performance was quite similar to the low performance mortar (N2), showing values of about 24 % at 120 days, which correspond to low performance values as shown in Table 1.
At the other extreme, the MR mortar presented an average TVC index value of just 16 %, which correspond to performance values in the limit between intermediate and high performance mortar, as defined in Table 1. Finally, the SR mortar show an average TVC index values quite low of 6 % corresponding to the high performance limit presented in Table 1. This mortar also presented similar average TVC index values regardless of the specimen’s shape and dimension.
3.4. Effective Porosity (εeff) index
The effective porosity performance in time is shown in Figure 6 as per effective porosity average values, εeff. Average εeff index with time for all mortar tested agreed with typical mortar performance: as curing time increase, εeff decreases due to higher hydration degree of the cement paste in the mortar.
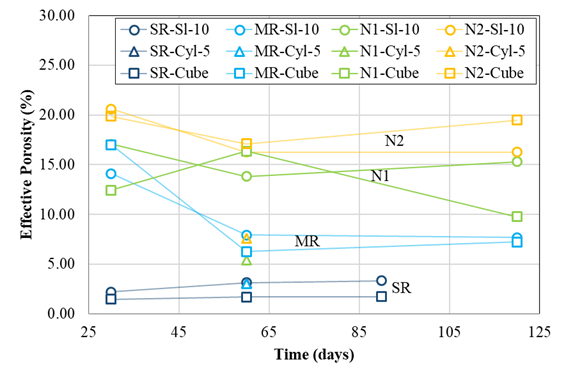
Figure 6 Average εeff index vs. time experimental values for low (N2), intermediate (N1, MR) and the high performance (SR) mortars
Figure 6 also shows that the εeff value differences between mortar type at 120 days of age: N2’s εeff between 16 % - 20 %, N1´s εeff of between 10 % - 16 %, MR´s εeff of about 7.5 %, and SR’s εeff of about 2.5 %. Therefore, it was observed that there was no difference on εeff index values between N1 and N2, which supports TVC index values obtained (Figure 5). Compared against Table 1 the performance value ranges for this εeff index, N1 and N2 index values obtained correspond to a low performance mortar, the MR index values as intermediate performance mortar, and the SR index values as a high performance mortar.
Regarding the effect of shape and dimension of the specimens on the average εeff index, the MR (intermediate performance) and SR (high performance) mortars did not show any difference between the three different specimens used. Furthermore, the low performance mortars, the N1 and the N2 for this particular index, presented quite some differences in the obtained values depending on the specimen shape and dimension, and in some cases (N1-Cube) an erratic performance (results presented ups and downs in time).
In N1 and N2 mortars the difference between small cylinders and the average of cubes and slices of 10 x 20 cm at 60 days was about 278 % and 220 %, respectively. This could be because the height of the small cylinders is larger than the cubes and the slices. Additionally, it is observed that after 60 days of curing, the 10 cm slices presented higher average εeff index than the cubes, such effect could be due to the fact that the cement reacted faster in smaller specimens than in larger specimens such as 10 x 20 cm cylinders, where the slices were cut. Another possibility is that it could be due to a geometric effect: total volume of the specimen vs. its contact area effect on the water solution (cubes and 5 x 10 cm cylinders have this ratio smaller than slices cut from 10 x 20 cm cylinders). Therefore, the εeff index might be affected from specimen shape and dimensions.
3.5. Compressive Strength (CS) index
The mechanical strength of the tested mortars was obtained using two specimen dimensions only, cubes and 10 x 20 cm cylinders. The average CS results vs. time of testing are exhibited in Figure 7.
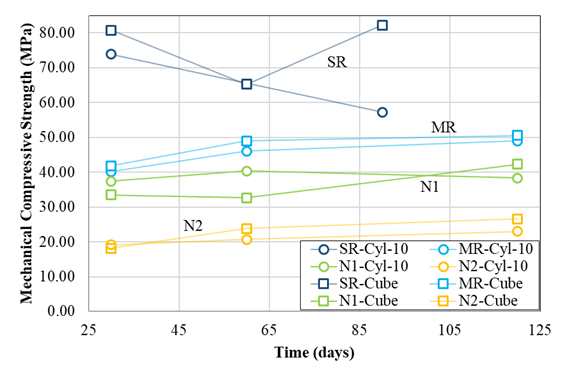
Figure 7 Average CS index vs. time experimental values for low (N2), intermediate (N1, MR) and high performance (SR) mortars
In the same figure, the average CS index values obtained from the three different mortars are easily defined. The low performance mortar N2 presented average CS index values about 25 MPa; intermediate mortar N1 and MR show average CS index values of 40 MPa and 50 MPa, respectively; and the high performance mortar SR reached values between 60 MPa and 80 MPa. The average CS index values obtained compared to specimen´s shape and dimensions (cube vs. 10 x 20 cm cylinder) for N1, N2, and MR mortars are similar: the differences between average values were less than ± 10 %.
The SR mortar presented an erratic performance of CS index values, as observed in Figure 7. This performance should be investigated in the near future, perhaps it is due to an apparent deficiency on the specimen preparation when the dimensions are large, such as the 10 x 20 cm.
The workability of this commercial available mortar during the mixing is quite low at the beginning, but after 15 minutes of being in the mixer, the mortar transformed in an almost liquid state, remaining like this if mixer is running. Afterwards, pouring of the mortar in the molds did not follow the standardized procedure (NMX-C-514-ONNCCE, 2016) because its highly fluid form, and due the fact that the mortar with the molds needs to be consolidated by a vibrating table. Therefore, additional testing on such specimen preparation with this specialized mortar need to be performed in the near future to get the best results of this material.
4. CONCLUSIONS
This investigation presents an experimental program to determine if the durability index tests (WER, UPV, TVC, (εeff), and CS) are affected from specimen shape and dimension. Based on the results obtained, the following conclusions were drawn:
Wet electrical resistivity (WER), total void content (TVC), and compressive strength (CS) durability indexes were not affected by specimen’s geometry and size.
Ultrasonic pulse velocity (UPV) and effective porosity (εeff) durability indexes were affected by specimen´s geometry and size. It is recommended that the UPV index uses specimens with L ≥ 10 cm. Yet, in order to determine the εeff index, the specimen height needs to be restricted to H ≤ 5 cm, regardless of specimen’s shape (cube or slice).

