


 nova página do texto(beta)
 Inglês (pdf)
 Artigo em XML
 Referências do artigo
 Enviar este artigo por email
 Citado por SciELO
  Similares em
SciELO
Similares em
SciELO 
 Permalink
1. INTRODUCTION
It is well known that reinforced steel corrosion represents an enormous and expensive problem to solve in marine structures, yet a preventive investment is mandatory to preserve them (Schmitt Günter, 2009), (Hays).
Concrete structures which are exposed to ocean water are commonly susceptible to corrosion. When salts and chemicals diffuse through the concrete, usually promote crack formation due to the reinforcing steel oxide layer expansive forces. Furthermore, the formed cracks along with humidity and salts can permeate towards the reinforcing steel faster and then again, cause premature damage due to corrosion (NASA Kennedy Space Center). Even though cracking is the most visible concrete reaction after corrosion starts, it is related to other damages, such as structural deteriorations, a loss in flexural stiffness as well as loading capacity capability. Also, corrosion products weaken the bonding between the concrete and its reinforcing steel, this further affects the mechanical properties of the damaged structures, resulting in a decrease in its original structural integrity.
Most of the piers in Mexico show a degree of corrosion as stated in a 100% inspection report (Torres Acosta, 2012). Mexico’s Institute of Transportation (IMT) together with Bridge Diagnostics, Inc. (BDI) set up an original procedure to make a pier corrosion damaged assessment to establish if the corroded piers are still suitable for use as originally designed. This was meant to be applied as a diagnostics toll to important Mexico’s piers.
A primary component in this assessment is a load testing to determine if a pier, exhibiting significant corrosion damages, can still operate risk-free, withstanding all its required service loads, including cranes and container vehicles that are currently present during normal uploading and downloading procedures. This is done by evaluating the structural performance through a series of controlled load tests and then developing the appropriate field verified models from which the pier is load rated using AASHTO LRFD specifications (AASHTO, 2002).
As the term implies, diagnostic load testing in a non-destructive process that can determine a structure’s performance under normal load conditions. For bridges and piers, loading is usually accomplished by driving vehicles (trucks or cranes) with measured axle weights along prescribed paths. The location of the vehicle must be monitored along with all the measurements from the various attached sensors.
After the load tests are complete, the measured values are used to verify and calibrate the theoretical responses generated by a representative software model. For the process to work out the model. it must have realistic geometry and stiffness characteristics. This is done by essentially reproducing the entire load test procedure with a finite element analysis (FEA) model; this includes generating a Two-Dimensional or Three-Dimensional model of the structure (depends on complexity of the structure), applying virtual sensors on the model and applying identical load scenarios that were utilized during the field load test procedures. By having accurate geometric representation and reproducing the load test a direct comparison between the field and analytical responses can be made.
Once a representative model is obtained, the required design or rating loads can be applied, and load ratings can be computed for all the components in the model. Because the loads applied to each structural element are generated by a realistic representation of the entire structure, the component loads are much more accurate. Another advantage to diagnostic load testing is to determine whether a section that appears damaged or significantly corroded is causing a re-distribution of loading to other structural components. Still, due to corrosion damage, the component’s capacity may be significantly impaired, causing a reduced load capacity miscalculation for that particular structural member.
This is an important distinction because the structure may be responding in a perfectly appropriate manner under typical loads as verified by the field tests, but, the load carrying capacity is significantly lower due to diminished structural capacity. Therefore, structural measurements may not indicate that a member is “weak”, even if it looks "damaged". This gap between visual inspections and known adequate structural response is what led to the development of the “Integrated Approach” that essentially combines the field measurements, the visual inspection, and the analytical modeling to reduce the uncertainty inherent in all three of these evaluation tools.
With regards to the component load rating, the same equation specified by the AASHTO - Manual for the Condition Evaluation of Bridges is applied in (1). Furthermore, the critical load conditions are likely different than those applied during the load tests. All the required vehicle loadings are applied to the structure model including all necessary multi-presence scenarios and dynamic effects.
Where:
RF |
= Rating Factor for individual member |
C |
= Member Capacity |
γDC |
= LRFD load factor for structural components and attachments |
DC |
= Dead-load effect due to structural components |
γDW |
= LRFD load factor for wearing surfaces and utilities |
DW |
= Dead-load effect due to wearing surface and utilities |
γP |
= LRFD load factor for permanent loads other than dead loads = 1.0 |
P |
= Permanent loads other than dead loads |
LL |
= Live-load effect |
IM |
= Impact effect, either AASHTO or measured |
2. METHODOLOGY
2.1 Structural testing procedures
2.1.1 Instrumentation process
The tested pier was a reinforced-concrete (R/C) structure which was designed to carry important loads including a gantry crane, vehicular, and container loads from the loading and unloading of container ships. Its superstructure comprised of 11 longitudinal beams framed into transverse inverted T-beams, and a 5-span continuous concrete deck with no apparent wearing surface indicated in the plans of Figure 1. The pier’s overall length is 250m, composed by 25 10m spans, and its width is 20.8m, divided into 7 interior stringers spaced 2m on center, 2 main girders beneath the rails of the gantry cranes, and 2 small exterior fascia stringers.
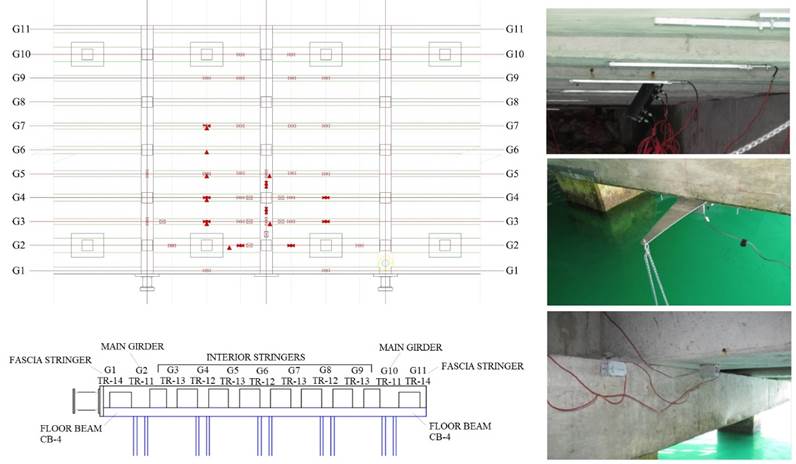
Figure 1 General instrumentation plan with gage locations and cross sections and structural element designation. Top photo: Midspan strain gages; center photo: Deflection sensor; bottom: Tiltmeter rotation sensors
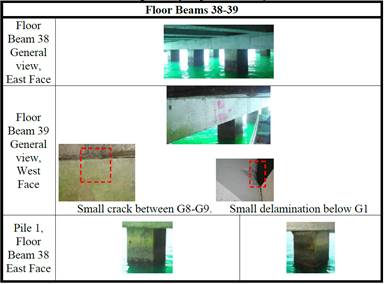
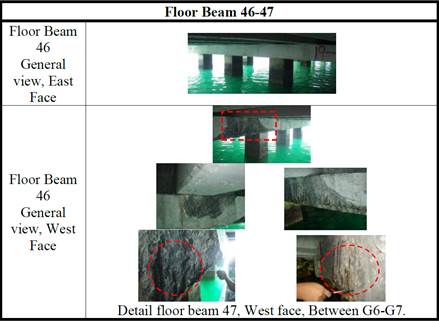
In general, the pier presented different degrees of structural degradation, showing signs of steel corrosion mainly evidenced by large areas of spalling. There were some visible cracks on the stringers, floor beams, and on the top of the slab. Overloading was evident by the crushing of the stay-in-place precast deck forms adjacent to the stringers. Figure 2 shows the pier damage survey results between floor beams 38 and 47, obtained before the pier was instrumented. Tables 1 and 2 shows some of the typical degradation pathologies observed from the damage survey performed to the pier.
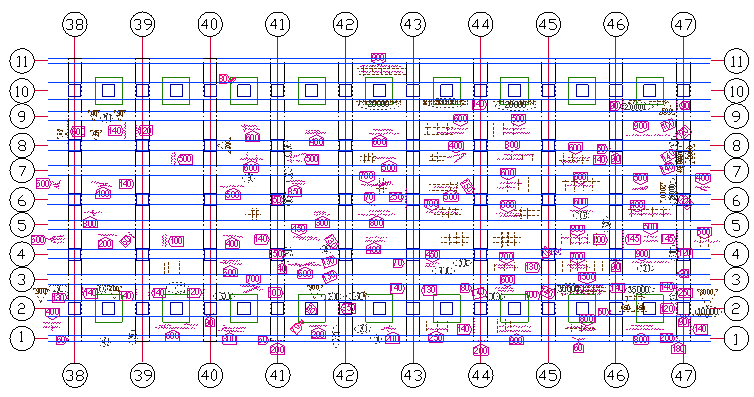
Figure 2 Damage survey of the pier between floor beams 38 and 47. The “healthy” section was defined as the pier area between floor beams 38 and 40. The “damaged” section was defined as the pier area between floor beams 45 and 47.
Two areas of the pier (between floor beams 38 and 47 were instrumented and load tested: one area with minimal degradation, defined as “healthy” (between floor beams 38 and 40, Table 1), and another one with large amounts of degradation, defined as “damaged” (between floor beams 45 and 47, Table 2). Both sections were instrumented with 44 strain transducers, 8 displacement transducers, and 7 rotation transducers (Figure 1). There were 61-cm extended gage lengths used on the primary girders and inverted T-beams to provide averaged surface strains on the reinforced concrete.
The strain transducers and tiltmeters were affixed to the structural members by using a fast-setting adhesive and removable mounting tabs, or “feet”. The sensors were installed and once the testing was completed, they were removed. Cantilever type displacement sensors were attached to the structure by installing two ¼ in wedge anchors and bolting the sensors to the anchors.
2.1.2 Load testing
The pier went through several types of load tests, which included various transverse truck positions, a gantry crane movement, and a Gottwald crane movement plus a load pick from the crane Figure 3. Fixed markers were placed on the deck in order to determine where the vehicles crossed, so this way future analysis comparisons could be made with the loading vehicle in the same locations as it was in the field. A “zero” or initial reference point was selected so all other measurements on the deck could then be related to it. Once the zero-reference location was known, the lateral load paths for the vehicle were determined. Usually, at least two passes were made at each “Y” position to ensure data reproducibility.
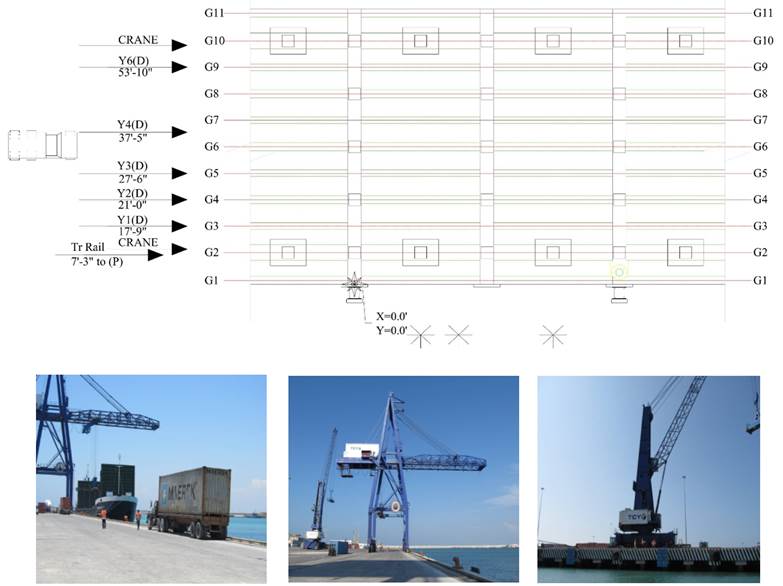
Figure 3 General truckload position plan and load types applied during testing (from left to right, truck, gantry and Gottwald cranes).
The first was a series of semi-static live-load tests consisting of a loaded container truck rolling across the instrumented spans at 6 different lateral positions. All tests were continuously recorded at a minimum sample rate of 33.33 Hz. Load tests were performed at crawl speed (4-8 km/h) to minimize dynamic effects.
The second set of tests consisted of rolling one of the large rail gantry cranes across the instrumented spans. Like the truck tests, measurements and crane position were recorded continuously at a minimum sample rate of 33.33 Hz. The railed gantry crane for testing weighted 700tons (43.75tons per axel with a support separation of 15.24m).
On the “healthy” section, the used truck weight was 48.18tons, distributed as 3.01tons on axel 1 (with a wheel separation of 2.03m), 11.67tons on axel 2 and 3 (with a wheel separation of 2.13m), and 10.63tons on axel 4 and 5 (with a wheel separation of 2.13m). The “damaged” section was tested with a truck with 39.70tons weight, distributed as 3.13tons on axel 1 (with a wheel separation of 2.06m), 9.91tons on axel 2 and 3 (with a wheel separation of 2.18m), and 8.13tons on axel 4 and 5 (with a wheel separation of 2.18m). Ideally the same truck and container would have been used for both tests, but this was not feasible due to normal port operations.
The third type of load testing was static tests performed using the gantry crane, but this time without movement. For these tests, the crane was placed so that the center of its west trolley was located at midspan of the first instrumented span (12 & 19 respectively). Data was continuously recorded as the crane performed a series of typical loading/unloading procedures: pick up a fully loaded container, then move the container to the far end of the boom (over the water), then move the container back to the near end of the boom, then lay down the container back over the ground. These static tests were performed to obtain a qualitative understanding of the load transfer characteristics of the crane during the loading and unloading process.
The fourth and final set of load tests was one live-load and one static test performed with the smaller, moveable Gottwald crane. As with the other live-load tests, sensor measurements and longitudinal crane position were recorded continuously at a minimum sample rate of 33.33 Hz as the crane was moved along the instrumented spans at crawl speed. Due to crane malfunctions and limitations, only one test was performed along one path, and only on the “damaged” section of the pier. The static test consisted of recording data as the crane extended its outriggers, lowered the outriggers, raised itself fully off the ground, lowered itself back down, and retracted its outriggers. The Gottwald crane weighted 360tons, distributed equally on its axels with 60tons on each one (with a support separation of 4.65m).
3. RESULTS
3.1 Preliminary investigation of tests results
All the field data was first examined graphically to provide a qualitative assessment of the structure live-load response.
The structural responses as a function of load position were recorded from the wireless truck position indicator, providing a stress data as a function of stress position.
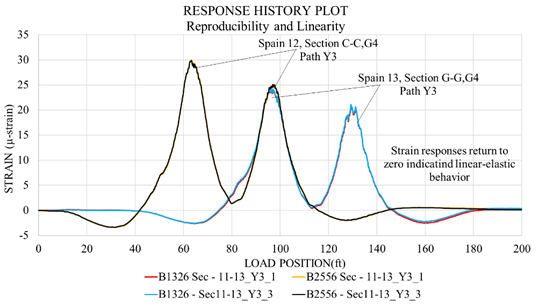
The tests results from identical truck crossings were reproducible, and all strains appeared to be linear with respect to load magnitude (truck position) and the clear majority of responses returned to zero, indicating that the structure was acting in its linear-elastic regime. The truck strain results can be seen in Figure 4, in which linear-elastic behavior and reproducibility of the tests were observed.
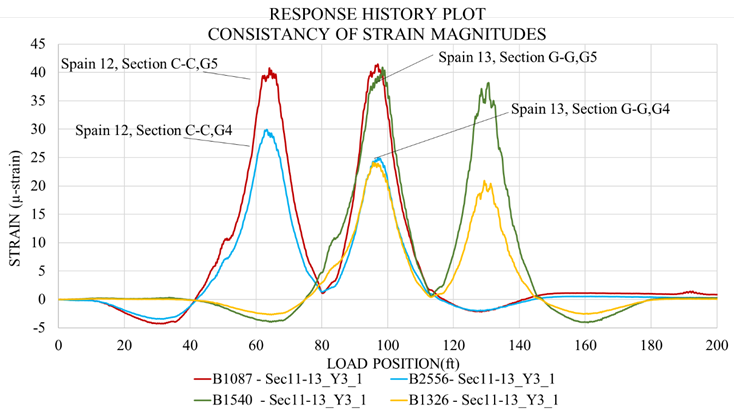
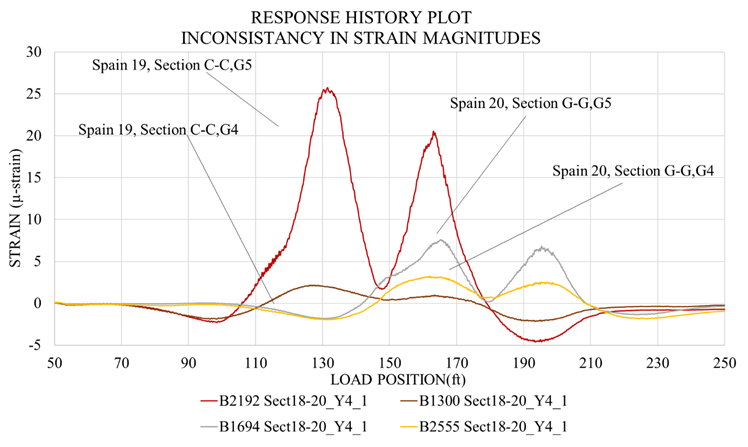
Strain response magnitudes from the midspan gages on the “damaged” section were much less consistent than the strain magnitudes from the “healthy” section. These responses were fairly expected due to the higher level of degradation observed in the “damaged” section versus the “healthy” section of the pier and indicate that lower stiffness values may be confirmed in the FE model of the “damaged” section. Figure 5 illustrates consistent strain magnitudes recorded in the “healthy” section, and Figure 6 does the same for the inconsistent results on the “damaged” section.
Maximum deflection measurements were directly compared for the “healthy” section and the “damaged” section. In general, there was an agreement between both regions and often the “healthy” section had slightly greater deflections (because the load applied to the “healthy” section was greater).
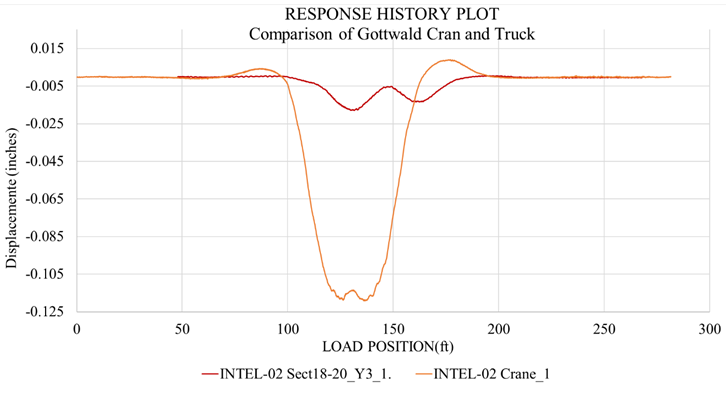
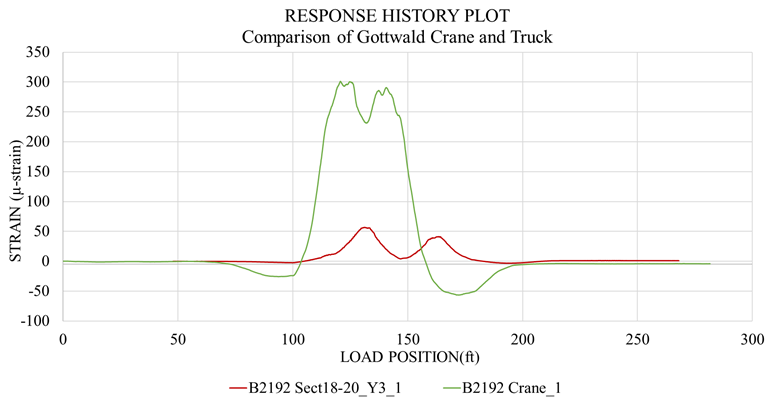
A direct comparison of displacement and strain results were made for the Truck and Gottwald Crane responses. The Gottwald crane induced significantly greater responses in the floor beams and stringers compared to the fully loaded truck. This is seen in Figure 7 for stringer displacement values and in Figure 8 for stringer strain values. The lateral load distribution of this structure was examined by looking at bottom flange strain and displacement values for all beams for the truck positions that generated maximum midspan responses. The apparent lateral distribution was very low in both spans.
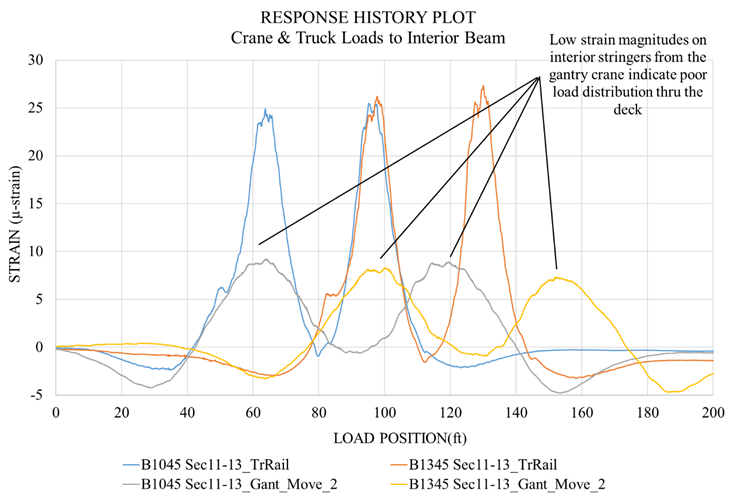
This could be since the Gottwald structural members are very long and absorb much of the loading, and also the deck was likely to be flexible due to the extremely long point loads being applied by the loaded container trucks and the Gottwald moveable crane. During the load testing process, it was observed that the stay-in-place (SIP) forms were crushed most severely at the inside face of the main girders.
This could be due by cause of the gantry crane rails are offset to the inside face of the main girders and the fact that the Gottwald crane outriggers primarily load the deck and stringers immediately adjacent to the main girders. This indicated that the slab in these locations was only transferring load in one direction. It appeared that the truck loading on the interior stringers got transferred to the main girders fairly well, but that the crane loading did not get transferred to the interior stringers as expected. This was an important factor in the model. The distribution of crane load to interior stringers is illustrated in Figure 9.
As previously stated, all test data was initially processed and assessed for quality. Then, one set of test data for each truck path was selected for having the best apparent quality. This selected data was then used to calibrate the finite-element (FE) models of the structure, which were in turn used to produce the load ratings.
3.2 Modeling, analysis, and data correlation
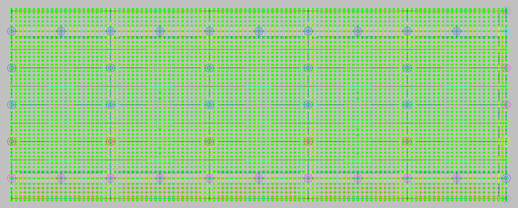
The information obtained from the preliminary investigation of these test results was subsequently used to verify the accuracy of a finite element model (Figure 10). The three methods and findings of the Finite Element (FE) modeling procedures were: Finite Element Model Generation; Model Calibration Procedures, and finally Model Calibration Results.
Following the optimization procedures, the “healthy” model produced an average correlation coefficient of 0.9729, while the “damaged” model produced an average correlation of 0.9704. Both of these correlations can be considered as a proper match for an R/C structure of this kind. Table 3 shows the parameter and model accuracy values used in the initial model and obtained for the final models. These values were determined to establish the initial ones as theoretical, and the final ones by adjusting them to the finite model results.
Table 3 Model accuracy and parameter values.
| Modeling parameter | Initial model value | Final model value |
|---|---|---|
| Effective Modulus ( E [kg/cm2] ) - Deck - Deck adjacent to T-beams - Deck adjacent to TR-11 beams - TR-13 beams at midspan - TR-13 beams at ¼ span - TR-13 beams at ends - TR-12 beams at midspan - TR-12 beams at ¼ span - TR-12 beams at ends - TR-11 beams at midspan - TR-11 beams at ends - T-beams at midspan - T-beams at ends |
225,000
225,000 225,000 225,000 225,000 225,000 225,000 225,000 225,000 225,000 225,000 225,000 225,000 |
35,150 17,580 17,580 / 0 81,275 / 60,960 220,400 43,940 142,510 / 106,870 220,400 70,300 101,900 109,700 89,150 256,600 |
| Effective Torsional Stiffness ( J [cm4] ) - Inverted T-Beam |
69,960,000 | 52,208,000 |
| Vertical Pile Resistance at T-Beam Bearings( Fz [kg/cm] ) - Interior Pile Springs - Intermediate Pile Springs - Exterior Pile Springs |
1,597,000 1,597,000 1,196,500 |
1,160,800 803,600 1,303,700 |
| ERROR PARAMETERS | INITIAL
MODEL VALUE “HEALTHY”/”DAMAGED” |
FINAL
MODEL VALUE “HEALTHY”/”DAMAGED” |
| Absolute Error | 95,515 / 35,500 | 33,000 / 29,600 |
| Percent Error | 36.7% / 13.0% | 5.6% / 12.1% |
| Scale Error | 2.9% / 4.3% | 1.5% / 3.9% |
| Average Correlation Coefficient |
0.8973 / 0.9133 | 0.9729 / 0.9704 |
3.3 Load rating results
Once the finite element model was calibrated to field conditions, engineering analysis was followed to address any optimized parameter that could possibly change over time or that could be unreliable with heavy loads or further damage. The Load Rating Factor was determined by a formula based on a certain element capacity, the applied live and dead loads (and their corresponding factors), and a considered impact effect. It is known that a load-rating factor greater than 1.0 indicates a member capacity exceeds the applied loads with the desired factors of safety (AASHTO, 2002). A rating factor less than 1.0 indicates a structural member is deficient such that a specific vehicle or load cannot cross the bridge with the desired factor of safety. A number near 0.0 indicates the structure cannot carry its own dead weight and maintain the desired safety factor. The lowest component rating-factor generally controls the load rating of the entire structure. As mentioned before, the rating equation specified by the AASHTO - Manual for the Condition Evaluation of Bridges was applied (1).
3.3.1 Capacity Calculations
Shear and moment capacities were calculated for the R/C stringers using the AASHTO LRFD Bridge Design Specifications 5th Edition - 2010 and the structural as-built plans provided by IMT. As per the provided plans, the reinforcing bar yield strength was assumed to be 4,200kg/cm2. The concrete compressive strength was assumed to be 233 kg/cm2 based on cylinder compression tests performed on concrete core samples by IMT.
3.3.2 Load Rating Procedures
Load ratings were performed on the calibrated model according to the AASHTO LRFR method. Load and resistance factors used in the load rating calculations are provided in Table 4.
Table 4 Applied load and resistance factors.
| Rating Method | Description | Loading Type | Factor |
|---|---|---|---|
| AASHTO LRFR (Inventory) |
Dead Load - Structural | All Vehicles | 1.25 |
| Live Load | Gantry Crane (Design) | 1.75 | |
| Gottwald Crane (Legal) | 1.40 | ||
| Trucks (Design) | 1.75 | ||
| Impact Factor | Gantry Crane (Design) | 5% | |
| Gottwald Crane (Legal) | 5% | ||
| Trucks (Design) | 33% | ||
| AASHTO LRFR (Operating) |
Dead Load - Structural | All Vehicles | 1.25 |
| Live Load | Gantry Crane (Design) | 1.35 | |
| Gottwald Crane (Legal) | 1.40 | ||
| Trucks (Design) | 1.35 | ||
| Gantry Crane (Design) | 5% | ||
| Gottwald Crane (Legal) | 5% | ||
| Trucks (Design) | 33% | ||
| AASHTO Resistance Factors |
Moment | N/A | 0.90 |
| Shear | N/A | 0.90 |
Several combinations of load vehicles were also considered for load rating. Load combinations were based on normal operating procedures and attempted to include other feasible combinations that may or may not be “typical” operating procedures. There were 6 specific scenarios: one with the gantry crane by itself, one with the Gottwald crane by itself, one with the same Gottwald crane, but static, one with four container trucks, one with the gantry crane and one truck, and the final one with the gantry crane and four trucks.
3.3.3 Load Rating Results
Table 5 shows a summary of the load rating factors and responses for the aforementioned load rating vehicles. Critical positive moment rating factors occurred at the midspan of the inverted T-beams due to an insufficient amount of positive moment reinforcing steel. Negative moment ratings were controlled at the ends of the T-beams but were just barely below 1.0 for all inventory ratings. Critical shear ratings were controlled by the flange bearing capacity of the inverted T-beams for hanger failure. The overall controlling Load Rating Factor for this structure was 0.20 produced at the positive moment with the Gottwald moveable crane.
Table 5 Critical LRFR load rating factors and weights for five load configurations.
| Rating Vehicle | Response, Location | LRFR - Inventory | LRFR - Operating | ||
|---|---|---|---|---|---|
| RF | Tons | RF | Tons | ||
| Gantry Crane | + Moment, TR - 11 | 0.86 | 399
(one side) |
1.11 | 515 (one side) |
| Gottwald Crane | + Moment, T-Beam | 0.20 | 72 (gross) | 0.20 | 72 (gross) |
| Gottwald Crane Static |
Shear, T-Beam Flange |
0.50 | 180 (gross) | 0.20 | 72 (gross) |
| Container Trucks | + Moment, T-Beam | 0.55 | 12.8
(dual axle) |
0.71 | 16.6 (dual axle) |
| Container Trucks + Gantry Cane |
+ Moment, T-Beam | 0.49 | N/A | 0.64 | N/A |
4. DISCUSSION
Analyses were made for critical loads and their response for the positive moment, for the negative moment, and for shear. Most load rating resulting values were below 1.0, meaning that loads exceeded the elements capacities. The critical load rating factor and responses for the positive moment was 0.20 produced by the moving Gottwald crane. For the negative moment, the combination of the gantry crane with four container trucks was critical with a factor of 0.94. The critical load rating factor and responses for shear turned out to be 0.50 with the Gottwald crane, again, but static.
Regarding deflections, overall, there were not many differences between the “healthy” and “damaged” sections. These two sections were instrumented identically and showed slightly different results, having a deflection of -4.55x10-02cm on the “damaged” section.
5. CONCLUSIONS
Load test results indicated that the pier was performing in a linear-elastic manner, even though inconsistencies in response magnitudes were observed in the “damaged” section. Many of the structural beams, especially the lateral inverted T-beams, did show signs of fairly severe concrete spalling due to an expansion of the reinforcing steel (corroded). However, this is primarily a serviceability issue and does not have a major effect on the structural capacity of the sections until there is significant steel loss due to corrosion. It could be thus possible that the large applied loads generated strain cracks, which then prompted a higher exposure of the reinforced steel to corrosive ions. A healthy correlation was obtained by the analysis after the calibration process, further indicating that all structural responses were linear.
The critical rating factor for this pier was 0.20 obtained with the Gottwald moveable crane and was controlled by the positive moment in the transverse inverted RC T-beams. It is important to note that the poor load rating was due to insufficient positive moment reinforcing steel in the bottom flange of the inverted T-beams. Non-destructive evaluation (NDE) should be performed on the inverted T-beams to locate and determine the amount of steel remaining present.
Several other structural components also had rating factors less than 1.0 for the Gottwald moveable crane. In fact, the flange bearing capacity of the inverted T-beams produced only slightly better rating factors at 0.50, and the midspan moment capacity of the TR-13 beams rated at only 0.75. Consequently, careful technical considerations are to be followed since these results suggest that the removal of the crane from normal operations should be considered until the deficient or damaged members are sufficiently strengthened (to increase their load capacity). Strengthening all the insufficient members may be a feasible option since the weak components are relatively isolated; it is still recommended however that NDE to be performed first to verify that the capacities used for load rating were indeed correct based on the actual steel present in the members. At a very minimum, steps should be taken so that the Gottwald crane is never placed within a span of the gantry crane.
Future inspections should focus on the escalation of moment cracks in the transverse inverted T-beam and stringers. In addition, careful attention should be paid to the flange bearing areas of the inverted T-beams and the signs of failure associated with beam ledges.
The load rating factors and conclusions presented in this report are provided as recommendations based on the structure response behavior and condition at the time of load testing. Further structural degradation must be considered in future load ratings.

