


 nova página do texto(beta)
 Inglês (pdf)
 Artigo em XML
 Referências do artigo
 Enviar este artigo por email
 Citado por SciELO
  Similares em
SciELO
Similares em
SciELO 
 Permalink
1. INTRODUCTION
During the last 20 years, the term concrete durability has been used more frequently among members of the scientific society worldwide. In some developed countries as the United States of America, Spain, France, United Kingdom, and Japan, durability has been addressed as a very important subject, attracting seven figures investment for research in this area. Reinforced concrete structure deterioration due to rebar corrosion has increased as consequence of cracks on the concrete cover surface. Many investigations so far, have been performed based on the study of durability during the initiation period. However, very few have been focused toward its performance during its residual life.
Some studies related to the residual life stage of concrete structures, have been made where accelerated corrosion was performed by applying a constant anodic current to the rebars (Tachibana, et.al., 1990; Huang and Yang, 1997; Rodriguez et.al., 1997; Almusallam, et.al., (1997); Cabrera, 1996). After applying such anodic currents to the rebar in a short period of time, reduction of the structural capacity was correlated with corrosion parameters such as gravimetric metal loss and corrosion-induced concrete cracking (Almusallam, 1997; Mangat and Elgarf, 1999; Torres-Acosta, 1999). Torres-Acosta, 1999; Torres-Acosta and Martínez-Madrid, 2003, have conducted several studies related to this subject, but also under natural conditions (Torres-Acosta and Castro-Borges, 2013; Cabrera-Madrid et al, 2014). In a previous investigation (Torres-Acosta and Martínez-Madrid, 2003), they reported results on residual life degradation parameters, using reinforced concrete slabs (0.42 w/c ratio, chloride contamination during mixing to accelerate rebar corrosion) and no anodic current application. At the end of the experimentation, corrosion-induced crack position, width, and length were measured and correlations with the cross-section mass loss were also performed. Based in their experimental results, empirical relationships between average rebar radius loss (xAVG) divided by the original rebar radius (r0) and load capacity were established. As an example, 10% radius loss might result in a 50% load capacity loss in reinforced concrete beam elements. They also developed an empirical relationship between crack width, WC, and the relation xAVG/r0. Apparently, when corrosion rate is small (12-60 µm y-1) cracks appear and grow in length and width faster than in accelerated corrosion tests. Finally, the last empirical correlation obtained included xAVG and maximum pit depth (PITMAX), giving a factor of seven times: PITMAX ~ 7·xAVG (Torres-Acosta and Martínez-Madrid, 2003).
Subsequently, in 2003, Vidal et.al. studied crack width and rebar diameter loss due to corrosion in reinforced concrete beams (0.5 w/c, 35 g l-1 NaCl contamination). They discussed that reinforcement corrosion obtained in this investigation is closer to what is observed in natural conditions (with respect to the distribution of corrosion, types of corrosion, and oxides produced) than the obtained by impressed current or addition of calcium chloride in concrete. They developed a new model relating crack width vs. rebar cross section loss and observed that the rebar cross section loss seems to be independent of their diameter and the concrete cover/rebar diameter ratio, except when evaluated in the period of crack initiation.
In 2007, Torres-Acosta et.al. reported an empirical correlation between rebar corrosion rate and crack width, using reinforced concrete beams (0.6 w/c, contaminated with NaCl: 1 wt% Cl- on cement basis), and subjected to a bending stress. The beams were sprayed in a central area of 25 cm long twice a week, with saline solution (3.5 wt% Cl-) in order to accelerate rebar corrosion in this area. They concluded that in a process of natural corrosion, cracks generated by the corrosion products expansion develop more slowly (width and length) than those generated by accelerated corrosion. The results obtained, showed that for a corrosion radius loss (xAVG/r0) from 4% to 10%, cracks were produced with a maximum width (CWMAX) of 0.1 mm and 1 mm, respectively. The trend obtained in this study was similar to that obtained in previous research with natural corrosion (Torres-Acosta and Castro-Borges, 2013; Cabrera-Madrid et al, 2014).
The present work show the results of one of DURACON project test natural exposure sites (La Voz, Venezuela). It was located in a coastal marine environment of high aggressiveness, where some of the reinforced concrete prisms (0.65 w/c ratio concrete) in this project presented surface corrosion-induced cracks, and an empirical correlation was obtained between maximum cracks width and corrosion rate (iCORR) expressed as average rebar radius loss (xAVG/r0) from natural corrosion data.
2. EXPERIMENTAL PROCEDURE
2.1 Prismatic specimens
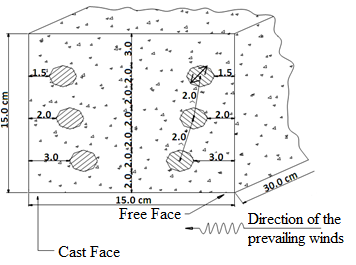
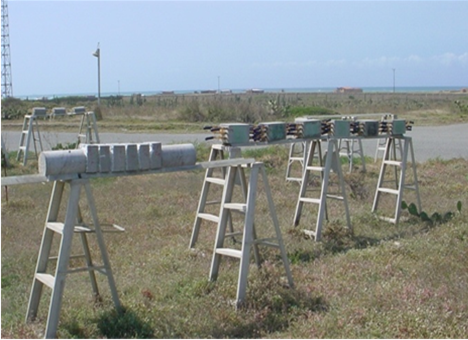
In this investigation, reinforced concrete prismatic specimens from DURACON project (Troconis de Rincón et.al., 2007) were used. These were installed in a project’s natural exposure sites called La Voz (in Venezuela), classified as marine environment of very high aggressiveness (>C5 according to ISO(1) 9223: 2012. Figure 1 shows a schematic diagram of the prismatic specimens under evaluation. Concrete prisms of 15x15x30 cm (0.65 w/c ratio) and reinforced with six rebars (9.5 mm in diameter), placed at different concrete depths (two each at 15, 20 and 30 mm). Three of them were placed at the windward face and the other three on the leeward face. The ends of each bar were protected with epoxy coating to avoid oxygen differential and crevice corrosion, leaving a central portion of 15 cm length uncovered. Figure 2 shows the specimen supports installed at La Voz test station.
2.2 Environmental assessment
Climatic and environmental parameters were assessed according to the methodology established by ISO 9223 standard determining environmental aggressivity in the test station. Parameters as relative humidity (RH), time of wetness (TOW/(), wind speed and direction, rainfall amount, daily temperature, chloride concentration, CO2 concentration and sulfur compounds concentration, were measured during the experimental period. It is important to mention that there are currently no regulations to identify the aggressiveness of the environment for reinforced concrete structures; therefore, ISO standard for metallic materials was used as a first approach.
2.3 Electrochemical evaluation
For electrochemical monitoring, a GECOR 6(†2) field corrosimeter instrument was used, which measured corrosion potential (ECORR, vs. Cu/CuSO4 reference electrode), and corrosion rate (iCORR) of the reinforcement, by the linear polarization technique (Feliú et.al., 1993).
2.4 Cracks survey
Rebar corrosion-induced concrete surface cracks, both in the windward face as well as in the leeward face were monitored by a careful visual examination using a (nonstandard) 15cm x 30cm grid to report the length and location of each corrosion crack. Cracks widths were measured using a crack comparator card. Thereby, an overview crack map was recorded, showing the length, location, and width of all cracks in all specimens. Experimental data were fitted linearly and compared with data obtained by other authors with natural and accelerated corrosion techniques. In order to assess the rebar cross section loss, an estimate was made using the area under iCORR vs. time plot. This value was then correlated with maximum crack width (MCW), corresponding to each of the rebars of the specimens tested. Rebar mass loss estimates were calculated using Faraday law (Equation [1]):
Where: ΔWf is faradaic mass loss (g); 55.85 g/mol is the atomic weight of Fe; (Idt is the area under the curve iCORR vs. time; n is the valence number for iron (+2), and F is Faraday’s constant (96,500 C/mol). This value is then used to estimate the average radius loss due to corrosion (XAVG), in mm, which is calculated using Equation (2):
Where: ρ, iron density (gr/cm3); D, rebar diameter (mm) and l, length of the rebar (mm).
At the end of the experimentation, concrete specimens were demolished and the steel rebars were retrieved to determine the real cross section loss based on average pit depth estimates.
3. RESULTS AND DISCUSSION
3.1 Environmental assessment
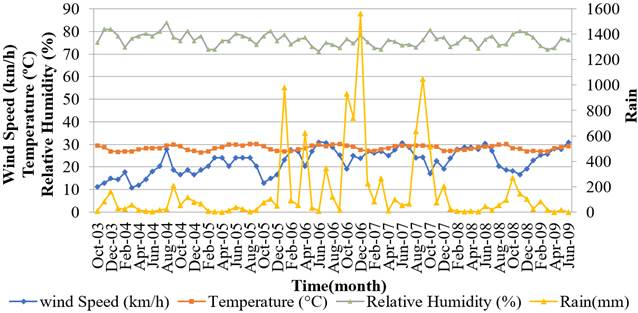
Figure 3 shows the weather parameters results of the natural test site monitored during the exposure time. It is clear to observe the rain-drought periods, typical of tropical environments. There was only one short period of high rain precipitation and was at the end of year 2006, as a result of the weather phenomenon caused by hurricane Ivan, which passed through the Lesser Antilles and the Caribbean Sea.
Regarding monthly average temperature, it varied only 3 °C during the entire evaluation period (six years). The minimum value was 26.7 °C (March 2003 and February 2009), while the maximum value was about 30 °C (October 2004 and September 2008). The small variations observed for this parameter, shows a climatic stability in this test station and the geographic region itself.
The highest monthly average relative humidity (RH) value from the whole evaluation period was observed in August 2004, which was 84%. This coincides with the highest rain precipitation value for the year.
For wind speed data, in general it can be seen that it vary in a range between 17 and 24 km/h, with large variations when sudden changes occur in the microclimate, as the phenomena that have been explained above where the wind speed was substantially increased. Chloride and sulfate estimates present in this atmosphere and the time of wetness during the 6-year exposure time are shown in Table 1. A very high corrosive ambient, according to ISO 9223, for the first three years of this test station, was corroborated based on the monitoring of parameters in Table 1. For the 4th and 5th year, a decrease in corrosivity was noticed, possibly due to high rainfall from storms and hurricanes occurred in those years; however, remains highly corrosive. The time of wetness (TOW) was also estimated with the weather parameters such as temperature and RH using ISO procedure (see Table 1).
Table 1 Aggressive agents and time of wetness (TOW) at the test station La Voz
| Evaluation Time (y) |
Chlorides (mg m-2d-1) /S |
Sulfates (mg m-2d-1) /P |
TOW (hy-1) /τ |
ISO 9223
Corrosivity class |
|||
|---|---|---|---|---|---|---|---|
| 1 | 683.907 | S3 | 22.645 | P1 | 4818 | τ4 | C5 |
| 2 | 382.561 | S3 | 27.800 | P1 | 4818 | τ4 | C5 |
| 3 | 128.898 | S2 | 19.726 | P1 | 6132 | τ5 | C5 |
| 4 | 154.159 | S2 | 13.111 | P1 | 3451 | τ4 | C4 |
| 5 | 165.691 | S2 | 5.616 | P0 | 2823 | τ4 | C4 |
| 6 | 183.682 | S2 | - | - | - | ||
Corrosion induced by chloride ions attack was favored because high relative humidity facilitates the transport of aggressive agents in the atmosphere enhanced by the high temperature, which accelerates localized corrosion of the bars.
3.2 Electrochemical parameters
Figures 4 and 5 show the results obtained from the electrochemical monitoring: corrosion potential and corrosion rate vs. time for 15-mm and 30-mm concrete depth rebar, respectively.
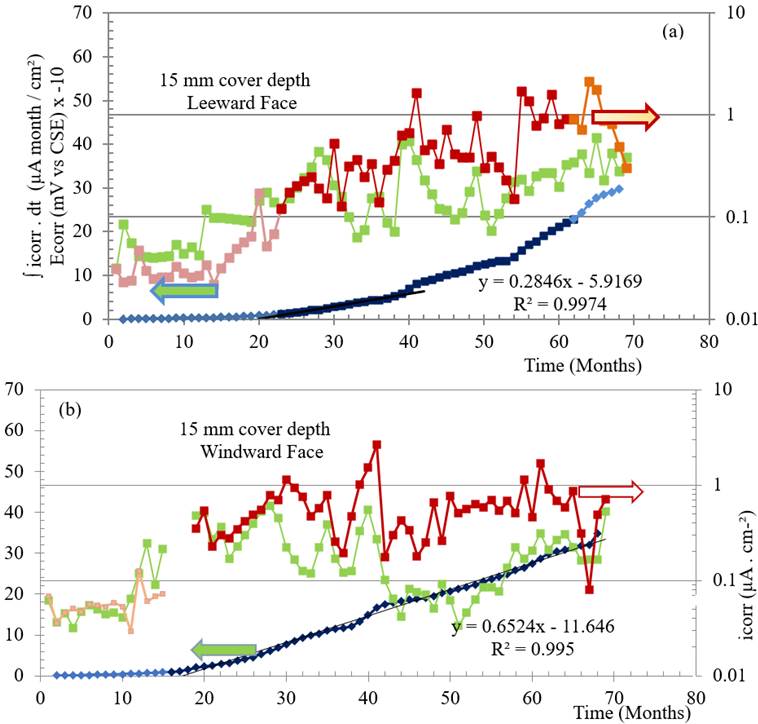
Figure 4 Electrochemical parameter monitoring (ECORR ; iCORR and cumulative iCORR values) vs. time for 15-mm concrete depth rebar, leeward (a) and windward (b) faces.
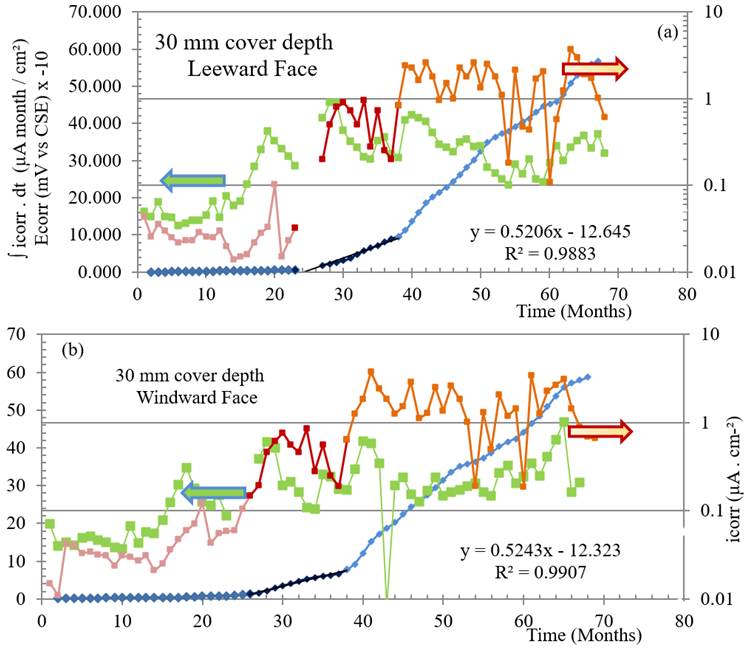
Figure 5 Electrochemical parameter monitoring (ECORR; iCORR and cumulative iCORR values) vs. time for 30-mm concrete depth rebar, leeward (a) and windward (b) faces.
These figures clearly show the time in which the bars began to depassivate (ECORR and iCORR more negative than -250 mV vs. Cu/CuSO4 and greater than 0.1 µA/cm2, respectively); coinciding with the first change in slope of the accumulated corrosion rate vs. time curve.
In addition, these figures show 30-mm depth rebars stayed passive for longer time than the 15-mm depth rebars, but the propagation rate for the first set were higher than the second set. This might be due to the winds at the La Voz natural test site did not show a preferential trade wind direction (North-East in this case), but rather slashing winds which also allows the ingress and diffusion of chloride ions through the prism’s bottom face. This was the top cast face and the most porous one, which was the closer to the deeper bars (30-mm depth rebars), thus giving this unusual performance.
3.3 Crack width and corrosion rate correlation
Figure 6 shows the state in which one of the three representative specimens were found after a 6 year exposure period in La Voz natural test site. This figure also shows a photograph of the specimen’s windward face and a schematic representation of the surface fissures/cracks survey that presented such specimen.
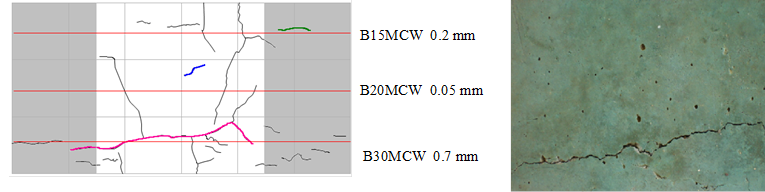
Figure 6 Specimen 6 (w/c ratio 0.65, and windward face) surface crack survey (left) and photographic evidence of such distress (right)
Figure 7 shows that with increasing loss of cross section area of the rebars (estimated from ∫ iCORRdt data and equations 1 and 2), the surface MCW also increases (at the specimen’s windward face). The effect of the concrete cover on crack initiation and propagation (on the windward face) was also demonstrated in Figure 7: crack widths were bigger at rebars with smaller concrete cover having the same rebar cross section loss. This might be due to the concurrent effect of high relative humidity prevailing in the area (> 80%) together with a high chloride ions content, which maintains moisture inside the bulk concrete, such that the chloride ions (129-684 mg m-2d) can diffuse easily, promoting reinforcement corrosion.
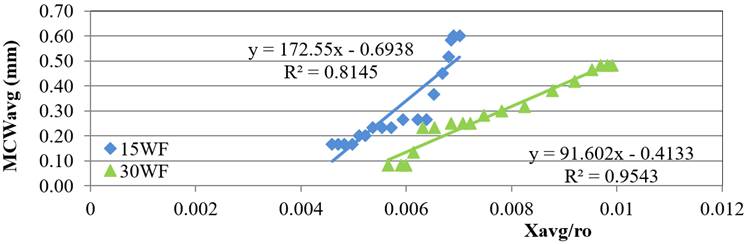
Figure 7 Average maximum crack width of concrete in relation to the rebar cross section loss, at the natural test site La Voz, w/c ratio 0.65, windward face
It is also important to mention that there is a direct relationship between the MCW and rebar’s xAVG/r0. The goodness of the correlation is high for the first years of exposure (MCW<0.3 mm), while for MCW’s wider than 0.3 mm the data was disperse, causing the correlation to decrease. Additionally, the mean MCW increases with very little loss of material due to corrosion. Also when MCW’s are too wide, voids were created, which interfered with the iCORR measurement using the described corrosimeter field instrument. This raises some doubts over the last year’s iCORR data, which was used to obtain xAVG/r0. Thus, it was necessary to discard the latest iCORR measurements and determine the correlation between MCW and xAVG/r0 using first year data.
A more representative correlation between MCW and xAVG/r0 are presented in Figure 8, where the last years iCORR bias measurements of both bars were removed, thus better correlations were obtained (R2 ~0.9722 and 0.9038 for 15-mm and 30-mm depth rebar, respectively).
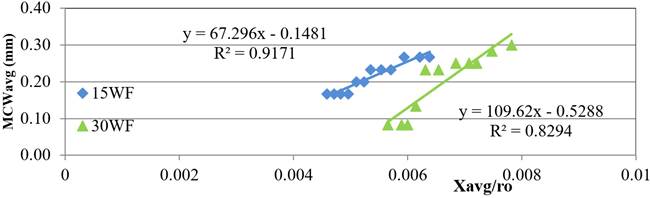
Figure 8 Representative behavior (last year’s data removed) of the average maximum crack width of concrete in relation to the rebar cross section loss, at the natural test site La Voz, w/c ratio 0.65, windward face
Figure 9 shows a typical crack surveys and photograph of one of the specimen’s leeward face from a representative 0.65 w/c concrete specimen after 6 years of exposure. As observed from these results, wider cracks were observed than at the windward face. This performance might be due because it remains wet for longer periods of time, which favors the transport of characteristic environment´s aggressive agents, and spread into the bulk concrete as compared to the windward face, which was in continuous contact with hot/high speed wind that could dry out the concrete’s internal moisture. This performance is observed also in Figures 4 and 5, where the corrosion rates of leeward face rebars show small increments at the end of the exposure period.
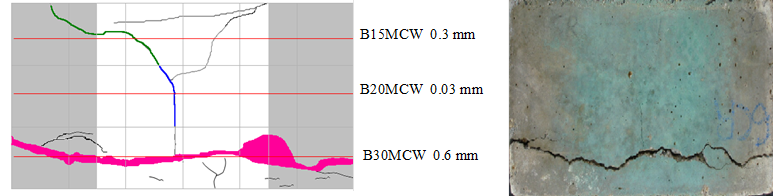
Figure 9 Left, General map of cracks and right, photo of the specimen 6, w/c ratio 0.65, leeward face
Similarly to the windward face data, the leeward face data did not have good correlation between the MCW and rebar´s xAVG/r0 when cracks were wider than 0.5 mm, and the last year data points were also bias. Thus in Figure 10, the more representative relationship between MCW and xAVG/r0 was obtained by removing last year´s data of the two rebars, which significantly improves the correlation (R2 ~0.9397 and 0.9843 for the 15-mm and 30-mm depth rebar, respectively).
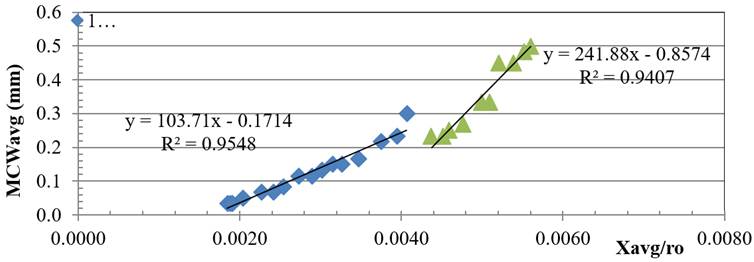
Figure 10 Representative behavior (last year’s data removed) of the average maximum crack width in relation to the loss cross section area of the bar at the test station La Voz, w/c ratio 0.65, leeward face
On the other hand, the effect of concrete cover on crack propagation unexpectedly was the opposite than the windward performance: the largest crack widths were found for the 30-mm depth rebar. This might be due to (as explained in Section 3.2) the winds at the La Voz natural test site did not show a preferential trade wind direction (North-East in this case), but rather slashing winds which also allows the ingress and diffusion of chloride ions through the prism’s bottom face. This was the top cast face and the most porous one and the closer to the deeper bars (30-mm depth rebar), thus giving this unusual performance.
Figure 11 shows as a comparison, a compilation of the MCWavr (average MCW) and xavr/r0 data obtained in this investigation together with data from a previous investigation (Torres-Acosta and Martínez-Madrid, 2003) with natural and accelerated corrosion conditions. Accelerated corrosion data was plotted in Figure 11 using symbols without any filling color, as compared the natural corrosion data symbols, which all are either black filled for previous investigations data or blue-pink-orange for this investigation data.
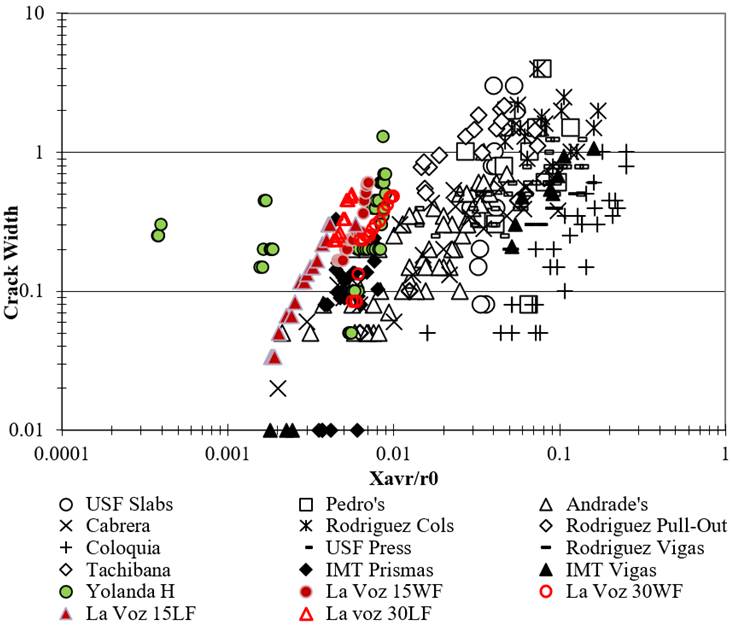
Figure 11 Data compilation of average maximum crack width in relation to the loss cross section area of the bar for different authors and test conditions (Torres-Acosta and Martínez-Madrid, 2003)
It is observed that in the case of accelerated corrosion methods, data follow a good trend and are close from each other (Torres-Acosta and Martínez-Madrid, 2003). There is also a difference between accelerated corrosion data from reinforced concrete (Δ, x, ◊, ○, ӿ, □ symbols) vs prestressed concrete (+ symbol) elements when general corrosion was obtained: wider cracks were observed from reinforced concrete elements than from prestressed concrete elements. If the corrosion is localized in a small area of the strand (- symbol) in prestressed concrete elements instead of general corrosion (+ symbol), the crack widths trend was similar than the obtained in reinforced concrete elements. Therefore, if the entire prestressed strand (or wire) is corroded, the crack propagation apparently was mitigated by the compressive state of stresses in the concrete, but if the prestressed strand (or wire) corrodes only in a short portion of the entire length, the crack propagation follows reinforced concrete elements trend.
On the other hand, natural corrosion data presented a more disperse performance than accelerated corrosion, as seen from the colored symbols. In general, the natural corrosion data follows similar trend than accelerated corrosion data, but with higher crack widening (higher Crack Width vs x/r0 slope). The higher crack propagation rate in natural corrosion tests may indicate that crack repair might be done earlier than the obtained from accelerated corrosion tests. This performance must be checked with collection of a larger data from the literature and data in the remaining DURACON project outcomes.
Data from this investigation follows a well-defined trend: less corrosion-induced material loss is required for cracks to appear at the concrete element surface. In natural conditions, like the present investigation’s specimens, the concrete is affected by the ingress of aggressive agents such as chlorides ions, which produce a localized rupture of the passive film until corrosion products are formed in sufficient amount to crack the concrete, which depends on concrete quality (internal porosity).
This cracking process on low quality concrete, may requires a smaller amount of corrosion products for crack formation and propagation (Torres-Acosta and Castro-Borges, 2013; Torres-Acosta et al., 2007). But compared with previous investigations with natural corrosion specimens exposed during a period between 3 and 6 years (■, ●, ♦ symbols), there is a difference of, approximately, 10 times the amount of mass needed to produce the same crack wideness.
It is important to remind that data from this investigation were obtained from electrochemical mass loss determinations, mainly linear polarization resistance (or also known as Rp). If corrosion were uniform, the faradaic metal loss might be twice as much as the estimated gravimetric metal loss, but if rebar corrosion is localized (i.e. pitting corrosion), the faradaic metal loss could be estimated even up to ten times the gravimetric metal loss (González et.al., 1995). All rebar radius loss data in Figure 11 was estimated from gravimetric procedure, except data from Hernández et.al.2016 (green color points) and the present investigation. Actual rebar loss estimates in these two investigations also have the particularity of being performed in highly porous concrete (with w/c ratio > 0.65), therefore, lower mechanical strength and easier crack formation is also expected.
Similar concrete type was used by Hernández et.al., 2016, to fabricate beams that were some of them loaded at the same time they were exposed to chloride rinse at the center of the beam elements to produce corrosion without using anodic currents. As seen in Figure 11, data from loaded beams (Hernández et.al., 2016) separate from all the natural and accelerated data to lower radius loss for same MCWavr opening. This performance might be due to not only the possible differences between gravimetric and the faradaic mass loss, but also from the applied tensile stresses from flexure loading application, that may increase the crack opening propagation rate. In same reference some other beams were unloaded, thus the MCWavr vs x/r0 data follows similar trend than the present investigation where concrete prism tested maintained unloaded during experimentation.
3.4 Empirical correlation between reinforcement corrosion rate and surface crack propagation rate
Figure 12 shows the crack width propagation vs. time of exposure. As observed in this figure, there is no correlation between rebar depth and crack propagation for these specimens located at La Voz, Venezuela, test site. Two of the cracks on each rebar depth behaved in the same range of maximum crack widths (between 0.05 and 0.3 mm), and only one of such cracks showed wider maximum crack (about 0.4 mm and above). The regression lines for each crack propagation are also shown in Figure 12, showing goodness fitness above 0.8. The slope of such regression lines are considered in this investigation as the surface crack propagation rate (SCPR in mm/month).
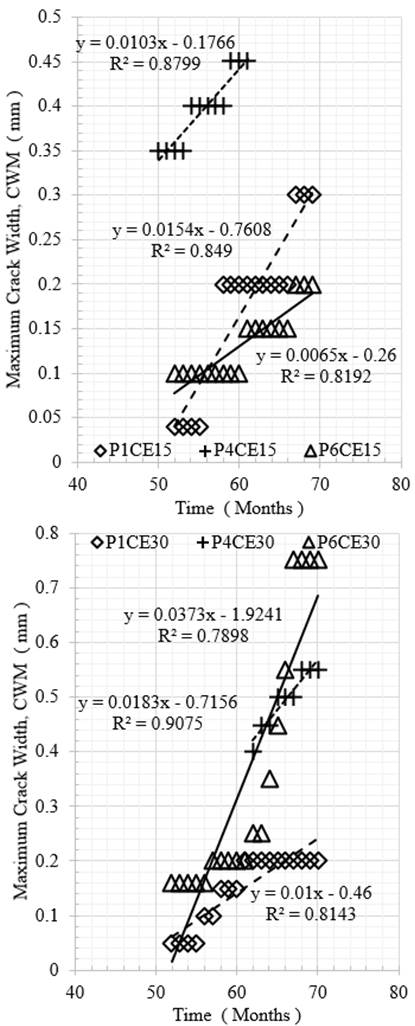
Figure 12 Crack propagation survey for w/c ratio 0.65 concrete specimen 1, windward face, La Voz, Venezuela, natural test site (a) 15 mm rebar depth and (b) 30 mm rebar depth
Based on the available data up to date, an empirical correlation between SCPR and iCORR results was performed and shown in Figure 13. As observed from this figure, there is not an apparent difference between the correlation for 15 mm and 30 mm. Upon further experimental data from the other w/c ratio concrete prisms in La Voz, Venezuela, test site and the other active corrosion prisms, when surface cracks appeared at the concrete element, the rate of widening is directly proportional to the iCORR of the rebar, which in turns is the expansive oxides to produce such cracks.
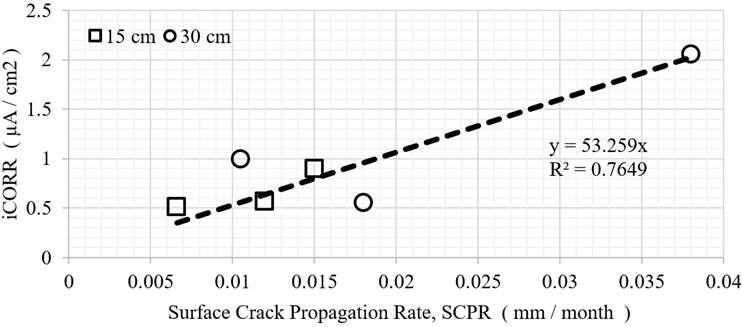
Figure 13 Empirical correlation between SCPR and iCORR, 0.65 w/c ratio concrete prisms, La Voz, Venezuela, natural test site
This empirical correlation will help to establish an indirect estimate of the corrosion rate of the reinforcing steel if the people in charge of the maintenance of the corroded structure is not able to have test equipment to determine such electrochemical values, and only a crack width survey is performed in a period of time for at least one year (12 months).
4. CONCLUSIONS
An excellent correlation between average maximum crack width (MCWAVER) and corrosion-induced radius loss (xAVG/r0) (rebar with 15 mm and 30 mm concrete cover, at windward and leeward faces, for 0.65 w/c ratio specimens) was found, which can be used to predict the rebar section loss for a given crack width.
MCWAVG vs x/r0 trend slope for natural corrosion data was higher than the obtained from accelerated corrosion data. This might reduce time for rehabilitation of corroded concrete elements in naturally exposed structures in marine environment.
An empirical correlation between surface crack propagation rate (SCPR) and iCORR was established for 0.65 w/c ratio prisms exposed to La Voz, Venezuela, test site, which can help to estimate iCORR indirectly if values of MCWAVR of corroding element are obtained in a period of time of at least one year.

