


 nueva página del texto (beta)
 Inglés (pdf)
 Artículo en XML
 Referencias del artículo
 Enviar artículo por email
 Citado por SciELO
  Similares en
SciELO
Similares en
SciELO 
 Permalink
1. Introduction
The People’s Republic of China (China-Beijing), like any global power, while changing inside, shapes to a different extent the international system and the global market. Thanks to improving their income, the Chinese have increased the quantities and widened the varieties of the products they eat.
The trade structure of the Asian country has been studied from different perspectives throughout the last couple of decades, unveiling a shift from low and medium-tech towards high-tech and basic products, including food (Hao & Xiaoqing, 2015; Fung et al., 2013; Wang et al., 2010). Lu & Li (2010) explain how different Chinese trade is when countries are divided by income, imports come from developing countries whereas exports go to middle-income countries.
Different studies suggest that the future of that country will shape many nations worldwide. As stated by Villoria (2009), the increase in Chinese imports has influenced the general levels of agricultural products around the globe, bringing benefits to some African countries along the way. The pressure for such products seems obvious, for feeding more than 1.3 billion people poses several challenges for a country that has to balance out both food security and a deepening of capital that implies a higher life quality accompanied by the demand for higher-value products.
China has consistently been one of the largest markets in the world, and its addition to the World Trade Organization in December 2001 only meant a greater trade flux in both directions.
Several researchers have documented shifts in consumption patterns caused by income increases in the Asian country. An example of this is well-documented in a paper by Scott & Suarez (2012), where they assured that the increased intake of potatoes was accompanied by the increased consumption of other commodities as was the case of cereals; similarly, Xiong & Song (2018) studied the same for avocados. Ren et al. (2018) reviewed the impact of income changes on food-products demand in rural China exposing a higher elasticity on meats, dairy, and aquatic products in different income scenarios. On the same path, Huang & Tian (2019) proved that accessibility was a determinant for non-farmers to improve their dietary consumption. In some cases, converging with what the nutritional authority recommended by increasing the consumption of oils and decreasing that of cereals, some grains, tubercles, etc.
This shift, specifically for Chinese grain imports, led to recent research contributions to stability, sustainability, and policies. Specifically, price volatility is widely studied by its financial derivatives (Xiao et al., 2019), direct and indirect relations to the energy market (Zhang et al., 2021), its price support policy (Lyu & Li, 2019), and land use policy (Liu & Zhou, 2021). Meanwhile, sustainability focuses on water distribution and footprint on grain production, such as water stress (Sun et al., 2019), water footprint (Ye et al., 2019), nitrogen-carbon footprints of dairy farm systems (Ledgard et al., 2019), and the established national policies on those matters (Qu et al., 2020).
Other global trends affect the production of food and food-related products. For instance, Li et al. (2021) surveyed college students and found that several factors, including green publicity and green atmosphere, influenced their perception and purchase intention of greener products. The international demand for products labeled as organic caused a more intensive use of land for their production in China (Xie et al., 2011), fighting for resources with the same goods without such distinction, and therefore, with lesser value increasing the level of intra-industry commerce. For further reference regarding shifting patterns, see Shao (2019).
It is noteworthy that China’s import and export patterns are influenced by the classic Ricardian production decisions and the government’s objectives. A clear example is that at the beginning of the century, a biofuel program was launched to meet the increasing demand for fuels and to dispose of the large amounts of accumulated grains that were no longer suitable even for feed (Qiu et al., 2011). The program later extended to other regions until all the stock was used up, and input demand forced imports to increase. The Chinese government tried to further regulate production towards more intensive use of specific cereals of lower qualities -to free up the rest for human consumption-; however, this affected the poorer portion of the population in China who could not afford higher-quality cereals (Koizumi, 2013).
The program impacted many areas, one of them being the use of land, which shifted from agriculture for human consumption to biofuel (Weng et al., 2019). When it was realized that biofuel production was competing for grains with livestock and humans, instead of reallocating investment, diversification of production inputs was urged, modifying trade patterns towards a higher import of maize, sugarcane, sweet potato, and sorghum (Qiu et al., 2011).
The case of potatoes is a good example. Previously used for feed, an increase in its price made it more expensive for that specific purpose, which might help explain first, potential shifts in its use towards human consumption and, second, other products’ imports during those years (Scott & Suarez, 2012).
Some publications regarding trade patterns have found that China had a dynamic comparative advantage throughout time (Hanson, 2012). This is expected due to shifting conditions for all implicated in international commerce. Other papers focused on the comparative advantages of specific countries. Such is the case of the China-Korea relationship, for which the signed Free-Trade Agreement (FTA) is expected to cause even further shifts in Trade (Kim & Shikher, 2015). China has a comparative advantage only in two of the analyzed sectors (Food and Wood), for which we expect an increase in trade of related products. Simulations in that study suggested that Korean exports to China would increase by a stunning 303%.
Several studies have been conducted on the relationship between China and other markets, for instance, China’s Revealed Comparative Advantage (RCA) is oriented towards higher-end items, importing food products from India (Khan & Ahmad, 2017), and, in general, agricultural products from some African countries (Jun et al., 2013). This aggregation oversees the composition of the country; a province-level study conducted by Li (2012) suggests that China is exporting agricultural labor-intensive products while importing land-intensive ones -also mentioned by Gale et al. (2015)-. This is consistent with a previous text where it was stated that what China imports are natural-resources intensive, where the countries of origin hold their comparative advantage (Lu & Li, 2010).
As previously stated, the Chinese Government, like any other, must ensure food supply without compromising independence, which translates as a constant need to look for trade partners. For instance, in a context where the US accounted for 24% of agricultural products by value in 2012-2013, China signed a zero-tariff treaty with some African countries substituting or adding trade partners to lower dependence (Gale et al., 2015). The goal of diversification becomes clear when analyzing the low complementarity between such countries, in other words, what China exports to the world is not what Africa imports, and what Africa exports is not what China imports most (Jun et al., 2013).
Other authors have decided to study specific products, for instance, Villasante et al. (2013) studied fish production, consumption, and imports to China. Besides being considered a luxury good in that country, fish protein intake grew exponentially along with Chinese participation in the world market. In 2005, China was already the principal importer by volume and the principal exporter both by volume and value, thus supporting the hypothesis of the author that the growth strategy consisted in importing low-value products mainly as feed for higher-value species, a similar strategy explains the growth of imports of grains and cereals being for feed (Gale et al., 2015).
The United States Department of Agriculture (USDA) suggests that China will continue its growth of agricultural imports well into 2023, with soybean as the main product and an expected rise of corn and meats (Gale et al., 2015).
Our research utilized data compiled from the available tools on the Uncomtrade website. A file was created with the time series of the 22 categories of food and food-related imports from 1992 to 2020 (See Annex A for full reference on each category). First differences were computed from the weight of each category relative to the total imports, resulting in a general overview of the commodity stability and the number and direction of extreme events marked as outliers. Subsequently, stationary tests were performed to determine whether these shocks would be temporary or remain in the medium-long haul.
Then, normality tests were performed for two reasons, first, to establish a priory behavior. Secondly, to identify whether a Spearman or Pearson correlation analysis would be a better fit. Such an analysis allowed for the determination of the apparent substitution of some commodities with others. The same exercise was applied at the level of origin of the imports, which implies a change in the structure of trade partners.
A proxy for market dependency is proposed with the number of needed exporters to cover 60% of imports by commodity classification -such threshold was deliberately chosen since the number of required partners to achieve 80% presented a quasi-exponential increment due to the spurious contribution of subsequent partners.
Finally, the nine biggest economies -leaving out China- were analyzed to determine their role in the substitutions, presenting which nations are being substituted by them or vice versa.
The rest of the paper is organized as follows: Section 2 includes Materials and Methods, while Results are detailed on section 3, Discussion on major findings can be consulted on section 4, concluding on section 5.
2. Materials and Methods
Throughout this part of the text, we analyze the trade of food and food-related items, classified into twenty-two categories by the Uncomtrade (2021). Though imports have not kept pace with exports, they behave as usual as most others, and both are closely correlated, showing a 0.9953 Pearson Correlation Coefficient for the studied period (1992-2020). In such a period, net exports stayed positive in all years, except for 1993, when they reached a net import total of 12.2 billion dollars (see Graph 1). It is possible to assert that total trade had grown exponentially after accession to WTO in 2001.
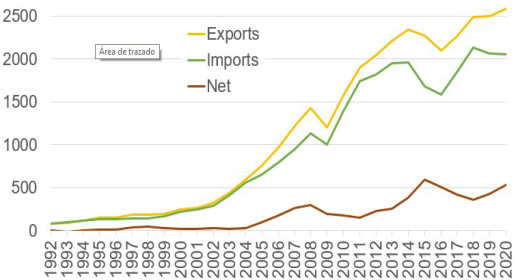
Source: Own elaboration with data from Uncomtrade (2021), expressed on billions of dollars.
Graph 1 China’s food Trade Balance
For the category level, transactions were expressed in their relative value compared to the total for each year to track the composition of the imports rather than the total change in value.
First differences were applied to resulting values, and outliers were determined for observations outside the interval [Q1-1.5IQR, Q3+1.5IQR] (Q1: First Quartile, Q3: Third Quartile, IQR: InterQuartile Range).
When two consecutive outliers in opposite tails were found, we assumed that the second one was a consequence of the former and was considered a rebound. Stable, not rebounded outliers would imply a gradual return or no return at all to previous stages. These results are shown along with normality and unit root tests in Table 1.
Table 1 Commodity import stability
| Commodity | Superior Outliers |
Inferior Outliers |
Rebound | Stable not rebounded Outliers |
Normality | Unit root | ||||||
| Shaphiro - Wilk 5% |
Kolmogorov - Smirnov 5% |
Anderson - Darling 5% |
AugmentedDickey - Fuller 5% |
|||||||||
| P-Value | Can’t reject normality |
P-Value | Can’t reject normality |
P-Value | Can’t reject normality |
P-Value | Can’t reject unit root |
|||||
| 01 | 0 | 0 | 0 | 0 | 0.589 | x | 1.000 | x | 0.534 | x | 0.000 | -- |
| 02 | 3 | 0 | 0 | 3 | 0.005 | -- | 0.406 | x | 0.002 | -- | 0.012 | -- |
| 03 | 0 | 0 | 0 | 0 | 0.184 | x | 0.303 | x | 0.078 | x | 0.000 | -- |
| 04 | 1 | 1 | 0 | 2 | 0.001 | -- | 0.338 | x | 0.003 | -- | 0.000 | -- |
| 05 | 2 | 1 | 0 | 3 | 0.034 | -- | 0.364 | x | 0.022 | -- | 0.015 | -- |
| 06 | 1 | 1 | 1 | 0 | 0.006 | -- | 0.501 | x | 0.014 | -- | 0.000 | -- |
| 07 | 2 | 1 | 1 | 1 | 0.685 | x | 0.765 | x | 0.387 | x | 0.000 | -- |
| 08 | 0 | 0 | 0 | 0 | 0.033 | -- | 0.433 | x | 0.012 | -- | 0.322 | x |
| 09 | 1 | 2 | 1 | 1 | 0.353 | x | 0.620 | x | 0.155 | x | 0.854 | x |
| 10 | 2 | 3 | 1 | 3 | 0.001 | -- | 0.171 | x | 0.000 | -- | 0.174 | x |
| 11 | 0 | 2 | 0 | 2 | 0.047 | -- | 0.484 | x | 0.089 | x | 0.781 | x |
| 12 | 0 | 0 | 0 | 0 | 0.082 | x | 0.303 | x | 0.034 | -- | 0.001 | -- |
| 13 | 1 | 1 | 1 | 0 | 0.000 | -- | 0.066 | x | 0.000 | -- | 0.000 | -- |
| 14 | 0 | 1 | 0 | 1 | 0.297 | x | 0.672 | x | 0.147 | x | 0.000 | -- |
| 15 | 1 | 0 | 0 | 1 | 0.010 | -- | 0.186 | x | 0.034 | -- | 0.001 | -- |
| 16 | 0 | 0 | 0 | 0 | 0.204 | x | 0.788 | x | 0.206 | x | 0.000 | -- |
| 17 | 1 | 1 | 0 | 2 | 0.212 | x | 0.715 | x | 0.139 | x | 0.055 | x |
| 18 | 2 | 1 | 1 | 1 | 0.409 | x | 0.794 | x | 0.259 | x | 0.186 | x |
| 19 | 0 | 0 | 0 | 0 | 0.869 | x | 0.858 | x | 0.651 | x | 0.006 | -- |
| 20 | 1 | 1 | 1 | 0 | 0.100 | x | 0.648 | x | 0.071 | x | 0.000 | -- |
| 21 | 0 | 2 | 0 | 2 | 0.176 | x | 0.563 | x | 0.119 | x | 0.000 | -- |
| 22 | 0 | 0 | 0 | 0 | 0.306 | x | 0.969 | x | 0.269 | x | 0.004 | -- |
| Total | 18 | 18 | 7 | 22 | 13 | 22 | 13 | 6 | ||||
Source: Own elaboration and computation, based on data from Uncomtrade (2021).
As previously mentioned, the presence of superior outliers implies that at that moment imports increased abruptly; and conversely, inferior outliers suggest a drop in imports of a given commodity. However, it is expected that at an extreme temporary event, the return to its trend could have been collected as an opposite outlier. A short description of the findings from Table 1 is presented below.
The combination of the identification of outliers and the Augmented Dickey-Fuller test for unit root yields impressive results. Let us take commodities 1 through 7 as examples (See Annex A for full reference on each category), they possess no unit root -thus, stationary processes are accepted. Extreme events in some time series did not impact the long-term mean reversion and are, therefore, interpreted as temporary. In the cases of commodities 8 and 12, although no extreme events were present, the existence of a unit root on commodity 8 implies minor structural changes that took place in a smoother manner, while for commodity 12, no structural changes were perceived.
Commodity 10 is one of the most variables, presenting five shocks, out of which, three were permanent and changed the long-term mean, confirmed by the presence of a unit root. Finally, commodity 17 presents one permanent outlier in each tail and is considered non-stationary.
It is easily appreciated that at this general level, a few anomalies are collected. It is also clear that some commodities present only lower-than-usual anomalies (cases of categories 11, 14, and 21). Some others show only higher-than-usual imports (categories 2 and 15), while categories 1, 3, 8, 12, 16, 19, and 22 present no meaningful distortions. The rest of them vary in both directions.

Source: Own elaboration with data from Uncomtrade (2021).
Graph 2 Commodities’ relative weight distribution
From the graphic, several things are noteworthy; for instance, 12 Oil seeds and oleaginous fruits are one with the highest participation in imports growing from less than 5% in 1995 to almost 50% in 2008, decreasing slowly to represent about 30% in 2020. Commodity 10 Cereals were substituted, decreasing from about 50% in 1992 to less than 10% in 1998, reaching its minimum in 2008. At the same time, those are two of the most variable categories in relative terms, allowing all observations on 12 Oil seeds and oleaginous fruits to fall into the typical behavior and consider no outliers. Commodity 10 Cereals presents several not rebounded outliers.
There are other groups with stable behavior and usually low participation in imports, such as 1 Live animals, 6 live trees, plants, bulbs, roots, cut flowers, etc., 9 Coffee, tea, mate, and spices, 13 Lac, gums, resins, vegetable saps, and extras nes, and the groups that include 16 Meat and seafood food preparations, 18 Cocoa and cocoa preparations, 20 Preparations of vegetables, fruit or nuts, and 21 Miscellaneous edible preparations.
We first identified the relative importance of each category, then we accepted normality on those series where the Kolmogorov-Smirnov, Shapiro-Wilk, and Anderson-Darling’s normality tests could not be rejected (Table 1). The following step was to create a simplified mixed Pearson (asterisk) and Spearman correlation coefficient matrix where the 22 categories were cross-correlated, giving a total of 231 different results. Only a hundred observations are statistically significant (p-value < 5%) as shown in Table 2. With it, we propose potential changes in consumption patterns, identifying which categories increase together, and which are being substituted. No causality is determined up to this point.
Table 2 Correlation coefficients
| 03* | 04 | 05 | 06 | 08 | 11 | 13 | 17* | 20* | 21* | 22* | |
| 01* | -0.47* | 0.40* | |||||||||
| 03* | 0.46 | 0.59 | 0.72 | 0.67 | 0.70 | 0.82* | 0.43* | 0.49* | |||
| 04 | 0.46 | 0.46 | 0.55 | 0.50 | 0.50 | 0.39 | |||||
| 05 | 0.59 | 0.46 | 0.52 | 0.62 | 0.41 | 0.42 | 0.53 | 0.44 | |||
| 06 | 0.72 | 0.55 | 0.52 | 0.45 | 0.39 | 0.66 | 0.74 | 0.53 | |||
| 07* | 0.57 | ||||||||||
| 08 | 0.67 | 0.62 | 0.45 | 0.38 | 0.61 | 0.41 | 0.48 | ||||
| 10 | -0.50 | -0.47 | -0.48 | -0.43 | |||||||
| 11 | 0.50 | 0.41 | 0.39 | 0.38 | 0.44 | 0.52 | 0.46 | ||||
| 12 | -0.53 | ||||||||||
| 13 | 0.70 | 0.50 | 0.42 | 0.66 | 0.61 | 0.44 | 0.59 | 0.46 | |||
| 16* | 0.40 | 0.47 | 0.39* | 0.43* | |||||||
| 18* | 0.50* | 0.50 | 0.62 | -0.39* | 0.44* | ||||||
| 19* | 0.57* | 0.42 | 0.43 | 0.67 | 0.41 | 0.43 | 0.55 | 0.63* | 0.64* | ||
| 20* | 0.82* | 0.39 | 0.53 | 0.74 | 0.41 | 0.52 | 0.59 | 0.50* | 0.59* | ||
| 21* | 0.43* | 0.44 | 0.46 | -0.57* | 0.50* | 0.38* | |||||
| 22* | 0.49* | 0.53 | 0.48 | 0.46 | 0.59* | 0.38* |
Notation: * stands for Pearson correlation, all others are determined using Spearman correlation due to normality conditions.
Source: Own elaboration and computation, based on data from Uncomtrade (2021).
Although all those correlations are statistically different from zero, the ones important for this text are the highest, both positive and negative. In the case of the negative correlations (where China is relatively substituting one commodity with the other), commodity 17 Sugars and sugar confectionery is quite relevant versus 21 Miscellaneous edible preparations (-0.567), 12 Oil seeds and oleaginous fruits (-0.529), and 1 Live animal; animal products (-0.468); Also, commodity 10 Cereals versus categories 1 Live animals; animal products (-0.501), 13 Lac, gums, resins, vegetable saps and extracts (-0.484) and 6 Trees and other plants, live (-0.47).
3. Results
In the case of the positive observations, category 3 Fish and crustaceans, mollusks, and other aquatic invertebrates typically moves in the same direction as categories 20 Cereal, flour, starch, milk preparations, 6 Trees and other plants, live, and 13 Lac, gums, resins, vegetable saps and extracts; presenting correlations of (0.817), (0.719), and (0.701), respectively, while categories 6 and 20 (0.736) are also strongly related.
Out of the 100 valid correlations, nine are negative, confirming that only specific categories are systematically replaced with others. Although further research must be done, it could help demonstrate a shift in consumption preferences or the level of specialization of the country.
Table 3 shows the number of trade partners needed to cover 60% of total imports per commodity. A lower figure indicates a high concentration of imports resulting in a higher dependence and a weaker position from China’s perspective.
Table 3 Imports dependence to 60%
| Year | Commodity | Total countries | |||||||||||||||||||||
| Concentrating | No trend | Diversifying | |||||||||||||||||||||
| 4 | 11 | 6 | 1 | 9 | 7 | 14 | 12 | 15 | 16 | 8 | 10 | 17 | 5 | 22 | 20 | 19 | 3 | 2 | 18 | 13 | 21 | ||
| 1992 | 7 | 3 | 4 | 2 | 3 | 3 | 4 | 4 | 4 | 1 | 6 | 2 | 1 | 3 | 2 | 3 | 3 | 5 | 2 | 1 | 5 | 3 | 24 |
| 1993 | 7 | 4 | 3 | 2 | 8 | 2 | 3 | 2 | 2 | 2 | 3 | 2 | 2 | 5 | 3 | 3 | 2 | 6 | 1 | 1 | 3 | 3 | 24 |
| 1994 | 6 | 5 | 3 | 3 | 7 | 2 | 6 | 2 | 3 | 4 | 3 | 2 | 2 | 5 | 3 | 4 | 2 | 6 | 1 | 1 | 3 | 2 | 23 |
| 1995 | 5 | 4 | 4 | 4 | 6 | 2 | 4 | 3 | 3 | 2 | 4 | 2 | 2 | 5 | 1 | 6 | 3 | 5 | 1 | 2 | 4 | 2 | 29 |
| 1996 | 5 | 5 | 4 | 4 | 3 | 3 | 4 | 1 | 2 | 4 | 2 | 2 | 2 | 4 | 4 | 5 | 4 | 5 | 1 | 2 | 4 | 1 | 26 |
| 1997 | 4 | 5 | 4 | 5 | 7 | 3 | 4 | 1 | 3 | 4 | 2 | 2 | 2 | 4 | 3 | 6 | 6 | 4 | 2 | 2 | 4 | 2 | 27 |
| 1998 | 4 | 5 | 3 | 5 | 4 | 3 | 4 | 3 | 4 | 1 | 3 | 2 | 2 | 4 | 3 | 4 | 5 | 3 | 2 | 3 | 3 | 2 | 30 |
| 1999 | 3 | 5 | 2 | 3 | 5 | 3 | 4 | 3 | 3 | 2 | 4 | 3 | 4 | 6 | 3 | 3 | 3 | 4 | 2 | 3 | 3 | 2 | 26 |
| 2000 | 3 | 6 | 2 | 5 | 4 | 4 | 5 | 3 | 3 | 3 | 4 | 3 | 4 | 6 | 3 | 2 | 3 | 6 | 1 | 3 | 3 | 2 | 27 |
| 2001 | 3 | 5 | 2 | 4 | 4 | 2 | 5 | 2 | 2 | 4 | 4 | 2 | 3 | 5 | 4 | 2 | 3 | 5 | 1 | 5 | 5 | 2 | 29 |
| 2002 | 2 | 3 | 2 | 3 | 4 | 2 | 3 | 2 | 3 | 4 | 4 | 2 | 3 | 3 | 3 | 2 | 5 | 4 | 1 | 5 | 5 | 2 | 28 |
| 2003 | 2 | 3 | 2 | 2 | 5 | 1 | 5 | 2 | 2 | 4 | 4 | 3 | 3 | 3 | 3 | 2 | 5 | 4 | 1 | 6 | 4 | 2 | 30 |
| 2004 | 2 | 3 | 2 | 2 | 6 | 1 | 5 | 2 | 3 | 7 | 4 | 2 | 3 | 4 | 3 | 2 | 4 | 4 | 3 | 6 | 7 | 2 | 30 |
| 2005 | 2 | 3 | 2 | 2 | 6 | 1 | 4 | 2 | 2 | 7 | 4 | 2 | 4 | 5 | 2 | 2 | 5 | 4 | 2 | 5 | 7 | 4 | 32 |
| 2006 | 2 | 2 | 2 | 3 | 4 | 1 | 4 | 2 | 2 | 6 | 4 | 2 | 3 | 5 | 2 | 2 | 4 | 4 | 2 | 5 | 7 | 3 | 29 |
| 2007 | 3 | 2 | 2 | 3 | 4 | 2 | 4 | 2 | 2 | 7 | 4 | 2 | 4 | 5 | 2 | 2 | 4 | 4 | 2 | 5 | 7 | 4 | 33 |
| 2008 | 3 | 1 | 2 | 2 | 4 | 2 | 3 | 2 | 3 | 4 | 4 | 2 | 3 | 5 | 2 | 2 | 4 | 5 | 2 | 4 | 6 | 5 | 30 |
| 2009 | 2 | 2 | 2 | 3 | 5 | 2 | 4 | 2 | 2 | 4 | 3 | 3 | 3 | 4 | 2 | 3 | 3 | 4 | 2 | 5 | 6 | 6 | 27 |
| 2010 | 1 | 1 | 2 | 2 | 5 | 1 | 5 | 2 | 2 | 2 | 4 | 2 | 2 | 4 | 2 | 2 | 4 | 4 | 4 | 5 | 7 | 6 | 29 |
| 2011 | 1 | 2 | 2 | 3 | 4 | 2 | 4 | 2 | 2 | 1 | 4 | 2 | 2 | 6 | 2 | 3 | 5 | 4 | 3 | 5 | 7 | 7 | 29 |
| 2012 | 1 | 2 | 2 | 3 | 3 | 2 | 4 | 2 | 2 | 1 | 4 | 2 | 2 | 5 | 2 | 4 | 6 | 5 | 4 | 5 | 6 | 7 | 29 |
| 2013 | 1 | 1 | 2 | 2 | 4 | 2 | 3 | 2 | 3 | 2 | 3 | 2 | 1 | 6 | 3 | 5 | 6 | 6 | 5 | 6 | 6 | 7 | 28 |
| 2014 | 1 | 1 | 2 | 2 | 5 | 1 | 3 | 2 | 2 | 1 | 4 | 2 | 2 | 6 | 4 | 6 | 7 | 6 | 5 | 7 | 8 | 7 | 32 |
| 2015 | 2 | 1 | 2 | 2 | 5 | 1 | 3 | 2 | 2 | 2 | 4 | 3 | 3 | 5 | 5 | 5 | 6 | 7 | 6 | 7 | 9 | 8 | 33 |
| 2016 | 2 | 1 | 2 | 2 | 2 | 1 | 4 | 2 | 3 | 4 | 4 | 3 | 2 | 6 | 4 | 5 | 6 | 7 | 6 | 7 | 8 | 7 | 31 |
| 2017 | 2 | 2 | 2 | 3 | 7 | 2 | 3 | 2 | 2 | 3 | 5 | 3 | 4 | 6 | 4 | 6 | 5 | 7 | 6 | 7 | 9 | 6 | 35 |
| 2018 | 2 | 1 | 2 | 2 | 5 | 2 | 3 | 1 | 3 | 4 | 4 | 4 | 7 | 6 | 5 | 6 | 4 | 8 | 5 | 6 | 8 | 6 | 34 |
| 2019 | 2 | 2 | 2 | 2 | 4 | 2 | 3 | 2 | 3 | 4 | 4 | 4 | 4 | 6 | 5 | 6 | 4 | 8 | 5 | 6 | 8 | 6 | 35 |
Source: Own elaboration and computation, based on data from Uncomtrade (2021).
We computed the number of partners needed to cover 60% of imports for each of the 22 categories as a quick reference for dependency concentration; diversification of strategic commodities’ origins might be an element of food security. When analyzing the indicator, the positive trend suggests that there might be a proclivity towards lowering dependence - interpreted as diluting the imports amongst more exporters. The year China’s imports were more concentrated was 1994, needing 23 partners to cover 60% of all food imports, while the lowest concentration came in 2017 and 2019, with a total of 35 partners.
The categories in Table 3 are classified according to their slope in linear regression. The ones at the left (categories 4, 11, 6, 1, and 9) present a tendency to concentrate dependence on fewer countries with a maximum of three partners at the end of the period; on the other hand, categories 2, 18, 13, and 21 have a clear path towards diversification of suppliers contributing to a healthier dependence by doubling the number of partners needed in 1992.
Table 4 Major economies and their relations to other exporters
| Country | Commodity | Related Country | Country | Commodity | Related Country | ||
| USA | ↓↑ | 2,18,19 | Belgium-Luxembourg | Japan | ↓↑ | 2* | Australia |
| 2*, 5*, 12* | China, Hong Kong SAR | 2, 7 | Canada | ||||
| 8, 9, 13, 17, 20 | Free Zones | 7 | Chile | ||||
| 2* | Japan | 13 | China, Hong Kong SAR | ||||
| 16* | Myanmar | 2 | Denmark | ||||
| 13* | Other Asia, nes | 2 | France | ||||
| 6,7,12 | Singapore | 8 | Free Zones | ||||
| 17 | Uzbekistan | 14* | India | ||||
| 4* | Viet Nam | 1 | Israel | ||||
| United Kingdom | ↓↑ | 11* | Belgium | 2*, 7* | New Zealand | ||
| 19, 22 | Belgium-Luxembourg | 3 | SACU | ||||
| 11* | Chile | 7* | United Kingdom | ||||
| 13 | China, Hong Kong SAR | 2* | Uruguay | ||||
| 11 | Rep. of Korea | 2 | USA | ||||
| 22 | Free Zones | ↓↑ | 12 | Brazil | |||
| 11 | Germany | 12, 22 | Czechia | ||||
| 7 | Japan | 12 | Italy | ||||
| 13* | Other Asia, nes | 12 | Thailand | ||||
| 6 | Singapore | Canada | ↓↑ | 5 | China Hong Kong SAR | ||
| 22 | SACU | 9, 17 | Free Zones | ||||
| 11 | Thailand | 1 | Israel | ||||
| ↓↑ | 2 | Chile | 2*, 7* | Japan | |||
| 9 | Poland | 15 | Nepal | ||||
| 9 | Sri Lanka | 16 | Netherlands | ||||
| France | ↓↑ | 21 | Belgium-Luxembourg | 12 | Singapore | ||
| 2, 5 | China, Hong Kong SAR | 4* | Thailand | ||||
| 2* | Japan | ↓↑ | 22 | Italy | |||
| 16* | Myanmar | 21 | New Zealand | ||||
| 22 | SACU | 3 | Philippines | ||||
| 4* | Viet Nam | Italy | ↓↑ | 18 | Belgium-Luxembourg | ||
| ↓↑ | 18 | Belgium | 15 | Nepal | |||
| 20 | India | ↓↑ | 9 | Brazil | |||
| 4 | Netherlands | 22 | Canada | ||||
| 20 | Other Asia, nes | 22 | Chile | ||||
| 20 | Thailand | 18 | Germany | ||||
| Germany | ↓↑ | 11* | China, Macao SAR | 22 | Hungary | ||
| 8 | Free Zones | 12 | Japan | ||||
| 1 | Israel | 2 | Mexico | ||||
| 8 | Singapore | 22 | New Zealand | ||||
| 11* | United Kingdom | 9 | Poland | ||||
| ↓↑ | 4 | Australia | 19 | Rep. of Korea | |||
| 10 | China, Macao SAR | 19 | Spain | ||||
| 10 | Ireland | 9 | Sri Lanka | ||||
| 18 | Italy | 2 | Switzerland | ||||
| 17 | Malaysia | 21 | Thailand | ||||
| 4, 10 | Netherlands | Brazil | 18, 19, 21 | Belgium-Luxembourg | |||
| 21 | Thailand | 20, 21 | Free Zones | ||||
| India | ↓↑ | 21 | Belgium-Luxembourg | 20 | SACU | ||
| 5, 6 | China, Hong Kong SAR | 4* | Viet Nam | ||||
| 14 | Japan | ↓↑ | 16 | Côte d'Ivoire | |||
| 14* | Myanmar | 9 | Colombia | ||||
| 15 | Nepal | 7 | Costa Rica | ||||
| ↓↑ | 3 | Ecuador | 12 | Czechia | |||
| 20 | France | 9 | Ethiopia | ||||
| 15 | Indonesia | 12 | Indonesia | ||||
| 15 | Norway | 9 | Italy | ||||
| 15 | Spain | 12 | Japan | ||||
| Nepal | 1 | ||||||
Notation: ⇉, stands for same direction relation, ⇆ stands for opposite direction relation and *stands for share lose by the country by the related country on the specified commodity. Source: Own elaboration and computation, based on data from Uncomtrade (2021).
4. Discussion
The pinnacle of this research is the identification of nations from which the Asian country has systematically acquired less in favor of others. Within the American block, we find that the USA has been losing sales to Hong Kong in 2 Meat and edible meat offal; 5 Products of animal origin, nes; and 12 Oil seeds and oleaginous fruits. At the same time, it is losing ground to Japan in 2 Meat and edible meat offal, to Myanmar in 16 Meat and seafood food preparations, and to Others, in Asia in 13 Lac, gums, resins, vegetable saps, and extracts. Japan is taking the place of Canada as a supplier in 2 Meat and edible meat offal, and 7 Edible vegetables, roots, and tubers; at the same time, to Thailand in 4 Dairy products, eggs, and honey. Vietnam is keeping some of Brazil’s share in the latter category.
In Europe, France’s sales have fallen in the categories of 2 Meat and edible meat offal to Japan, 16 Meat and seafood food preparations to Myanmar, and 4 Dairy products, eggs, and honey to Vietnam.
The United Kingdom has granted exports to Belgium and other countries from Asia in classifications of 11 Milling products and 13 Lac, gums, resins, vegetable saps, and extracts, respectively. Germany is losing sales of 11 Milling products in favor of Macao and the U. K. The Italian case is not statistically relevant.
Finally, in the Asian block, Japan is losing ground to Australia in 2 Meat and edible meat offal, to India in 14 Vegetable plaiting materials, to New Zealand in 2 Meat and edible meat offal; Japan is losing sales of 7 Edible vegetables, roots, and tubers to both New Zealand and the United Kingdom; and to Uruguay in 2 Meat and edible meat offal. India is giving space to Myanmar in 14 Vegetable planting materials.
It is interesting to note that some countries are increasing sales of some commodities while decreasing sales in other categories, which could imply that the country is specializing in some products. In such situations, we find Brazil losing in 4 Dairy products, eggs, and honey while gaining ground in 18 Cocoa and cocoa preparations; 19 Cereal, flour, starch, milk preparations and products; 20 Preparations of vegetables, fruit, or nuts; and 21 Miscellaneous edible preparations.
On the same path, we find that Canada is specializing in 1 Live animal; animal products; 5 Products of animal origin, nes; 9 Coffee, tea, mate and spices; 17 Sugars and sugar confectionery; 12 Oil seeds and oleaginous fruits; miscellaneous grains, seeds, and fruit; industrial or medicinal plants; straw and fodder; 15 Animal or vegetable fats and oils and their cleavage products; and 16 Meat, fish and seafood food preparations nes. At the same time, Canadian exports are slowing pace in categories: 2 Meat and edible meat offal; 4 Dairy products, eggs, honey, edible animal product nes; and 7 Edible vegetables and certain roots and tubers.
Germany is specializing in 1 Live animal; animal products and 8 Edible fruit, nuts, peel of citrus fruit; while losing ground in 11 Milling products.
The rest of the analyzed economies have some commodities in which they gain ground against one partner but lose to another in the same commodities, this might mean that there is a dynamic comparative advantage in those products.
5. Concluding remarks
Globalization has impacted many aspects of life, trade is one of them. Neoliberalism policies favored the segmentation of the production chain into many smaller, more fragmented value-adding steps. This, along with a deepening of the commerce partnerships and the need to balance out internal and external consumption and production shifts, results in shocks to national accounts via imports and exports.
Some of these shocks result in temporary movements that fade out one period later. Some others maintain their effects over subsequent periods; those were the cases of 8 Edible fruit, nuts, peel of citrus fruit, 9 Coffee, tea, mate and spices, 10 Cereals, 11 Milling products, 17 Sugars, and sugar confectionery, and 18 Cocoa and cocoa preparations.
Over the studied period, China has decreased the import of products from category 17 Sugars and sugar confectionery mainly in favor of 21 Miscellaneous edible preparations, 12 Oil seeds and oleaginous fruits, and 1 Live animal; animal product. In the same sense, 10 Cereals decreased in favor of products from categories 1 Live animals; animal products, 13 Lac, gums, resins, vegetable saps, and extracts, and 6 Trees and other plants, live.
In general, the number of partners needed to cover 60% of the total imports of each category has been increasing over the years, starting with approximately 24 trade partners and adding ten more to end up with 34. Specific cases that are worth mentioning are, on the one hand, categories 4 Dairy products, eggs, honey, 11 Milling products, 6 Trees and other plants, live, 1 Live animals; animal products, and 9 Coffee, tea, mate and spices, tend to concentrate dependence on fewer countries ending in a maximum of three partners; on the other hand, categories 21 Miscellaneous edible preparations, 2 Meat, and edible meat offal, 13 Lac, gums, resins, vegetable saps and extracts, and 18 Cocoa and cocoa preparations, have a clear path towards diversification of suppliers contributing to a healthier dependence by doubling the number of partners needed in 1992.
The identification of instances in which the Asian nation has systematically acquired less in favor of others is the research’s crowning achievement. Within the American block, we observe that the United States has lost business to Hong Kong (commodities 2, 5, 12), Japan (2), Myanmar (16), Vietnam (4), and others, Asia (13); whereas Canada has been losing sales to Thailand and Japan (commodities 2 and 7). Vietnam’s relevance to Brazil’s exports of commodity 4 is diminishing.
France’s sales of commodities 2, 16, and 4 have decreased in Europe (to Japan, Myanmar, and Vietnam, respectively); while the United Kingdom has conceded products to Belgium and others, Asia in commodities 11 and 13, separately. The Italian case is not statistically significant. While Germany loses sales of commodity 11 to Macao and the United Kingdom.
Lastly, in the Asian block, Japan is falling behind Australia in commodity 2, India in commodity 14, New Zealand in commodities 2 and 7, the United Kingdom in commodity 7, and Uruguay in commodity 2. While Myanmar is given space in commodity 14 by India.
The existence of statistically significant substitutions does not necessarily mean that there is an explicit policy of the Chinese Government being carried out and should be interpreted carefully, for they could respond to many different factors, including further specialization of the involved nations, foreign direct investment, cooperation between countries, to mention a few.

