


 nueva página del texto (beta)
 Inglés (pdf)
 Artículo en XML
 Referencias del artículo
 Enviar artículo por email
 Citado por SciELO
  Similares en
SciELO
Similares en
SciELO 
 Permalink
Introduction
The economic relevance of ports derives from the fact that most of the international trading activities are performed at sea, amounting to more than 80% of all merchandise traded internationally. Globalization -which implies a decentralization of the production process-, economic liberalization, and the creation of trade areas have resulted in an on-going expansion of commercial interchange through marine traffic and port activity. Thus, maritime ports and the port facilities, machinery and equipment used in international trade play a fundamental economic role. Ports, being a subsystem of the total transportation network and a meeting point for several different transportation means, constitute economic infrastructure that is necessary to handle domestic and international cargo (Park and De, 2004: 53). Ports contribute to a country’s development not only as a result of their major significance for outbound traffic but also their function as growth promoters in their own impact areas, producing certain traffic lines, generating national income (through port duty fees), and creating jobs among other effects (Rúa, 2006: 2).
There is, however, wide variation in the extent to which ports can be considered efficient: many fail to avoid dead times with their gantry cranes and make inadequate use of the other port facilities. Efficiency levels in ports greatly affect the competitiveness of countries as ports represent an essential link in the transportation chain. Efficient conduct results lower export prices, favoring the competitiveness of international market products. Inefficient port functioning affects the cost of importing and exporting goods, having a negative effect on a nation’s competitiveness. In an inefficient port and its inefficient logistic chain, a thorough redefinition of processes and operations must be developed promptly (Doerr and Sánchez, 2006: 7-14). In order to maintain a competitive position in such markets, nations need to know the factors that affect port efficiency and to establish frequent comparisons of efficiency among all ports that make up their national sector and contrast them with ports from different regions. (González, 2004: 9-11). Moreover, an efficient port increases the productivity of the primary factors of production (labor and capital) as well as the feasibility of production units, which allow greater levels of production, income and employment. Efficiency optimization in a port system improves a nation’s access to international markets, leading to an increase in trade and, therefore, potentially to a higher income. Monitoring a port’s performance in an ever-changing environment is crucial for measuring its efficiency levels as well as its competitiveness (Park and De, 2004: 53-54). Under this competitive environment, port efficiency assessment is not only a powerful administrative tool, but it also constitutes the most important input needed to complete regional and national operation reports and port planning (Wang, Cullinane & Song, 2003: 699).
Despite the clear economic importance of port efficiency, there are deficiencies in the manner in which this efficiency is assessed. Drawing on literature on the efficiency of firms, we develop two manners of assessing and comparing the efficiency of ports. The main attraction of DEA is that it can deal with multiple inputs and outputs. The units in any DEA assessment are generally homogeneous and independent units performing the same function, and it is of most use where there are a large number of units providing an ‘identical’ service in relative isolation (Szczepura, Daviles & Fletcher, 1992: 3). In addition, Roll and Hayuth (1993: 160)argued that DEA is an easily adaptable approach for obtaining such ratings. It also opens the possibility for a series of secondary analyses, all providing a deeper insight into port performance and pointing out potentials for improvement. International trade organizations -such as that established by the Asia-Pacific Economic Cooperation (APEC) treaty- hold potential to increase the efficiency of ports within their member countries by increasing trade volume. We thus constrain our analysis to ports in the member states of APEC. In what follows, we discuss efficiency theory and derive our two measures for port efficiency. Then we assess the efficiency of 33 ports in member countries of APEC over an eight-year period from 2003-2010. We discuss the implications of the two measurements and the broader implications for the administration of marine ports.
Efficiency Theory
In the long run, efficiency implies benefit maximization and cost minimization. Farell (1957: 254) first introduced the basic theoretical framework to study and assess efficiency. He proposed monitoring efficiency from a real, rather than ideal, perspective, and suggested that each firm or productive unit be evaluated in relation to those taken from a representative and homogenous group. This way, the efficiency measure will be relative, not absolute, and the added value of efficiency in a particular firm will correspond to a deviation from those considered efficient. Farrell (1957: 259-262) also divided the concept of efficiency into two components, technical efficiency and allocative efficiency, which in combination provide a measure of overall economic efficiency. This measure indicates the need for a society to maximize its benefits within its limited resources (Arzubi and Berbel, 2002: 106). Thus, “economic efficiency is considered to be the achievement of maximum production at the lowest price possible” (Pinzón, 2003: 17). Moreover, Farell himself defined economic efficiency as the capacity of a firm to produce a predetermined quantity of output at minimum cost for a given level of technology. A correct provision of both technical and allocative efficiency is necessary in order for cost efficiency, income efficiency, and benefit efficiency to exist. The following sections outline the key points of technical and allocative efficiency.
Technical or Productive Efficiency
The first component of economic efficiency is technical, or productive, efficiency, which has been defined in several different manners in the literature. To Koopmans (1951: 33) a producer is technically efficient if an increase in any output or a decrease in any input requires a decrease in at least one other output, or an increase in at least one input. Thus, for each technology for which isoquant and efficient subset diverge, there is a potential conflict between both technical efficiency concepts.
Debreu (1951: 16) and Farrell (1957: 259) developed a measure of technical efficiency, initially termed as the coefficient of resource utilization, and defined as one minus the maximum equiproportionate reduction in all inputs that still allows the production process to continue.
Yarad (1990: 183) concurs that technical efficiency consists of obtaining maximum physical production possible, based on existing technology, from certain number of inputs.
On the other hand, González-Páramo (1995: 40) affirms that technical or productive efficiency in a company is given by its capacity to transform inputs (labor, capital, and other factors) into outputs (goods or services) in the context of a technology, which can be summarized with a production function setting maximum value or the “borderline” of attainable output within several input combinations.
Trillo (2002: 5) argues that the study of technical or productive efficiency mainly focuses on the use of human resources or capital in the production of one or many goods and services. In other words, he focuses on using physical units, which implies that the cost or price of factors and the valuation of the income received through production remain beyond analysis.
The concept of efficient production function means that technical efficiency in any firm is assessed in relation to the group of firms from which such function has been estimated. If any more firms are introduced in the analysis, they could cause a reduction, but not an increase in the technical efficiency of a certain firm. The heterogeneity of factors will not be relevant as long as it is equally distributed in relation to all companies. Technical efficiency in a firm will demonstrate input quality and managerial efficiency when some differences in the average quality of firms (specifically in quality distribution) arise. If such quality differences are physically measurable, it would be possible to reduce this effect by defining a wide number of relatively homogenous production factors. However, it would never be possible to eliminate them completely in practice. For this reason, technical efficiency in a firm should, to a certain extent, display input quality; it is impossible to measure managerial efficiency apart from its factors. Thus, technical efficiency is defined in relation to a certain group of firms and to a certain group of particularly measured factors. Any change made to such specifications will affect measurement (Farell, 1957: 259-260).
Pure technical efficiency shows the extent to which the analyzed productive unit fulfills maximum exploitation of the physical resources available. Moreover, efficiency of scale is relevant when production technology presents variable yields of scale. This type of efficiency shows if the analyzed productive unit has reached optimal scale point. Yields of scale result from equally increasing the quantity of all factors involved in the production function. There are three kinds of yields of scale (Varian, 1998: 331-333):
Constant Return Scale. If the quantity of each factor increases, production increases in the same proportion.
Growing Return Scale. If the quantity of each factor increases, production increases in a greater proportion.
Decreasing Return Scale. When the quantity of each factor increases, production increases in a minor proportion.
In this manner, global technical efficiency represents the combination of both pure technical and scale efficiencies. Technology is considered a key element to understand the concept of technical efficiency. Companies confront technological restrictions since there are only a few feasible factor combinations needed to obtain a certain amount of production. Companies, then, should limit themselves to adopting production plans that appear feasible from a technological point of view. Thus, the group of all factor combinations and technologically feasible products are called production group. This group shows all possible technological choices in the company.
In the event that factors represent a cost to the company, it becomes necessary to analyze the maximum production possible corresponding to a certain number of factors. This is what is known as the borderline of the production group, which measures the maximum production value that can be obtained through a certain number of factors. This leads to the concept of the isoquant, which is the total sum of all possible combinations of factors needed to obtain a certain amount of production (Varian, 1998: 331-333).
Allocative Efficiency
Allocative efficiency is based on the microeconomic theory, particularly on Pareto’s theory (Ali, 1994: 4). Nonetheless, other authors have provided definitions according to its function as an element of economic efficiency, as presented here:
In microeconomics, allocative efficiency is achieved when resources are not wasted and Pareto’s principle is observed. There are three basic conditions to be meet efficiency in allocation: Economic Efficiency, which involves technological efficiency (or technical), as well as the use of production factors in such proportions in which costs are minimized.
Consumer Efficiency, which occurs when consumers fail to improve after reassigning their budgets.
Marginal cost equality (cost of producing an additional product unit, including external costs) and marginal social benefit (benefit of an additional consumption unit, including external benefits).
Hernández Laos (1985: 44) claims that allocative efficiency refers to the allocation of resources, which means assigning a fixed number of resources in fluctuating situations with the purpose of maximizing the product’s quantity or satisfaction, whether the analysis focuses on the production or the consumption area. Yarad (1990: 183) argues that allocative or cost efficiency refers to the fact that the total monetary investment in inputs used to produce a certain number of goods is the minimum possible according to the price of such inputs.
González-Páramo (1995: 41) affirms that allocative or price efficiency happens when a company maximizes benefits or minimizes costs: when the administrator of a production unit has managed to not only reaches the borderline group of production but also selects the combination of factors that allows him to minimize costs at a certain production level (Bosch, Navarro & Giovagnoli, 1999: 7). Under this condition, price signals should remain efficient in terms of economy; that is, they should approach an optimal allocation as per (Ali, 1994: 4-5).
General Features of Data Envelopement Analysis (DEA) Models
The use of the DEA technique has been focused on the field of production for the assessment of efficiency; that is, for providing the necessary estimates of productivity. We push the use of DEA models into the assessment of the efficiency of marine ports. Although this is not the customary use of this kind of analysis, we believe is an appropriate means the efficiency of these units, and taking into consideration factors such as labor costs, which have previously been ignored. The definition of efficiency used in the model is provided by (Mercado, Díaz & Flores, 1997: 17):

Overall, efficiency can be defined as:
 (1)
(1)
Or formally
 (2)
(2)
Where E represents efficiency, x i and y i are inputs and outputs respectively, whereas u i and v i represent parameters that show the relative importance of each one of the parameters.
If the relative importance of each one of the inputs and outputs were known a priori, the main problem of efficiency evaluation would be over; however, this information is generally unknown. Efficiency assessment usually involves multiple inputs and outputs; thus, they must be selected according to the definition of the problem under study. Methodologically, the research structure of DEA models, in which these aspects and elements are observed, leads not only to productivity analysis based on the DEA technique but also to an alternative proposal to improve efficiency. The central concern is performance evaluation, in particular the evaluation of activities in organizations such as business firms, government agencies, hospitals, educational institutions, etc. Such evaluations adopt a variety of manners in a habitual analysis. Some examples include cost per unit, benefit per unit, satisfaction per unit, and so on. These are established measurements in the form of a relation as follows:
 (3)
(3)
This efficiency measurement is commonly used. The usual measurement of “productivity” also adopts a relation used to evaluate the performance of a worker or employee. “Output per worker-hour” and “output per employee worker” are examples with sales, benefits or any other measurements of output appearing in the counter. Such measurements are sometimes referred to as “partial productivity measures.” This terminology is oriented to telling them apart from the so-called “measures of total productivity of factors” since it aims to obtain an input-output value relation that considers all inputs and outputs.
Moving away from the partial measurements of productivity and toward the total productivity measures of factors, combining all inputs and outputs in order to obtain a unique relation, helps avoid the misattribution of the earnings of certain input or output to a different one. For instance, an output earning resulting from a capital increase or improved administration could mistakenly be attributed to labor (when a unique output-input relation is being used). However, intending to move from partial to total measurements will bring about difficulties such as choosing the inputs and outputs to be considered and the weights to be used in order to obtain a relation of only one output to only one input. This will come down to only one way.
Other problems and limitations can also occur in traditional efforts to evaluate productivity or efficiency when multiple outputs and multiple inputs need to be taken into account. The relatively new approach incorporated in DEA does not require that the user prescribe weights to be attached on each input and output, as in the case of the traditional approaches of number indexes. Nor does it require prescription of functional forms necessary in statistical regression approaches. Rather DEA uses techniques such as mathematical programming that can handle great numbers of variables and relations (restrictions). This waters down the requirements usually found when there is the limitation of choosing only a few inputs and outputs because of the limitations of the technique in use. Relaxing conditions about the number of candidates to be used in calculating the desired evaluation measurements makes it easier to deal with complex problems and to deal with other considerations that would probably be confronted in several contexts of social policy and management. In addition, the wide array of theory and methodology available for mathematical programming can be carried out in order to affect calculations. This is due to the fact that a great portion of what is needed has already been developed and adapted for use in many prior DEA applications (Cooper, Seiford & Tone, 2000: 1-2).
The Basic Model CCR (Charnes, Cooper & Rhodes)
In order to allow applications for a wide variety of activities, the term decision-making unit (DMU) will be used to refer to any entity (port) that is evaluated in terms of its capability of converting inputs into outputs. Such evaluations may involve government agencies and non-profit organizations along with business firms (Cooper, Seiford & Zhu, 2004: 8). Optimal weights can (and generally do) vary from one DMU to another. For this reason, the so-called “weights” in the DEA are derived from data instead of remaining fixed beforehand. Each DMU is assigned the best weight group with ranging values from one DMU to another (Cooper et al., 2000: 22).
Assuming there are n DMUs; DMU1, DMU2, …, DMUn. Some common items of inputs and outputs for each one of the j = 1, …, n DMUs are selected as follows:
Numerical data are available for each input and output, with data assumed to be positive for all DMUs. The items (inputs, outputs and the election of DMUs) should bring forth an interest in analysis and management of components that will take place in the evaluation of DMU’s relative efficiency. By principle, smaller amounts of input and greater amounts of output are preferable; thus, the efficiency outcomes must illustrate such principles.
The measurement units of the different inputs and outputs are not necessarily congruent. Some of them may involve a number of people, room availability, expenditures, etc.
Supposing m inputs and s outputs are selected with the above mentioned properties 1 and 2. Being the input and output data for DMUj (xlj, x2j,..., x mj ) and (ylj, y2j,..., y sj ), respectively. Input X data matrix and input Y data matrix may be laid out as follows, where X is an (m x n) matrix and Y is an (s x n) matrix (Cooper et al., 2000: 22-23):
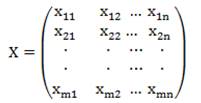 (4)
(4)
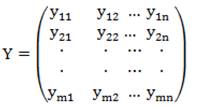 (5)
(5)
Each DMU consumes quantities of different m inputs to produce different s outputs. Specifically, the DMU j consumes i x ij input amounts and produces r y rj output amounts. This assumes x ij > 0 and y rj > 0, and that each DMU has at least one positive input value and one positive output value (Cooper, et al., 2004: 8).
Now, we return DEA’s ratio-form. In this form, as introduced by Charnes, Cooper and Rhodes, the output-to-input relation is used for assessing relative efficiency of DMU j = DMU o , which is evaluated in relation to ratios of al j = 1, 2,..., n DMU j . The construction can be interpreted as a reduction of the output-multiple / input-multiple situation (for each DMU) toward a unique virtual output and a unique virtual input. For a particular DMU, the relation between a unique virtual output and a unique virtual input provides an efficiency measure that represents a function of the multipliers. In the mathematical language, this relation, which is maximized, makes up the objective function for a particular DMU to be evaluated, symbolically:
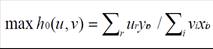 (6)
(6)
Where it is noted that the variables are u
r’s
and v
i’s
; whereas y
ro’s
and x
io’s
represent, respectively, the observed output and input values of the DMU
o
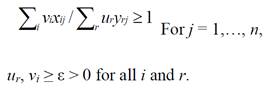
and the DMU to be evaluated (Cooper et al., 2004: 8-9). A group of normalized restrictions (one of each DMU) illustrates the fact that relation between virtual output and virtual input in each DMU, including

Subject to:
 (7)
(7)
The relation lay-out mentioned above produces an infinite number of solutions; if (u*, v*) is optimal, then (αu*, αv*) is also optimal for α > 0. However, the transformation developed by Charnes, Cooper & Rhodes (1962: 182) for the lineal fractional programming selects a representative solution and produces the equivalent problem of lineal programming in which a change of variables from (u, v) to (µ, v) is the result of a transformation. Charnes-Cooper, cited by Cooper, et al. (2004: 9),

Subject to:
 (8)
(8)
For which, the dual problem of LP (lineal programming) is

Subject to:
 (9)
(9)
This last model is occasionally referred to as the “Farrell model” because it is the only one he used. In the economic section of the literature on DEA’s, it is said to be adjusted to the assumption of “strong disposition” since it ignores the presence of non-zero slacks, also referred to as “weak efficiency.”
In observation of the dual theorem of lineal programming, z* = θ*. We can solve (9) to obtain an efficiency result. A solution will always exist due to the fact that we can locate θ = 1 and λ*k = 1 (lambda) with λ*k = λ*o, and the rest with λ*j = 0. Furthermore, this solution implies θ* ≤ 1. The optimal solution, θ*, produces an efficiency outcome for a particular DMU. The process repeats for each DMU j . DMUs for which θ* < 1 are inefficient, whereas DMUs for which θ* = 1 represent bordering points (Cooper et al., 2004: 9-10).
Some bordering points may be “weakly efficient” since we have non-zero slacks. This may seem disturbing because an optimal alternative could have slacks different form zero in some solutions but not in others. However, we can avoid disturbance, even in such cases, by bringing up the following lineal program in which slacks adopt their maximum values.

Subject to:
 (10)
(10)
Here is noted that the s i - and s r + options do not affect the optimal θ* determined in model. These advances now lead us to the definitions about relative efficiency. An efficient DEA: DMU o ’s performance is totally efficient (100%) if and only if θ* = 1 and all slacks s i - = s r + = 0. By contrast, a weakly efficient DEA is one in which DMU o ’s performance is weakly efficient if and only if θ* = 1 and s i - ≠ 0 and/or s r + ≠ 0 for any i and r in any optimal alternative (Cooper et al., 2004: 10-11).
It is important to mention that the development of the quantities mentioned above is useful to solve the following problem in two steps:

Subject to:
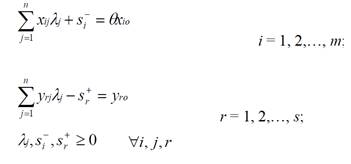 (11)
(11)
Where s i - and s r + are slack variables used for converting inequalities in (9) into equivalent equations. Here ε > 0 is also a non-archimedean element minor to any positive real number. This is equivalent to solving (9) in two stages, first minimizing θ, and then arranging θ = θ* as in (7), where slacks are maximized without alteration of the pre-determined value of θ = θ*. Formally, this is equivalent to giving “preferential priority” to the determination of θ* in (8).
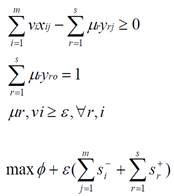
Alternatively, one could have commenced with the output side and considered the virtual output relation instead of the virtual input relation. This would reorient the goal of maximizing toward minimizing, as in (10), to obtain:

Subject to:
 (12)
(12)
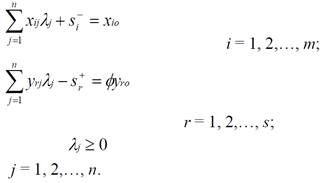
Again, the transformation Charnes, et al. (1962: 182) for fractional lineal programming produces a multiplying model, with the dual problem associated to the envelopment model, as described:
Subject to:
 (13)
(13)
Subject to:
 (14)
(14)
Here, we are using the model with a goal oriented to output, in contrast with an input orientation. However, as mentioned before, model is calculated in a two-stage process. First, we calculate ignoring slacks, and then we optimize slacks arranging the following lineal programming problem,

Subject to:
 (15)
(15)
Then, the previous input-oriented definition of DEA efficiency is modified into the following output-oriented version (Cooper et al., 2004: 11-13). DMU
o
is efficient if and only if = 1 y
The BCC Model (Banker, Charnes & Cooper)
As previously discussed, the CCR model is built on the assumption of constant return scales in activities described by the frontier of production in the case of an only input and an only output shown. Generally, it is assumed that the production possibility set has the following property: If (x, y) is a feasible point, then (tx, ty) for any positive t is also feasible. This assumption can be modified in order to allow production possibility sets with different postulates. In fact, since the beginning of DEA studies, many extensions to the CCR model have been proposed, among which the BBC model (Banker, Charnes & Cooper) is representative. The BCC model has its production frontiers spanned by the convex hull of the existing DMU’s. The frontiers have piecewise linear and concave characteristics which leads to variable returns to scale characterizations with (a) increasing returns to scale followed by (b) decreasing returns to scale and (c) constant returns to scale occurring at the point where the transition from the first and to the second segments is made.
The BBC and CCR models differ only in that the former, but not the latter, includes the convexity condition
Next is presented the BCC model. Assuming a relation n DMUs where each DMU j , j = 1, 2,…, n, produces the same outputs in different quantities, y rj (r = 1, 2, 3,…, s), using the same m inputs, x ij (i = 1, 2,…, m), also in different quantities. The efficiency of a specific DMU o may be evaluated with the BCC model of the DEA, in an “enveloping form” and output-oriented as follows (Banker, Cooper & Rhodes, 1984: 1080):

Subject to:
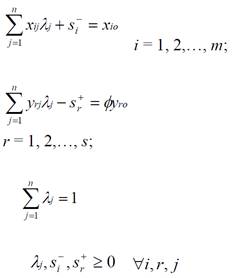 (16)
(16)
Where
Benchmarking
Farell’s original idea has been successfully commuted to its empirical application through basically two methodologies: the estimation of stochastic borderlines and DEA measurements. The first one implies the use of econometrics and the second one relies on lineal- programming algorithms and on benchmarking.
Benchmarking can be defined as the measure of an activity in comparison to that of the best companies of its class. It determines how the best one has achieved such levels of activity, and it uses information as a basis to the objectives, strategies and application of the company itself (Bemowski, 1991:21). The process of benchmarking requires:
Determining the appropriate characteristics of the reception process and utilizing them to compare one process to another.
Developing data on the best-practiced activity inside or outside an organization that requires the application of benchmarking.
Comparing and evaluating the process or processes according to data related to measured characteristics.
Developing measures of continual improvement based on new data.
Applying planned changes to process.
Controlling the effectiveness of such changes.
Benchmarking requires, therefore, a planned action toward evaluation and application, the goal of which is to modify processes based on newly acquired knowledge about a more effective process. Benchmarking can be divided in three areas:
Internal. It is an evaluation of practices within an organization.
Competitive. It is very limited in real practice since it requires competitors that cooperate to the improvement of one or both companies.
Inter-industrial. These are evaluations among operations in different industries.
Benchmarking means adapt best practices instead of copying them. It implies using the knowledge of a process to identify what is usable in the donor process. This way, the mentality or culture surrounding the benchmarking must be one of improving and exceeding the action dimension of the donor process.
Furthermore, benchmarking is a process directed at acquiring useful information that helps an organization improve its processes; it must, therefore, be performed continuously. The DEA technique, then, will allow an identification of those aspects requiring changes and improvements to become efficient. The above mentioned technique has its basis on the use of lineal programming as a tool to carry out the necessary calculations for the application of benchmarking. This way, it is important to create a space to review the fundamentals of lineal programming.
DEA models applied in the port industry
Currently, there is little research on the application of DEA models to measure efficiency in the port industry, specifically with regard to the container terminals. However, these studies are useful as a basis to select the variables that were used in this research.
Over the past two decades, DEA has become a popular method for evaluating the relative efficiencies of decision-making units within a relatively homogenous set. The application on ports or terminals, however, is only incidental. Roll and Hayuth (1993: 153-161) is probably the first paper to discuss the applicability of DEA on port sector. It uses a hypothetical example of 20 ports to generate simulated results. Martínez-Budria et al. (1999: 237-253) used a DEA-BCC model to analyze 26 Spanish ports by defining them as ‘high complexity’, ‘medium complexity’ and ‘low complexity’ ports. It comes to the conclusion that ports with ‘high complexity’ appeared to be more efficient. In recent years, the research on ports tends to focus more on container ports for their homogeneous characteristics.
Tongzon (2001: 113-128)argued that to restrict the scope of analysis to a limited number of ports and a specific type of cargo is necessary for the multiplicity of ports and cargo handled. It uses both DEA-CCR and DEA-additive models to analyze the efficiency of 4 Australian and 12 other international container ports for the year 1996. This analysis is a meaningful exploration, but the result is not pleasing for the relatively less samples. After that, a few papers have focused on the container ports. Valentine and Gray (2001: 1-16) studied 31 container ports among world’s top 100 container ports in 1998. Cullinane, Song & Wang (2005: 73-92) analyzed 25 container ports out of world’s top 30 ones from 1992-99. From the literature, we find that most recently researches tend to switch the DMUs to container terminals since individual container terminals within ports are more suitable for one-to-one comparison than whole container ports (Wang, Song & Cullinane, 2002: 13-15). Notteboom, Coeck & Van der Broeck (2000: 83-106) studied 36 European and 4 Asian container terminals, although its method is a stochastic frontier approach rather than a DEA method.
To inspect the related literature about the research countries, most of them are focused on study developed countries. Other than the above literature with European terminals, only Park and De (2004: 53-69) and Cullinane and Song (2003: 251-267) analyze Korean ports.
The input and output variables for measuring the efficiency of container ports or terminals industry tends to exhibit a kind of diversity in the literature, due to the lack of uniform performance evaluation criteria. Chang (1978: 301) suggested that the inputs of a port should include the real monetary value of net assets in the port, the number of laborers per year, and the average number of employees per month each year. Dowd and Leschine (1990: 108) argued that the productivity of a container terminal depends on the efficient use of labor, land and equipment. In recent years, however, many studies on container terminals tend to present a kind of uniformity. As Wang (2004: 127), the input and output variables should reflect the objective and process of container terminal production as accurately as possible.
While turning to the process of container terminal production, the terminal’s activity is to utilize the labor and equipment to accomplish the container loading or discharging missions. In this process, the quayside gantry cranes (QGC), relying on the transfer of containers between shore and ship, is the most important equipment in deciding the efficiency of a port (Tongzon, 1995: 248). Before the containers are loaded on board or after the they are discharged, to effectively handle the containers and further serve for hinterland demand, rubber-tyred gantry crane (RTG) is essential equipment. During this process the ‘land’ factor can be approximate as the total berth length (BL) of the terminals. Other input factors, such as berth working hours, geographical position, berth waiting time and other equipments, are not included from the consideration of both data availability and avoidance of the problem of multicollinearity.
As to the labor input, the variable is not directly incorporated for the following considerations, a) by analyzing the cost components, most of the cost are attribute to the capital asserts, like fixed establishment and information technology, the salary of the workers is very fractional. b) in the modern practice, a lot of operation during the handling of the containers are outsourced to other companies like third party logistics companies. Therefore the statistics data are usually not correct. c) in the era of containerization, many operations of the works are standardized, the efficiency differences caused by labor is not very significant. As is pointed out by Notteboom et al. (2000:87) that a fairly stable and close relationship exists between the number of gantry cranes and the number of dock workers in a container terminal, the labor input could be derived by a function of the facilities of the terminal.
As to the output side, we will select the throughput as the output index in accordance with the conventional treatment, since throughput is the most important and widely accepted indicator for comparing the ports and terminals and also the container is basic handling unit in the operation. Another consideration is that container throughput is the most appropriate and analytically tractable indicator of the effectiveness of the production of a port (Cullinane et al., 2005: 79).
Empirical Analysis
In this analysis we have considered 33 ports, with a strong relationship in terms of trade, 19 in the Americas, 13 in Asia, and one in Oceania. All of them are in member countries of the trade alliance known as Asia-Pacific Economic Cooperation (APEC). For the selection of seaports has taken an approach based on the container throughput, which must be more than 10,000 TEUs per year and the important trade flows between all ports scanned. Most of the selected ports are highly representative of their respective countries, with high container throughput and trade between them is performing quite significant.
In this research, the DEA empirical analysis uses one output measures: TEUs handled (container throughput: the number of twenty foot container equivalent units handled) and three input measures: tgc (total number of gantry cranes), TA (terminal area), and BL (total berth length of the terminals). Data sources were obtained from the Containerisation International Yearbook 2004 to 2011 and the analysis of empirical results were provided using DEAOS software.
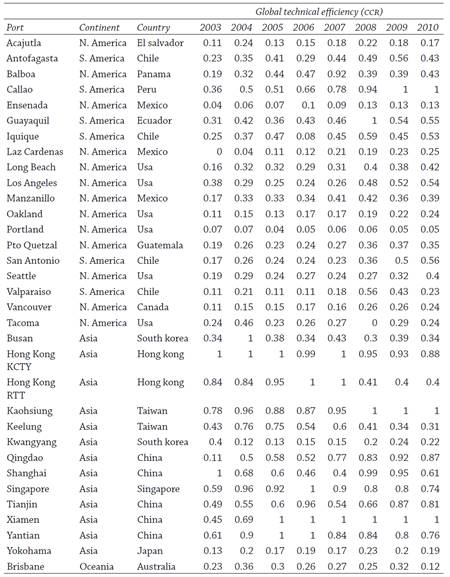
Analysis using DEA-CCR model
The analysis shows that in 2003 only two ports were perfectly efficient - Hong Kong KCTY2 and Shanghai - and 75 percent of the ports in Asia achieved efficiency above 0.5. In contrast, the ports in the Americas were notably inefficient, all of them falling well below 0.5. According with this model there is a strong relationship between terminal area and container throughput; however, most of the ports throughout APEC did not use the terminal area adequately and did not move the quantity of container expected.
In 2004, the efficiency levels of the ports of America increased but none of them was completely efficient. The ports of Busan and Hong Kong KCTY were efficient, and both ports can provide information to perform a benchmarking for inefficient ports. The model revealed that the variables with a strong relationship were terminal area, gantry cranes and container throughput. Some ports had dead time in the gantry cranes, some other did not use them terminal area completely and the container throughput were not the expected, again.
For 2005, 3 ports of Asia were efficient (Hong Kong KCTY, Xiamen and Yantian). This time appeared ports of China. The efficiency levels of America’s ports were similar with the past year, very low. The ports of Asia continued increasing its efficiency levels little by little. The variables with a strong relationship were terminal area and container throughput. The former was not used adequately, and the latter did not achieve the expected.
In 2006, the port of Singapore, one of the biggest in the world, was efficient together with Hong Kong RTT3, Xiamen and Yantian, the other ports (America and Asia) significant decreased in their efficiency levels. The model revealed that Singapore and Xiamen were ports of reference for a benchmarking in the ports of Asia, Yantian and Hong Kong were ports of reference for ports of America, and the variables with a strong relationship were berth length, gantry cranes and container throughput. Berth length and gantry cranes presented several dead times and container throughput were not the expected.
For 2007, Xiamen and the two terminals of Hong Kong were the efficient ports. For the first time in the analysis period one port of America almost achieved the efficiency, the port of Callao (Peru), which scored 0.92. The inefficient ports had a similar behavior like the past year. The terminal area and container throughput were the variables with a strong relationship.
In 2008, appeared the first efficient port of America, the port of Guayaquil. The ports of Xiamen and Kaohsiung were efficient, too. The port of Guayaquil was the reference for a benchmarking in America and the other two ports were the reference for Asia. According with the model, the variables with strong relationship were container throughput, terminal area and gantry cranes.
For 2009 and 2010 the efficient ports were Callao, Kaohsiung and Xiamen. Callao was the reference port for America and the other two were reference for Asia. The ports of America presented low efficiency levels in comparison with ports of Asia. Container throughput and terminal area were the variables with a strong relationship. Terminal area was not used adequately and container throughput was not the expected.
Analysis using DEA-BCC model
The DEA-BCC model resulted in indicators of more efficient ports due to the introduction of the convex constraint in this model. The convex constraint does not exist in the DEA-CCR model and this constraint allows more efficient points on the production frontier.
In 2003, four American ports and two Asian ports were efficient. The efficiency levels of the other ports were typically low. In general, the efficient ports in the Americas were the reference for the benchmarking in the ports of the same region. The model revealed that terminal area and container throughput were the variables with a strong relationship. By 2005, six American and four Asian ports were efficient. The efficient ports in the Americas were exclusively Latin American. The efficient ports of Asia were the benchmarking reference for the ports from that region. The model revealed that gantry cranes, terminal area and container throughput were the variables with a strong relationship to the outcome.
There was little change through the years 2006 and 2007. Many of the ports of in the Americas achieved low levels of efficiency, while many of the Asian ports reached half efficiency levels. Gantry cranes, terminal area and throughput container were the key variables. Dead times in gantry cranes, inadequate used of terminal area and low container throughput.
Efficiency levels using DEA-BCC model in APEC ports 2003-2010
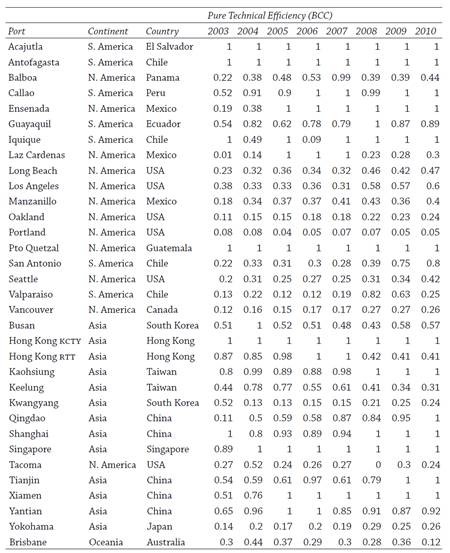
Source: Own elaboration with data from Containerization International Yearbook (2004-2011) and DEAOS system.
In the last three years (2008, 2009 and 2010), six ports on each side of the Pacific Ocean were rated as efficient, with very little change in the ports in both Asia and the Americas The dominant variables were gantry cranes, terminal area and container throughput. Inadequate utilization of terminal area, dead times in terminal area and low container throughput were the issues that allow low efficiency levels.
Concluding remarks
This research is an attempt to provide a satisfactory answer to the problem of making efficiency comparisons across ports by applying the DEA analysis to a sample of ports from APEC bloc for which relevant data are available. The efficiency results obtained depend on the type of DEA model employed which, in turn, depends on an assumption made about the returns to scale properties of the port production function. For instance if a linear technology is assumed, then almost all ports examined are found to be inefficient based on 2003-2010 available port data, using constant returns to scale assumptions. Some other ports like Lázaro Cárdenas, Ensenada, Acajutla, Antofagasta, Iquique and Puerto Quetzal, which are found to be efficient, based on variable returns to scale assumption, are inefficient based on constant returns to scale assumption. The ports of Hong Kong KCTY, Xiamen and Kaohsiung are found to be efficient independent of the returns to scale assumption. The enormous slack in the terminal area input found in the almost all ports have confirmed that government should pay more attention in these areas as an essential step towards improving port efficiency levels.
The Data Envelopment Analysis (DEA) method used in this research looked at the CCR model and BCC model. Both models can rank efficient for the inefficient organizations (ports) while all efficient organizations will have 1 efficiency score. The primary difference between them is the treatment of returns to scale. The CCR model is the treatment evaluation of constant returns to scale. The BCC version is more flexible and allows variable returns to scale (Jahanshahloo, Junior & Akbarjan, 2007: 331).
Main difference between CCR and BCC model is that the intensity vector (λ j ) are now restricted to summing one. This has the effect of removing the constraint in the CCR model that DMUs (ports) must be scale efficient. Consequently, the BCC model allows variable returns to scale (VRS) and measures only technical efficiency for each DMU. That is, for a DMU to be considered as CCR efficient it must be both scale and technical efficient. For a DMU to be considered BCC efficient, it is only need to be technically efficient (Cooper, et al., 2000: 110).
Studying container port performance is becoming more important than ever before due to rapid change in logistics and container transportation technology and the competitive nature of the market. Accurate and appropriate measures of efficiency of seaports are becoming a challenge.
This study has demonstrated that DEA provides a viable method of evaluating technical port efficiency. DEA has recently been successfully applied to a number of different economic efficiency measurement situations. Important features of DEA are that the technique is non-parametric and that more than one output measure can be specified. In addition to providing technical efficiency rankings, DEA also provides results on the sources of input and output inefficiency, as well as the ports which were used for the efficiency comparison. The ability to identify the sources of inefficiency could be useful to port authority managers in inefficient ports, acting as a guide to focusing efforts at improving port performance. The DEA efficiency score gives management a warning signal that the lower the DEA score is, the greater likelihood a container terminal has for failure. Thus, DEA is very useful for identifying the least efficient terminals, which require the closest attention.
One of the clearest conclusions of this research is that regulators must make significant efforts to collect the data necessary to conduct efficiency evaluations, which are more complete instruments than the financial or partial productivity indicators in calibrating the performance of ports. A challenge for researchers and government is to try to involve the competent authorities in obtaining complete and reliable statistics that will lead to a deeper knowledge of the industry. This will allow the effectiveness of the incentives introduced in port policies to be valued or determine an optimum incentives system for reducing port costs and foster port competitiveness, both in inter-port and intra-port scenarios. The above are some of the reasons why Asian ports have higher efficiency levels.
On the other hand, this analysis of port efficiency has demonstrated that in American ports, there is still a long way to go in furthering the important task of evaluating efficiency in this industry. This finding suggests that any plans for continued expansion should start with an accurate demand forecast for container services and information sharing mechanism among shippers, carriers and port authorities. In addition, if port expansion is necessary, port authorities should seriously consider leasing fixed assets such as equipment, buildings and land to increase the cash flow and the fixed asset turnover ratio that can, in turn, improve operational efficiency in the long run.
From a perspective of Asian economies the dominant place in the world shipping market share, measuring the efficiency of container terminals is important. On the one hand, in the macro level, efficiency of container terminals is an essential factor that is related to the competence of this region. The planning and funding of the governments are based on performance measures. On the other hand, in the micro level, due to a more drastic competition environment in a containerization era, all terminal operators need to benchmark themselves to find their advantage as well as shortage for improving their competence (Liu, Liu & Cheng, 2007: 21).
The mission statement of APEC says that: “APEC is the premier Asia-Pacific economic forum. Our primary goal is to support sustainable economic growth and prosperity in the Asia-Pacific region.
We are united in our drive to build a dynamic and harmonious Asia-Pacific community by championing free and open trade and investment, promoting and accelerating regional economic integration, encouraging economic and technical cooperation, enhancing human security, and facilitating a favorable and sustainable business environment. Our initiatives turn policy goals into concrete results and agreements into tangible benefits” (APEC, 2012).
Based on the above we can say that the ports that belong to APEC trading bloc have the chance to carry out commercial activities including knowing the technology that is used in port activities and search for investment opportunities would help them to improve and grow. However, this does not necessarily mean to be a member of this trading bloc improves the port efficiency level, but have the opportunity to learn from the world’s first ports that are efficient.
This research led to know some important factors to improve the seaport efficiency levels, from the standpoint of infrastructure. However, for future research in this topic, it would be appropriate to consider other factors such as labor, land, other technologies, information systems, financial affairs, logistics, distribution and transportation, among others. In addition, it would be convenient to use other models to compare efficiency levels scores and have a broader framework that allows the decision maker to know the different alternatives that arise.
With the results of this research we can conclude that the governments of inefficient ports must act to solve the problems that have arisen and thus public policies to improve efficiency levels in ports to be internationally competitive. The methodology and models used in this research could help to build a framework that allows terminal operators and port authorities assess their performance and likewise carry out its planning every year or period.

