


 nueva página del texto (beta)
 Inglés (pdf)
 Artículo en XML
 Referencias del artículo
 Enviar artículo por email
 Citado por SciELO
  Similares en
SciELO
Similares en
SciELO 
 Permalink
For long-lived species like trees, problems in the youngest recruitment stages can be an early indicator of challenges for future population viability (Volis 2019, Volis & Deng 2020). In the case of Quercus brandegeei Goldman, lack of regeneration has been identified as the greatest threat of extinction (Denvir & Westwood 2016). Indeed, field observations and conversations with elders in Baja California Sur (BCS) communities revealed an absence of Q. brandegeei trees under ~100 years old (Denvir et al. 2019), Lack of juvenile trees, saplings, and seedlings indicate an unbalanced demographic structure that can lead to increased extinction risk for this species (Wiegand et al. 2004).
Understanding the reasons for species decline and lack of recruits is important for effective conservation action, including population recovery and restoration (Di Sacco et al. 2021). One working hypothesis for the lack of Q. brandegeei recruits states that these rare oaks are increasingly facing drought stress and competition as the water table in Sierra La Laguna Mountain range is dropping rapidly. Water needs for agriculture have increased extraction from 88 groundwater aquifers, leading to overexploitation in 14 of them (Medellin-Azuara et al. 2009, CONAGUA 2017 in Gutierrez-Garcia et al. 2020). Climate change can also exacerbate water scarcity, particularly in areas where climatic shifts are associated with increased incidence of warmer temperatures and prolonged drought (Batllori et al. 2020). Climate forecasts for Mexico for the mid-21st century indicate that annual mean temperature may increase by 1.6-2.3 °C and mean annual precipitation may decrease by 70-130 mm (Peterson et al. 2002). Even future climate scenarios that predict atmospheric CO2 stabilization at 850 ppm are associated with a projected precipitation decrease of 30 ± 5 % in the second half of the twenty-first century. Winter and spring precipitation are expected to decrease 15 % in the next 30 years throughout the Baja California peninsula, though small increases in precipitation (5 %) are expected in the dry summer season (Cavazos & Arriaga-Ramírez 2012).
There is little information on how temperature and precipitation changes could be affecting Q. brandegeei but low water availability has been shown to influence different stages of the recruitment process in several oak species across various environments. Drought increased mortality risk for Quercus petraea (Mattuschka) Lieblein in a European forest (Petit-Cailleux et al. 2021). Acorn maturation was strongly dependent on water availability during the spring and summer, but negatively affected by torrential rain events when acorn maturation neared completion for Q. ilex Linnaeus in a French Mediterranean woodland (Pérez-Ramos et al. 2010). These changes in climate can also modify the spatial extent of suitable habitat for a species, particularly for species with restricted ranges (often habitat specialists). Reduction in the spatial extent of suitable conditions for recruitment can lead to drastic distribution reductions (a.k.a. decline) in the long-term (Dirnbock et al. 2011, Urban 2015). Quercus brandegeei, a relict species, with a distribution limited to ephemeral riverbeds in the Sierra La Laguna Reserve in Mexico’s Baja California Sur Peninsula (Cavender-Bares et al. 2015, Denvir & Westwood 2016), is likely one such species. Indeed, a reduction in habitat has already been predicted for four of six Quercus species in the Baja California Peninsula in Mexico: Q. peninsularis Trelease, Q. devia Goldblatt & Manning, Q. chrysolepis Liebmann, and Q. agrifolia Nee (Ramírez-Preciado et al. 2019).
A first step toward determining changes in species’ spatial extent of suitable habitat (for both adults and recruits) is baseline data on the current area where the species occurs, and data on the spatial pattern in which the species is distributed in the landscape (a.k.a. aggregation) (Ripley 1979, Shen et al. 2018). This data is also key to inform conservation plans for a given species (Botanic Gardens Conservation International 2021, Klimas et al. 2021) and appropriate protective measures to promote species’ ecological restoration (Borchsenius et al. 2004). Such information is absent for Q. brandegeei, for which minimal natural history and ecological information exists. Although there is strong visual evidence of Q. brandegeei aggregation around the banks of rivers in Sierra La Laguna Mountain range (Brinckwirth 2021, personal observation), the rate of aggregation or potential causes of aggregation have not been formally explored. Here, we provide the first statistical analysis on spatial aggregation for Q. brandegeei.
Acorn production is another critical step in the recruitment process that has shown high sensitivity to drought in other oak species. For example, a 7-year study found that years with the lowest acorn production for black (Q. velutina Lamarck), red (Q. rubra Linnaeus), and white (Q. alba Linnaeus) oaks were associated with summer drought (Sork 1993). A significant decrease in acorn production was also associated with summer droughts for downy oak (Q. humilis L. Willdenow) and holm oak (Q. ilex L.) in the Mediterranean (Espelta et al. 2008).
Here, we explore acorn presence in Q. brandegeei individuals that occur in three regions varying in climate. The goal is to use current differences in environmental factors as proxies for potential responses to future shifts in temperature and precipitation.
Study objective and hypotheses. This study had two goals: (1) to determine the species’ spatial aggregation; and (2) to determine whether recruitment failure of Q. brandegeei in BCS is partially due to lack of acorn production, perhaps related to climate changes and water management in the region. While we capture only a year of production in binary terms (presence or absence of acorn production for individuals), this study does inventory presence/absence of acorns in regions with different climate (precipitation and temperature), which serve as proxies for future conditions that will be found across different regions of the peninsula. Regarding spatial aggregation, we hypothesized that water stress in this arid climate would lead to a clumped Q. brandegeei pattern around water sources (Lookingbill & Zavala 2000), particularly, ephemeral riverbeds. For acorn production, we hypothesized that increased wet and dry season rainfall would increase presence of acorn production. We expected a negative and significant relationship between maximum temperature and likelihood of acorn production. While our study provides only a snapshot of one year of demographic and reproduction data and is limited to whether or not trees had evidence of acorns, it is a first step in helping determine the cause of this species’ lack of new recruits, and thus towards preventing its extinction.
Materials and methods
Species description. Quercus brandegeei Goldman is an oak endemic to Baja California Sur, Mexico, and found strictly on the banks of ephemeral riverbeds inundated by seasonal precipitation from hurricanes (Cavender-Bares et al. 2015, Denvir & Westwood 2016). Quercus brandegeei is listed as endangered (EN) on the IUCN Red List of Oaks 2020 (Carrero et al. 2020). An important non-timber forest product, its sweet, edible acorns are used locally for livestock feed and as food in flour and atole, a milky beverage made from corn flour. A multiple-use species
(García-Fernández et al. 2008, Guariguata et al. 2010), Q. brandegeei timber is also used for charcoal, fuel wood, and picket fences (Denvir & Westwood 2016, Pérez-Morales 2021). It has a moderate or large trunk between 18-20 m tall with furrowed gray bark and a wide and spreading crown. Q. brandegeei is one of the species within the live oak clade (Quercus section Virentes) (Muller 1961, Cavender-Bares et al. 2015, Manos & Hipp 2021). Additional threats include overexploitation, over-grazing by livestock (Álvarez-Clare & Westwood 2019, Pérez-Morales 2021) and potential overharvesting for charcoal and fuel wood (Denvir & Westwood 2016).
Collection of data for spatial analysis, tree attributes and reproductive status. In 2017, we conducted a demographic inventory of 11 populations of Q. brandegeei. An additional inventory of the Q. brandegeei population in El Chorro was completed the following year. Data from the 12 inventoried populations were used for spatial analysis: La Palmera, El Chorro, La Alegría, La Burrera, La Cobriza, Las Matancitas, San Dionisio, Santa Anita, Santo Domingo, Tejón, Todos Santos, and Valle Perdido (Figure 1). Because Q. brandegeei is usually distributed along canyons or riverbeds, we considered sampling points at different riverbeds as separate populations. This approach has been validated by genetic data revealing high structure for samples from each study site and low genetic flow among populations (Gonzalez-Rodriguez et al. in prep). We conducted inventories via walks parallel to the river until we could sample 20 trees per population. Even using extended walks there were some populations where it was not possible to inventory 20 trees. In some populations, trees were more or less continuous in their occurrence. In other populations, however, distances of 200 to over 1,500 meters separated groups of individuals (Brinckwirth 2021) (Figure 2). For each of the identified living trees, diameter at breast height (dbh), height, and spatial coordinates were recorded. Since Q. brandegeei is a multi-stemmed species, we used basal area of each multi-stemmed individual for analysis. A total of 194 inventoried trees from 12 populations were used for Ripley’s K spatial analysis.
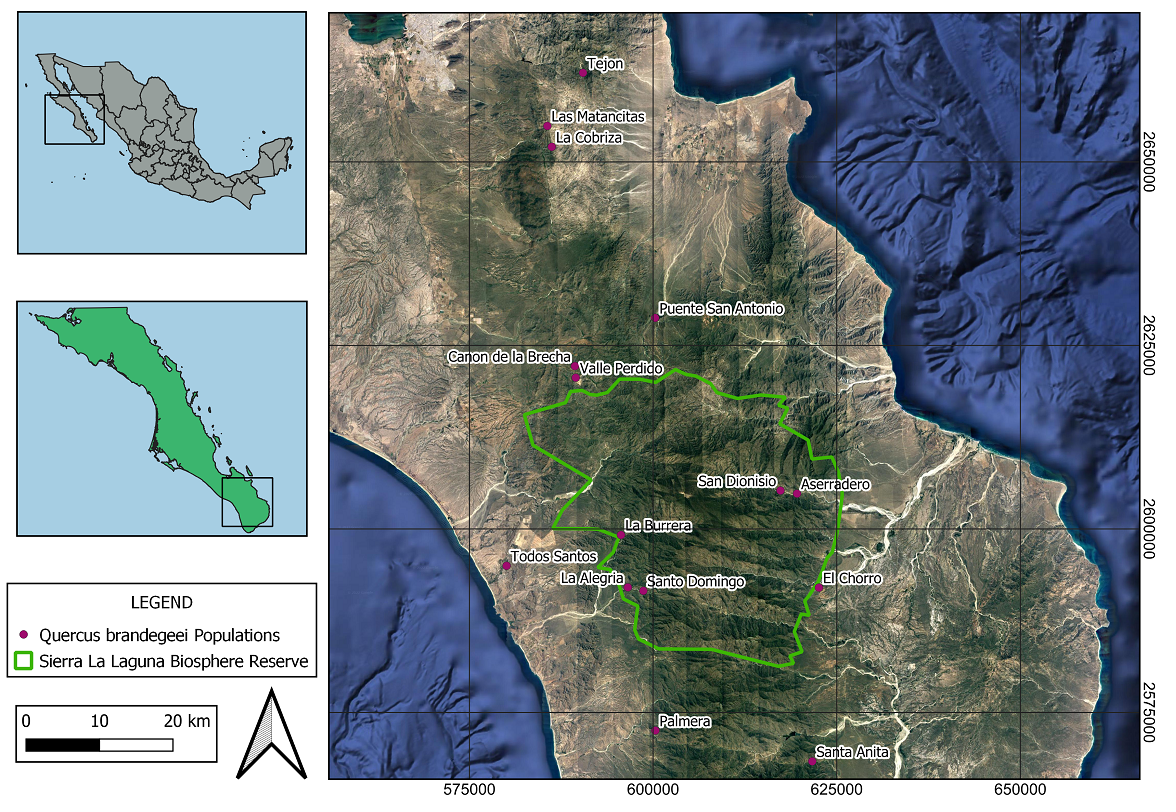
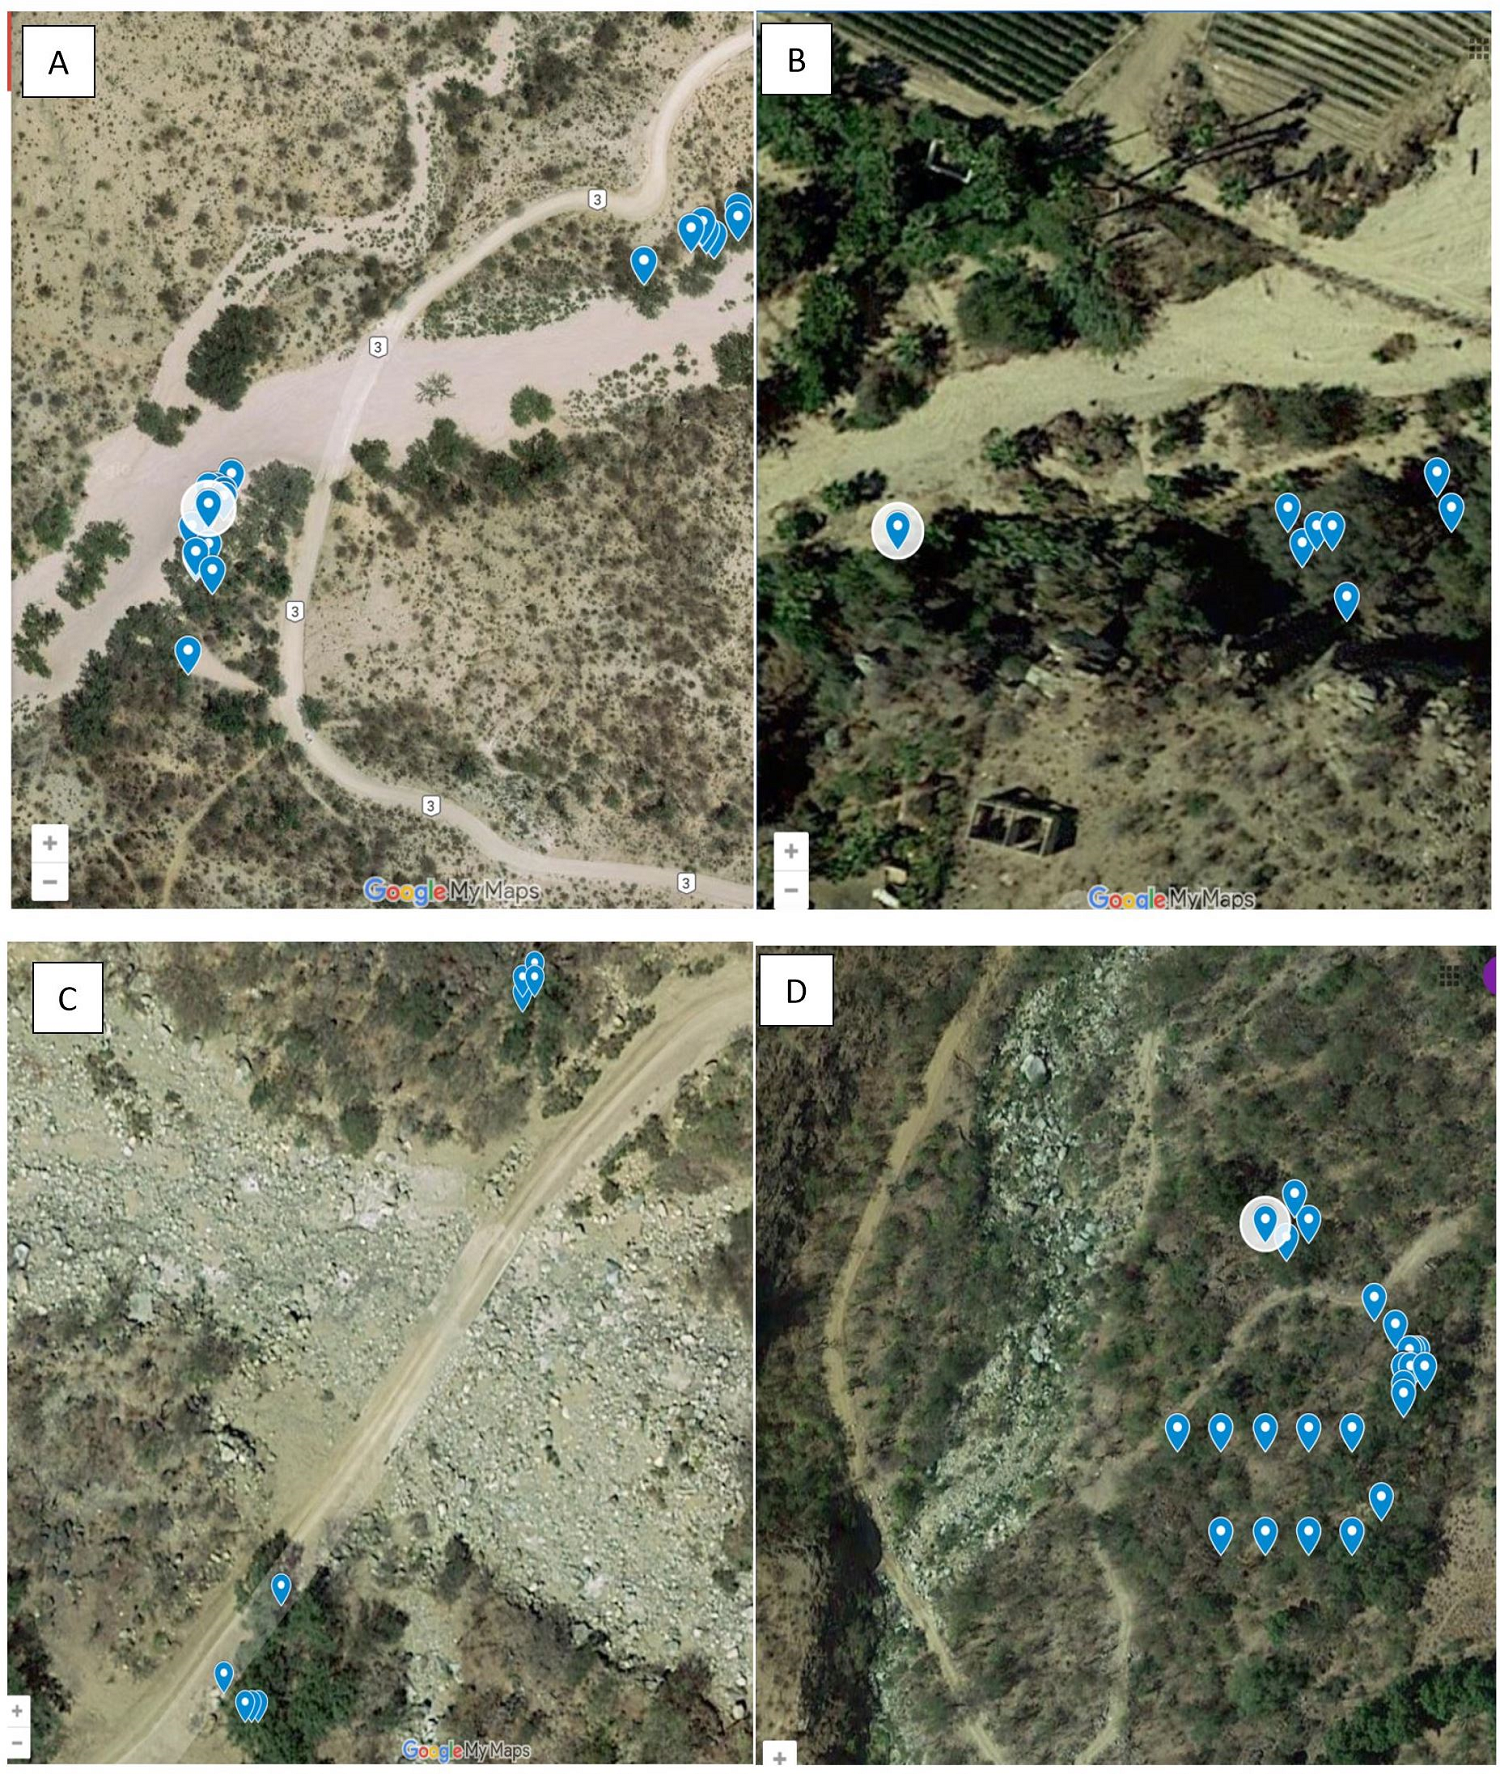
Figure 2 Image created in Google Maps with blue points indicating each individual Q. brandegeei tree within the population. In panel A, the ephemeral riverbed splitting the population of Tejon into two is visible; in panel B, individual trees in Todos Santos are adjacent to the ephemeral riverbed. Trees in Santa Anita (panel C) have been split into two clumps by the ephemeral riverbed and the Santo Domingo population (panel D) shows multiple clumps.
We also recorded whether or not an individual had evidence of acorn production that year (reproductive status) in 11 populations. These populations included some of the populations used for spatial analysis: La Palmera, La Alegría, La Burrera, Santa Anita, Santo Domingo, Tejón, Todos Santos and Valle Perdido. Additionally, Aseradero, Cañón de la Brecha, and Puente San Antonio were monitored for acorn presence/absence. Presence of any acorns indicated evidence of production. We used a binary yes/no estimate to indicate whether or not an individual tree was reproducing because once acorns reach maturation and fall, they are almost immediately consumed by free ranging livestock. We were not able to quantify acorn production because of differences in timing of acorn maturation between regions and intense consumption by wildlife and farm animals of both fallen and maturing acorns. One hundred seventy-three trees were used for generalized linear models of significant determinants of acorn production.
Acorns of Q. brandegeei mature the same year as anthesis with fruiting in November. While we have no acorn quantification data prior to our study, conversations with local ranchers and authors’ personal observations over the past 4 years indicate that most trees produce some acorns each year, although years after high production (potentially masting) are normally followed by smaller acorn crops for individual trees. Our study assumes that 2017 was a “typical” year for expression of flowering and fruiting based on acorn collection for a germination experiment in 2018, 2019 (Pérez-Morales 2021), 2020, 2021, and 2022. A more formal quantification of acorn production using canopy traps is underway, as part of our conservation efforts in the region.
Estimation of spatial aggregation of populations using Ripley’s K. To determine the spatial distribution of Q. brandegeei, we conducted a Ripley’s K analysis using the spatstat library in R (Baddeley 2005). For the 194 trees sampled from twelve populations (Figure 1), we calculated Ripley’s K nearest neighbor distances for trees in each population (R Core Team 2021) by determining the expected number of neighbors in a circle with radius ds centered on an arbitrary tree (Ripley 1979). This circle begins at a specified radius and increases until it encompasses the study region. The number of neighbors found in the circle is then compared to the number expected if those trees were distributed in a random pattern (Haase 1995). If trees in a population are randomly distributed, the results will plot within the graphed confidence intervals. If a species is aggregated, the plotted line will fall above and outside the confidence intervals. Conversely, if a species is uniformly distributed, the plot will show a line that falls below and outside the random distribution confidence envelopes (Baddeley 2005).
Environmental variables. Climatic variables can be important determinants of both tree and population-level production, and factors like water availability (precipitation) and temperature in this already hot, arid region, were expected to play roles in acorn production. Therefore, our predictor variables included 8 climatic variables: (1) the average of the 2017 March minimum temperature; (2) the average of the 2017 March maximum temperature; (3) the average of the 2017 April minimum temperature; (4) the average of the 2017 April maximum temperature; (5) summed 2017 dry season precipitation: April-June 2017; (6) summed 2017 wet season precipitation: August-October 2017; (7) summed 2016 dry season precipitation: April-June 2016; (8) summed 2016 wet season precipitation: August-October 2016. Additional explanatory variables tested included: (1) tree basal area; (2) height; (3) number of stems; and (4) the region where the individual was located: Pacific, North, Gulf, or South (see Figure 1). Regional variation in temperature cues means that even if a species responds to the same cues, acorn production may differ by region. Q. brandegeei populations grow in areas from near the Gulf of California to the Pacific Ocean. These areas differ in climate and topography (Arriaga & León 1989): The Pacific region is colder and receives approximately 204 mm more rainfall (507 mm annually) compared to the Gulf area’s lower annual mean of 303 mm (Arriaga & León 1989). Looking at reproduction by region is a step in better understanding whether climate variables, and changes, are contributing to recruitment failure for this endangered tree.
For each sampled population, we used climate data from the National Meteorological Service or Comisión Nacional del Agua Servicio Meterológico Nacional (CONAGUA 2020). We found the closest weather station to each sampled population on the Centro de Investigación y de Educación Superior de Ensenada (CICESE). We used data from nine stations for the twelve populations. We prioritized site proximity to the weather station. For three of the populations, the closest station corresponded with a station already used for another population. Wet season rainfall was calculated by summing the 3 months with the highest precipitation in 2016 and 2017 (August-October). There was little or no rainfall during the remainder of the year, though through visual inspection of monthly rainfall, we used April through June as the period for summing dry season rainfall.
Predicting individual tree reproductive status. To better understand factors that determined whether Q. brandegeei individuals produce acorns, we used generalized linear mixed models (glmm) with a logit distribution to model presence/absence of acorn production in 2017. Fixed effects included region (North, South, Pacific, and Gulf), tree basal area, height, 2017 dry season rainfall, 2017 wet season rainfall, 2017 maximum and minimum temperature during March and April (the months of pollination; Rebman & Roberts 2014), and number of stems for an individual tree. Oaks are not like most masting species which vary in flower initiation from year to year, termed flower masting species. Instead, oaks tend to initiate a more similar number of flowers but vary in acorn crops because of different rates of pollination and ripening between years, termed fruit masting species in (Pearse et al. 2016). Therefore, we expected the acorn crop to be sensitive to temperature and rainfall during the narrow period of pollination. Population was used as a random factor to account for the likelihood that acorn production for trees in a given population could be correlated with acorn production of other trees in that population (Zuur et al. 2009). Prior to creating models, we tested for multicollinearity using the olsrr library (Hebbali 2020) in R version 4.1.2 (R Core Team 2021). Variables that were highly correlated with other variables were excluded from the model. After removing highly correlated variables, predictor variables with p ≤ 0.05 were considered significant predictors of presence/absence of acorn production. All statistical analyses were conducted using R with the PQL generalized linear mixed model in the MASS package (Venables et al. 2002). To determine which regions were different from one another, we completed a Tukey test using the multiple comparison (mcp) command in the multcomp package (Hothorn et al. 2008). Ten models, including a null model, were used to select the best fit model. The Akaike information criterion was used to select between models. The equation of the selected mixed model is in the equation below:
Results
Ripley’s K - spatial aggregation of Q. brandegeei. Ripley’s K analysis confirmed aggregated distribution for Q. brandegeei. All 12 populations had statistically significant evidence of aggregation; gRipley consistently stayed above gPois (Figure 3). In five populations, aggregation occurred at distances up to 100 meters: Cultivo Palmera, La Burrera, Santo Domingo, Tejón, and Todos Santos (not pictured). Aggregation was evident at distances of up to 200 meters for six populations: El Chorro, La Alegría (not pictured), La Cobriza (not pictured), Las Matancitas, Santa Anita, and Valle Perdido (not pictured). Only San Dionisio had evidence of clumping at distances that exceeded 200 meters (Figure 3). In all populations, aggregation was most pronounced at shorter distances of approximately 0-25 meters (Figure 3).
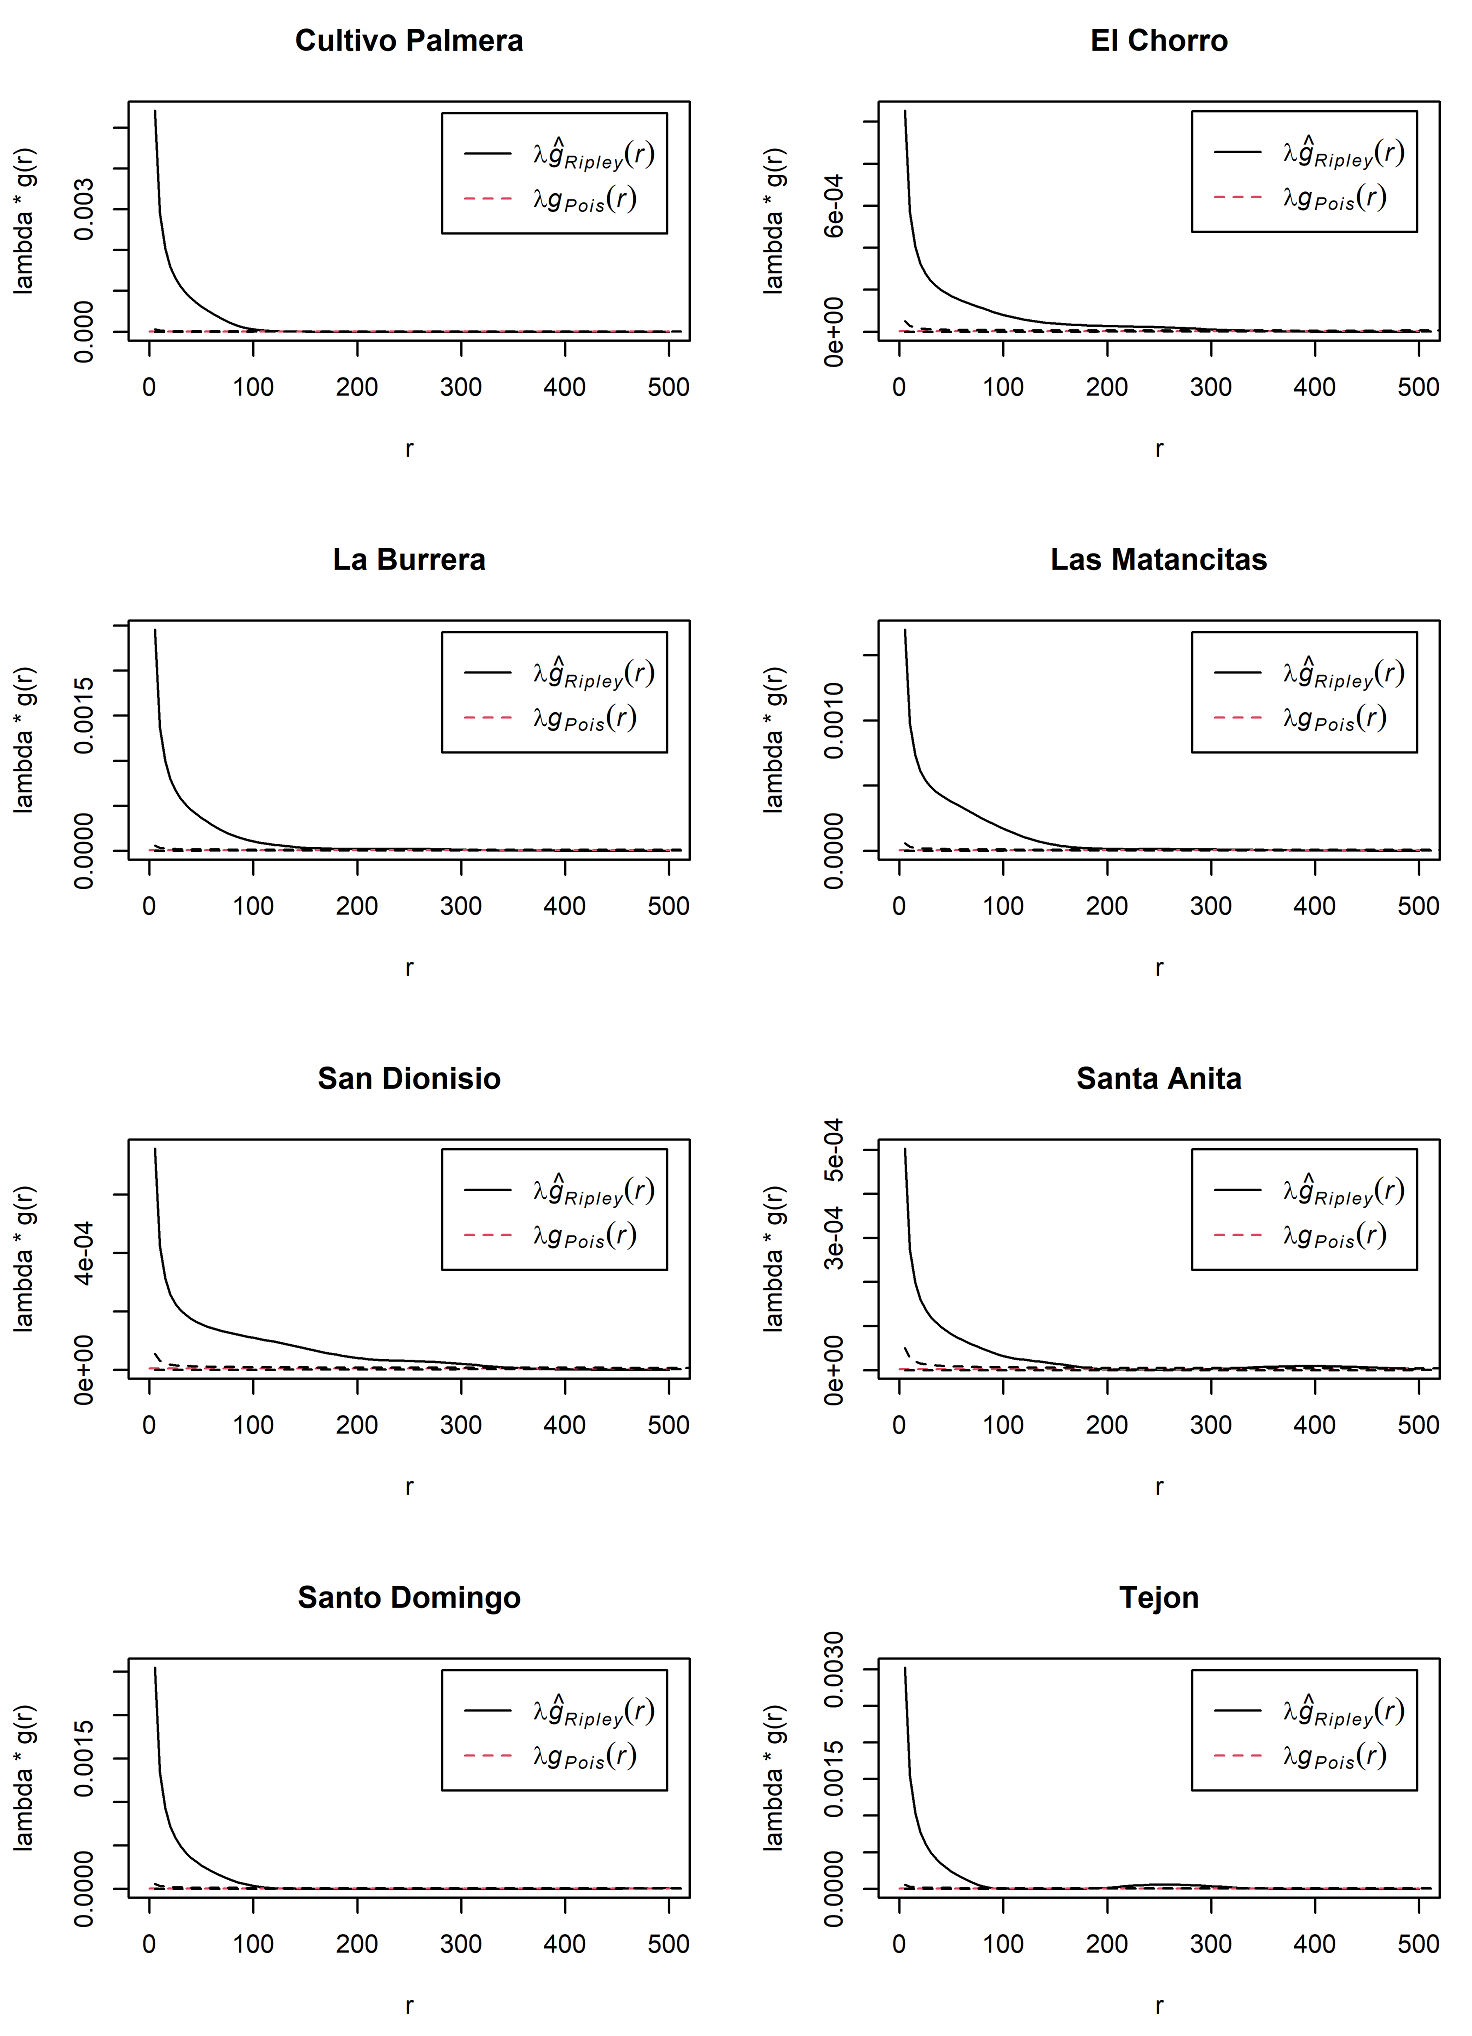
Figure 3 Ripley’s K analyses indicated aggregation of Quercus brandegeei in all inventoried populations. When the λĝRipley(r) line is outside of the confidence interval (dotted lines), there is statistically significant evidence of clumping at distance r. While all twelve populations had significant aggregation, there were three patterns to this aggregation. The eight graphed populations represent these patterns. Cultivo Palmera, Santo Domingo, and Tejon represented aggregation at distances of up to 100 meters. El Chorro, La Burrera, Las Matancitas, and Santa Anita were representative of populations with aggregation at distances of up to 200 meters. Only San Dionisio had evidence of clumping at distances that exceeded 200 meters.
Tree attributes and region co-determine probability of reproduction. Our results indicate that the lack of recruitment in Q. brandegeei populations in the BCP is not likely because acorns are lacking. While we did not quantify the number of acorns produced, a factor that is clearly important in determining reproductive potential, over 80 % of trees had evidence of acorn production in the North and Pacific regions. Over half of trees had evidence of acorn production in the South. Indeed, the only region where acorn production could be a limiting factor for Q. brandegeei recruitment was the Gulf region where fewer than 10 % of trees had evidence of acorn production (Figure 4), though it is possible that acorn production occurred after our visit to the Gulf population.
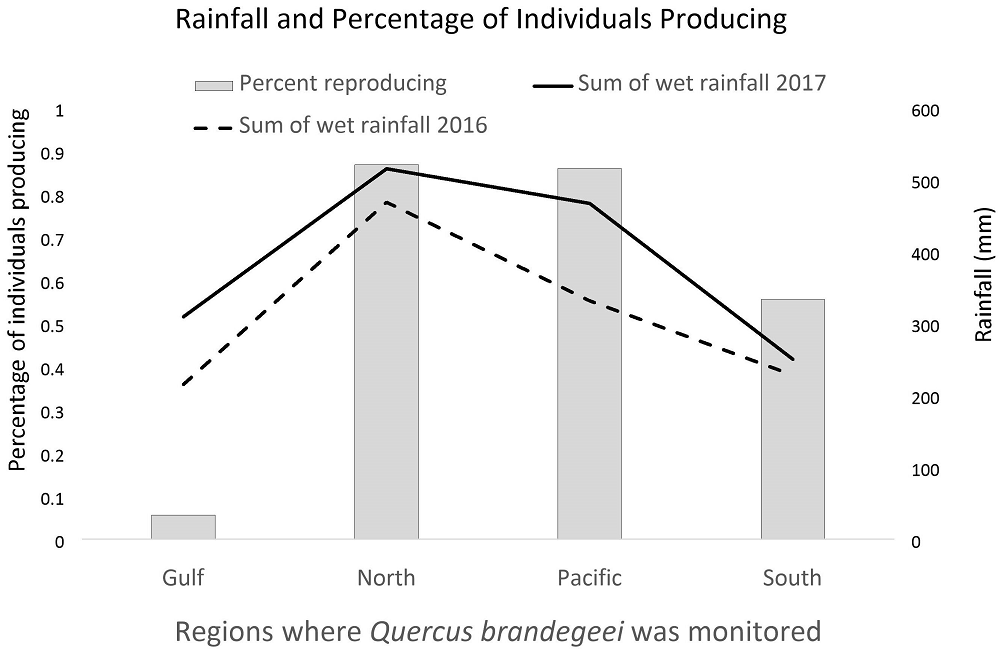
Figure 4 The percentage of individuals with evidence of acorn production varied by region with a lower percentage of individual producing in regions with lower rainfall, though this relationship was not significant.
Some climate variables were correlated. We excluded correlated variables from our analysis. Pearson’s correlation coefficient indicated that 2017 wet season rainfall and 2017 April minimum temperatures were correlated (r = 0.74); March and April 2017 maximum temperatures were correlated (r = 0.93); and March and April 2017 minimum temperatures were correlated (r = 0.65). As Q. brandegeei flower pollination initiated in March, we used temperatures in that month in the model (Table 1).
Table 1 Temperature for March and April 2017 and precipitation for each study region in 2016 and 2017 in the Baja California peninsula. The standard deviation around the mean is included in parentheses. Variation around means is not shown for the Gulf and South since data from only one climate station was available for these regions. Temperature and precipitation data came from 3 and 4 climate stations for the North and Pacific regions, respectively.
| Region | Average of 2017 March minimum temperature (°C) | Average of 2017 March maximum temperature (°C) | Average of 2017 April minimum temperature (°C) | Average of 2017 April maximum temperature (°C) | Total 2017 dry season rainfall (mm) | Total 2017 wet season rainfall (mm) | Total 2016 dry season rainfall (mm) | Total 2016 wet season rainfall (mm) |
|---|---|---|---|---|---|---|---|---|
| Gulf | 8.9 | 29.4 | 11.4 | 31.0 | 0 | 309.1 | 5.4 | 215 |
| North | 8.9 (1.3) | 28.2 (2.8) | 10.4 (1.0) | 30.6 (2.1) | 0.3 (0.5) | 515.0 (61.4) | 8.5 (7.7) | 468.3 (56.0) |
| Pacific | 12.3 (1.9) | 27.8 (1.8) | 12.5 (0.8) | 28.8 (2.0) | 0 (0) | 466.7 (129.4) | 3.7 (3.5) | 331.2 (103.7) |
| South | 13.0 | 33.5 | 12.7 | 35.7 | 0 | 250 | 0 | 228 |
Some tree attributes had significant effects on the probability of presence of acorns. The number of stems significantly reduced the likelihood that an individual tree would have acorns present (Table 2). Individual tree basal area was significant in increasing the likelihood that a Q. brandegeei tree would have acorns present. However, this pattern did not hold at a regional scale. The Gulf region had the largest basal area occupied by individual trees (Table 3), but the lowest percentage of trees with evidence of acorns. High variability in tree basal area in each of the populations (Table 3) likely contributed to the difference between this effect for individual trees vs regional patterns, though timing of population visits may have also played a role. Basal area and height were correlated (r = 0.510) and thus we excluded height from the model.
Table 2 The full model for estimating probability that Q. brandegeei individuals produce (1) or do not produce (0) acorns. We used a binomial (logit model) generalized linear mixed model to determine which tree attributes and climate variables were significant in predicting whether trees would produce acorns. Population was included as a random effect. Both tree attributes (i.e., tree size, estimated as basal area and number of stems) and region contributed to the predictive power of the model. No climate variables significantly contributed to the model’s predictive power.
| Generalized linear mixed model - binomial distribution: presence of acorns | ||||||
|---|---|---|---|---|---|---|
| Estimate | Std. Error | DF | t-value | p-value | Significance | |
| (Intercept) | 9.20 | 6.49 | 160 | 1.42 | 0.16 | |
| Region: North | 8.37 | 3.09 | 5 | 2.70 | 0.04 | * |
| Region: Pacific | 12.69 | 4.58 | 5 | 2.77 | 0.04 | * |
| Region: South | 7.45 | 4.83 | 5 | 1.54 | 0.18 | |
| Basal area (m2) | 2.55 | 0.73 | 160 | 3.52 | <0.001 | *** |
| 2107 dry season rainfall | -0.23 | 0.15 | 5 | -1.50 | 0.20 | |
| Number of stems | -0.82 | 0.29 | 160 | -2.85 | <0.01 | ** |
| March 2017 minimum temperature | -1.25 | 0.70 | 5 | -1.79 | 0.13 | |
Significance codes: 0 ***, 0,001 **, 0.01 *, 0.05
Table 3 Tree attributes for each population in the Baja California peninsula. The standard deviation around the mean is included in parentheses.
| Region | Population | Average tree basal area (square meters) | Height (meters) |
|---|---|---|---|
| Gulf | Aserradero | 0.68 (0.70) | 11.4 (3.7) |
| North | Canon de la Brecha | 0.06 (0.08) | 8.2 (3.8) |
| Puente San Antonio | 0.39 (0.29) | 11.2 (4.3) | |
| Tejon | 0.23 (0.21) | 8.6 (2.8) | |
| Valle Perdido | 0.33 (0.18) | 10.2 (2.2) | |
| Pacific | Palmera | 0.26 (0.22) | 8.3 (2.5) |
| La Alegria | 0.49 (0.42) | 8.1 (2.1) | |
| La Burrera | 0.29 (0.27) | 10.2 (1.8) | |
| Santo Domingo | 0.35 (0.53) | 9.5 (5.4) | |
| Todos Santos | 0.08 (0.06) | 8.3 (2.2) | |
| South | Santa Anita | 0.33 (0.18) | 8.1 (2.9) |
No weather variables were significant in determining the likelihood of an individual having acorns (Table 2). Region may have more effectively captured climatic differences than annual or monthly measures of temperature and precipitation. Follow-up statistical tests indicated a significant difference between the Gulf and South (p = 0.0101) regions with significantly lower likelihood of production in the Gulf region (5.6 % of individuals with evidence of production) than in the South (55 % of individuals with evidence of production).
Discussion
Spatial aggregation of Quercus brandegeei. Our results clearly indicated aggregation of Q. brandegeei at short distances in all populations (Figure 3), a relationship expected in hot riparian zones where species usually have higher ecological specificity (Aguiar et al. 2013, Dimov et al. 2013). As predicted from field observations, individuals were consistently aggregated around riverbeds like Pinus edulis Engelmann (Wion et al. 2020) and Quercus in arid environments (Lookingbill & Zavala 2000, McDonald & Tappeiner 2002). Moreover, Q. brandegeei, was not only aggregated along the ephemeral riverbeds but also in specific patches, suggesting that suitable areas for recruitment are incredibly limited for this relict species.
Given the arid environment where it occurs, water likely determines Q. brandegeei establishment by increasing seedling survivorship in areas with higher soil humidity, or where the water table is shallow. In fact, there is direct evidence that drought has led to a severe range reduction of this species, which 5 million years ago was found in an area > 100 fold larger than its current population size (Cavender-Bares et al. 2015). According to molecular data, as the global climate got cooler and drier forming the arid environment characteristic of the Baja California region, Q. brandegeei experienced a severe range attrition (Cavender-Bares & Ramírez-Valiente 2017).
Presence of acorns was explained by basal area and region. Contrary to our initial expectation, given the lack of recruitment for this species, acorns were present in all populations where we sampled. However, there were differences among populations in the proportion of trees with acorns. Our hypothesis of climatic cues being important as determinants of reproductive success, measured as presence of acorns, was not supported. Climatic variables, however, were already partly captured in the region variable. Indeed, when only region was modeled, the California Gulf region had a significantly lower likelihood of an individual producing acorns than all other regions, perhaps due to lower rainfall. The Pacific region is colder and wetter than the Gulf area (Arriaga & León 1989). Weather data in 2016 and 2017 may have served as a proxy for regional rainfall differences (Cortez 2021). These results have implications for Q. brandegeei conservation in Baja California Sur. Climate models predict an increase in the peninsula’s aridity with a reduction in winter-spring precipitation in the North and summer precipitation in the Center and South (Cavazos & Arriaga-Ramírez 2012). While our data is from a very limited period, if findings on regional differences in percent production from this study hold over longer time periods, we might expect a decreased likelihood of individuals producing acorns in the short-term or increased intervals between mast years (Wion et al. 2020) due to regional climatic differences.
We recognize that there are limitations in this study in terms of its relevance to understanding predictors of acorn production. The first is that this study represents a mere snapshot of reproduction (one year) in the lifetime of a long-lived tree. This is problematic since Q. brandegeei may be a masting species in a system with high interannual variability in weather exacerbated by variable rainfall from hurricanes. Rigorous studies spanning years or decades would likely be necessary to elucidate which environmental variables are important in determining whether trees produce acorns, and perhaps more importantly, the quantity of acorn production. Additionally, direct tree counts using binoculars or a camera, timed binocular counts (LaMontagne et al. 2005), and seed traps (Wang et al. 2020) are better ways to quantify seed production than the presence/absence metric we used. Nevertheless, the high proportion of trees with acorns across the regions and populations is a positive indication for this endangered species. Site visits in 2021 also indicated a high percentage of individuals with evidence of acorns, with some individuals having hundreds of acorns (personal observation).
Thus, lack of acorn production does not appear to be the cause of the lack of Q. brandegeei recruitment. Research on ten threatened tree populations in China found that even when recruitment occurred intermittently, no gaps in size classes were observed unless seed germination and/or survival of emerged seedlings were extremely rare events (Volis & Deng 2020). We have been able to collect acorns reliably during the past 5 years and germination experiments have revealed that there is a high rate of germination and seedling survival in controlled nursery conditions (Pérez-Morales 2021). Other factors, like acorn consumption by pigs (Sus scropha Linnaeus), and seedling grazing and trampling by free roaming cattle (Bos taurus Linnaeus) and goats (Capra aegagrus Erxleben) (Álvarez-Clare et al. in prep) may be more important in explaining recruitment failure for this species (Denvir & Westwood 2016, Álvarez-Clare et al. in prep). Nevertheless, environmental factors could also be limiting resource availability for reproduction and regeneration, which could result in low quality acorns, smaller acorns or decreased germination. A study by Pérez-Morales (2021) found that region influenced germination rates and times.
In conclusion, a combination of shifting climate leading to range attrition, suboptimal acorn production in some sites, and anthropogenic changes such as increased intensity of farm animals that consume acorns and seedlings are likely resulting in declining populations for Q. brandegeei. Potential extinction of this keystone species would lead to catastrophic ecological consequences, including potential extinction of fauna that rely on acorns for food supply (Breceda et al. 2022). Although this study spans a single reproductive season, it is the first to explore acorn presence for this rare, understudied species and provide data-based guidance to inform conservation and recovery actions. Preliminary results from this study provide an important and timely contribution toward mapping a recovery plan for this species. Because acorn production may not be the bottleneck in juvenile recruitment, conservation efforts for Q. brandegeei may be best served by focusing on ways to increase seedling establishment and survival, possibly in areas protected from ubiquitous grazing effects. Strong aggregation, likely in less dry areas, suggests that population reinforcement efforts should either focus on preservation of existing “tree islands” across Baja California Sur or include supplemental watering (Elliot et al. 2013).

