


 nueva página del texto (beta)
 Inglés (pdf)
 Artículo en XML
 Referencias del artículo
 Enviar artículo por email
 Citado por SciELO
  Similares en
SciELO
Similares en
SciELO 
 Permalink
Variation in climatic conditions at local and regional scales determines the phenotypic and physiological expression of plants and, at larger scales, the geographical distribution patterns of plant species (Pollock et al. 2012, Stahl et al. 2014, Riordan et al. 2016). Phenotypic variability in functional traits determines the limits of species distributions (Pollock et al. 2012, Stahl et al. 2014, Körner et al. 2016) through the intraspecific responses of plants to specific environmental factors (Albert et al. 2010, Laforest-Lapointe et al. 2014, Henn et al. 2018), in turn determining the ecological differentiation among populations (Albarrán-Lara et al. 2019, Martínez-Blancas & Martorell 2020). Identifying the relationships between morphological traits and environmental changes increases our understanding of the differential responses of populations, the potential shifts in species distributions, and the potential responses of plant species to climate change (Valladares et al. 2014, Henn et al. 2018).
Temperature and precipitation are two of the main environmental drivers of leaf variation at a global scale (Moles et al. 2014, Valladares et al. 2014, Wright et al. 2017). Patterns of foliar variation associated with gradients of temperature and precipitation have been identified for some leaf traits. For instance, plants with smaller leaves occur at sites with lower mean annual precipitation (Wright et al. 2017) along latitudinal (Uribe-Salas et al. 2008) or elevational (Tang & Ohsawa 1999) gradients. Similarly, leaf dry mass per area and leaf thickness have shown positive relationships with high solar radiation and temperature and negative relationships with rainfall at the multispecies level at a global scale (Niinemets 2001). However, these patterns vary at the intraspecific level at a regional scale. Variation among populations has been observed for some traits; for instance, a larger leaf area has been associated with high rainfall (Gouveia & Freitas 2009), and greater leaf vein density has been observed in drier environments (Zhu et al. 2012).
The density and type of trichomes also provide evidence of the functional responses of plants exposed to different environmental conditions. Under dry conditions, trichomes reduce the absorbance of solar radiation (Benz & Martin 2006), providing resistance to low temperatures (Agrawal et al. 2004) and UV ray protection (Schilmiller et al. 2008). Similarly, the importance of stomata in sensing and driving environmental change has been observed (Hetherington & Woodward 2003). Reduced stomatal density has been observed at higher CO2 concentrations (Casson & Gray 2008), while stomatal density tends to increase in plants located at sites with elevated temperature and drought stress (Yan et al. 2017).
In this study, we analyzed the intraspecific variation in leaf morphological and functional traits in response to environmental gradients for an endemic red oak from northeastern Mexico: Quercus mexicana Bonpl. (Section Lobatae). The populations of Q. mexicana are distributed over a wide area, including subhumid regions, temperate forests, and xeric areas (Pérez-Mojica & Valencia-Á. 2017), in which conditions of temperature, precipitation and humidity display a large degree of variation. The objectives of this study were to determine the variation and degree of differentiation in leaf morphological traits among the populations of Q. mexicana and assess the relative influences of climatic and geographic factors on this phenotypic variation throughout the entire distribution of this species.
Materials and methods
Study species. Quercus mexicana is a tree species that grows between 6 to 12 m tall. This species presents coriaceous leaves that are elliptic, or oblong to oblong-obovate, from 2.8 to 8 cm in length and 1.5 to 2.5 cm in width and bear 7 to 12 secondary veins. Leaves present stellate trichomes at the base of the adaxial side and fasciculate trichomes on the abaxial side (Pérez-Mojica & Valencia-Á. 2017). Quercus mexicana is distributed mainly in the Sierra Madre Oriental (eastern Mexico) and at the eastern boundaries of the Mexican Plateau and the Trans-Mexican Volcanic Belt (Figure 1). It has been recorded in pine forests, oak forests, and xeric shrublands at elevations ranging from 1,600 to 2,700 m in clay soils with rocky outcrops (Pérez-Mojica & Valencia-Á. 2017).
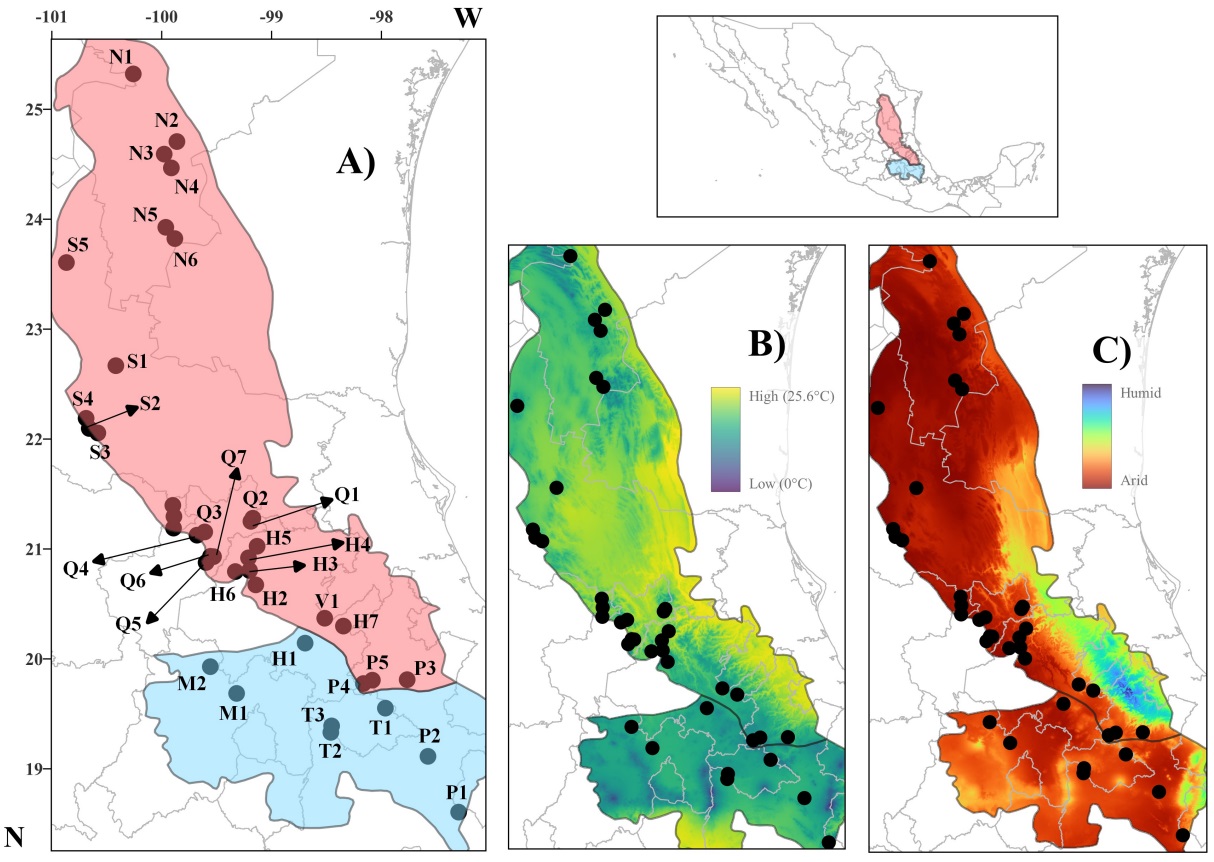
Figure 1 Study area. (A) Geographic locations of the 39 populations of Quercus mexicana across the Sierra Madre Oriental (SMO in red) and adjacent regions (in blue). Maps of (B) annual mean temperature and (C) aridity index in the study area. Population abbreviations are described in Appendix 1.
Study area. The Sierra Madre Oriental is a mountain chain with marked climatic and environmental variation and a noticeable difference in the composition of the biotas. Hernández & Carrasco (2004) reported arid to warm humid climates (temperature ranges between 12 and 25 °C, and annual precipitation ranges between 300 mm and 4,000 mm). The northern and southern regions of the Sierra Madre Oriental are separated by the Pánuco Depression; a warm and humid climate dominates on the Gulf of Mexico slope, while it becomes arid and warm towards the western slope and the south, and colder towards the north, particularly in the highlands (Hernández & Carrasco 2004, Figure 1). The climatic differences of the Sierra Madre Oriental with respect to the Trans-Mexican Volcanic Belt and Mexican Plateau are also striking, with colder temperatures and higher humidity or aridity in the last two regions (Figure 1).
Sampling strategy. Leaf samples were collected from 39 populations of Q. mexicana throughout its geographic distribution (Figure 1, Appendix 1) (Valencia-Á. 2004). In each population, 10 individuals separated by at least 20 m apart were randomly selected. From each tree, 15 mature leaves were collected from the lower branches. The collected leaves were pressed and dried in an oven at 70 °C.
Leaf macromorphological traits. For each of the 5,507 sampled leaves, leaf length and thickness were measured with a digital Vernier caliper. Measurements of dry weight were performed with an analytical balance (precision = 0.001 g). Leaf area (LA, cm2) was estimated through a quantitative evaluation of the area and leaf shape contours using elliptical Fourier descriptors with SHAPE ver. 3.1 software (Iwata & Ukai 2002). With this procedure, a matrix of eight macromorphological traits (MMAC, Table 1) was constructed: leaf length, leaf width, leaf length/leaf width ratio, number of secondary veins, leaf thickness, specific leaf area, petiole length and petiole width.
Table 1 List of macro- and micromorphological leaf traits and environmental variables used to identify the differentiation among populations of Quercus mexicana.
| Leaf morphological traits (MMOR) | |||
|---|---|---|---|
| Macromorphological (MMAC) traits | Micromorphological (MMIC) traits | ||
| LL | Leaf length | DTR | Density of trichomes |
| LW | Leaf width | STD | Stomatal density |
| LWr | Leaf (length / width) ratio | STL | Stomatal aperture length |
| PL | Petiole length | ||
| PW | Petiole width | ||
| SLA | Specific leaf area | ||
| NV | Number of secondary veins | ||
| LT | Leaf thickness | ||
| Environmental variables | |||
| Water-related variables | Temperature-related variables | ||
| AI | Aridity index | AMT | Annual mean temperature |
| PET | Potential of evapotranspiration | TS | Temperature seasonality |
| AP | Annual precipitation | ATR | Annual temperature range |
| PS | Precipitation seasonality | MTC | Mean temperature of coldest quarter |
| PD | Precipitation of driest quarter | ||
Leaf micromorphological traits. We randomly selected four to six leaves per population of Q. mexicana for a total of 228 leaves to measure leaf trichomes and stomata using scanning electron microscopy (SEM). Three images corresponding to the X100, X200 and X500 fields for each leaf were taken; in total, 684 images were analyzed. For each population, trichome density (trichome number/area) was quantified using X100 field images and stomatal density (stomatal number/area) with X200 field images with the Digimizer software (www.digimizer.com). The X500 images were used to measure stomatal aperture length in µm. The three variables were integrated into a micromorphological matrix (MMIC, Table 1) for further analysis.
Environmental variables. A matrix of nine environmental variables without collinearity that described the conditions of each sampled population was constructed (Table 1). Seven noncorrelated bioclimatic variables were obtained from WorldClim (Hijmans et al. 2005): annual mean temperature, temperature seasonality, annual temperature range, mean temperature of coldest quarter, annual precipitation, precipitation seasonality, and precipitation of driest quarter. Potential evapotranspiration and an aridity index were obtained from the Global Aridity Index and Potential Evapotranspiration Climate Database version 2.0 (Trabucco & Zomer 2009). Potential evapotranspiration relates the evapotranspiration processes and rainfall deficit, and aridity index represents the ratio between precipitation and potential evapotranspiration (high or low values of aridity index correspond to wet or arid conditions, respectively). Latitude was added as a geographic variable. Visualization and manipulation of climatic information was performed using ArcMap® v. 10.2 (ESRI). The overall topographic variables were calculated using Google Earth®.
Univariate analyses. Statistics of each morphological trait were calculated for each of the 39 populations. As a first step, to determine the differences in leaf morphological and functional traits among populations of Q. mexicana, we used ANOVA for each of the eight macromorphological and the three micromorphological variables, and a Tukey-Kramer test was conducted for a posteriori comparison among populations using R v. 3.6.1 software (R Core Team 2016). Then, data normality was tested using a Shapiro-Wilk test, and Pearson correlations were calculated with R software, using nine bioclimatic variables and latitude as independent variables and eight macromorphological (MMAC) and three micromorphological traits (MMIC) as dependent variables.
Multivariate analyses. We performed discriminant function analysis (DFA) and clustering analysis (CA) to identify leaf morphological groups among populations. First, a DFA was performed based on the morphofunctional traits (MMAC, MMIC, and MMOR), and we used each of the 39 populations as a discriminant factor. Second, from the DFA results, the centroids of each population were obtained, the Euclidian distance among centroids was calculated, and the CA was performed with the Ward method (Ward & Hook 1963). The CA was performed to yield a dendrogram depicting the morphological relatedness among the means of individuals in each population.
From the previously identified groups (named morphogroups), a DFA was performed based on the differences among environmental conditions between morphogroups. Three independent analyses were conducted following the previous procedure: the first considering macromorphological traits (DFAMAC), the second with micromorphological traits (DFAMIC) and the third considering both attribute sets (DFAMOR). This procedure was performed with R software.
To evaluate the contribution of temperature and water availability to leaf morphological variation at a global scale, three redundancy analyses (RDAs) were performed considering the following data sets: a) a complete model including both sets of bioclimatic variables (RDAfull: space + climate), b) a partial model considering temperature-related variables controlling the water effect (pRDA1: climate|space), and c) a partial model considering water-related variables controlling the temperature effect (pRDA2: space|climate). Three independent analyses were performed: the first considering macromorphological traits (RDAMAC), the second with micromorphological traits (RDAMIC) and the third considering both traits (RDAMOR). This procedure was performed with the vegan package in R software.
Results
Univariate analyses. All the morphological traits, except for stomatal density, showed significant differences among populations (Figure 2; Appendix 1). After Tukey's test (with at least P < 0.05), the morphological traits that had the greatest differences among populations were leaf width, leaf thickness, number of secondary veins and petiole length. In addition, all the morphological traits displayed gradual variation among all the populations (Figure 2).
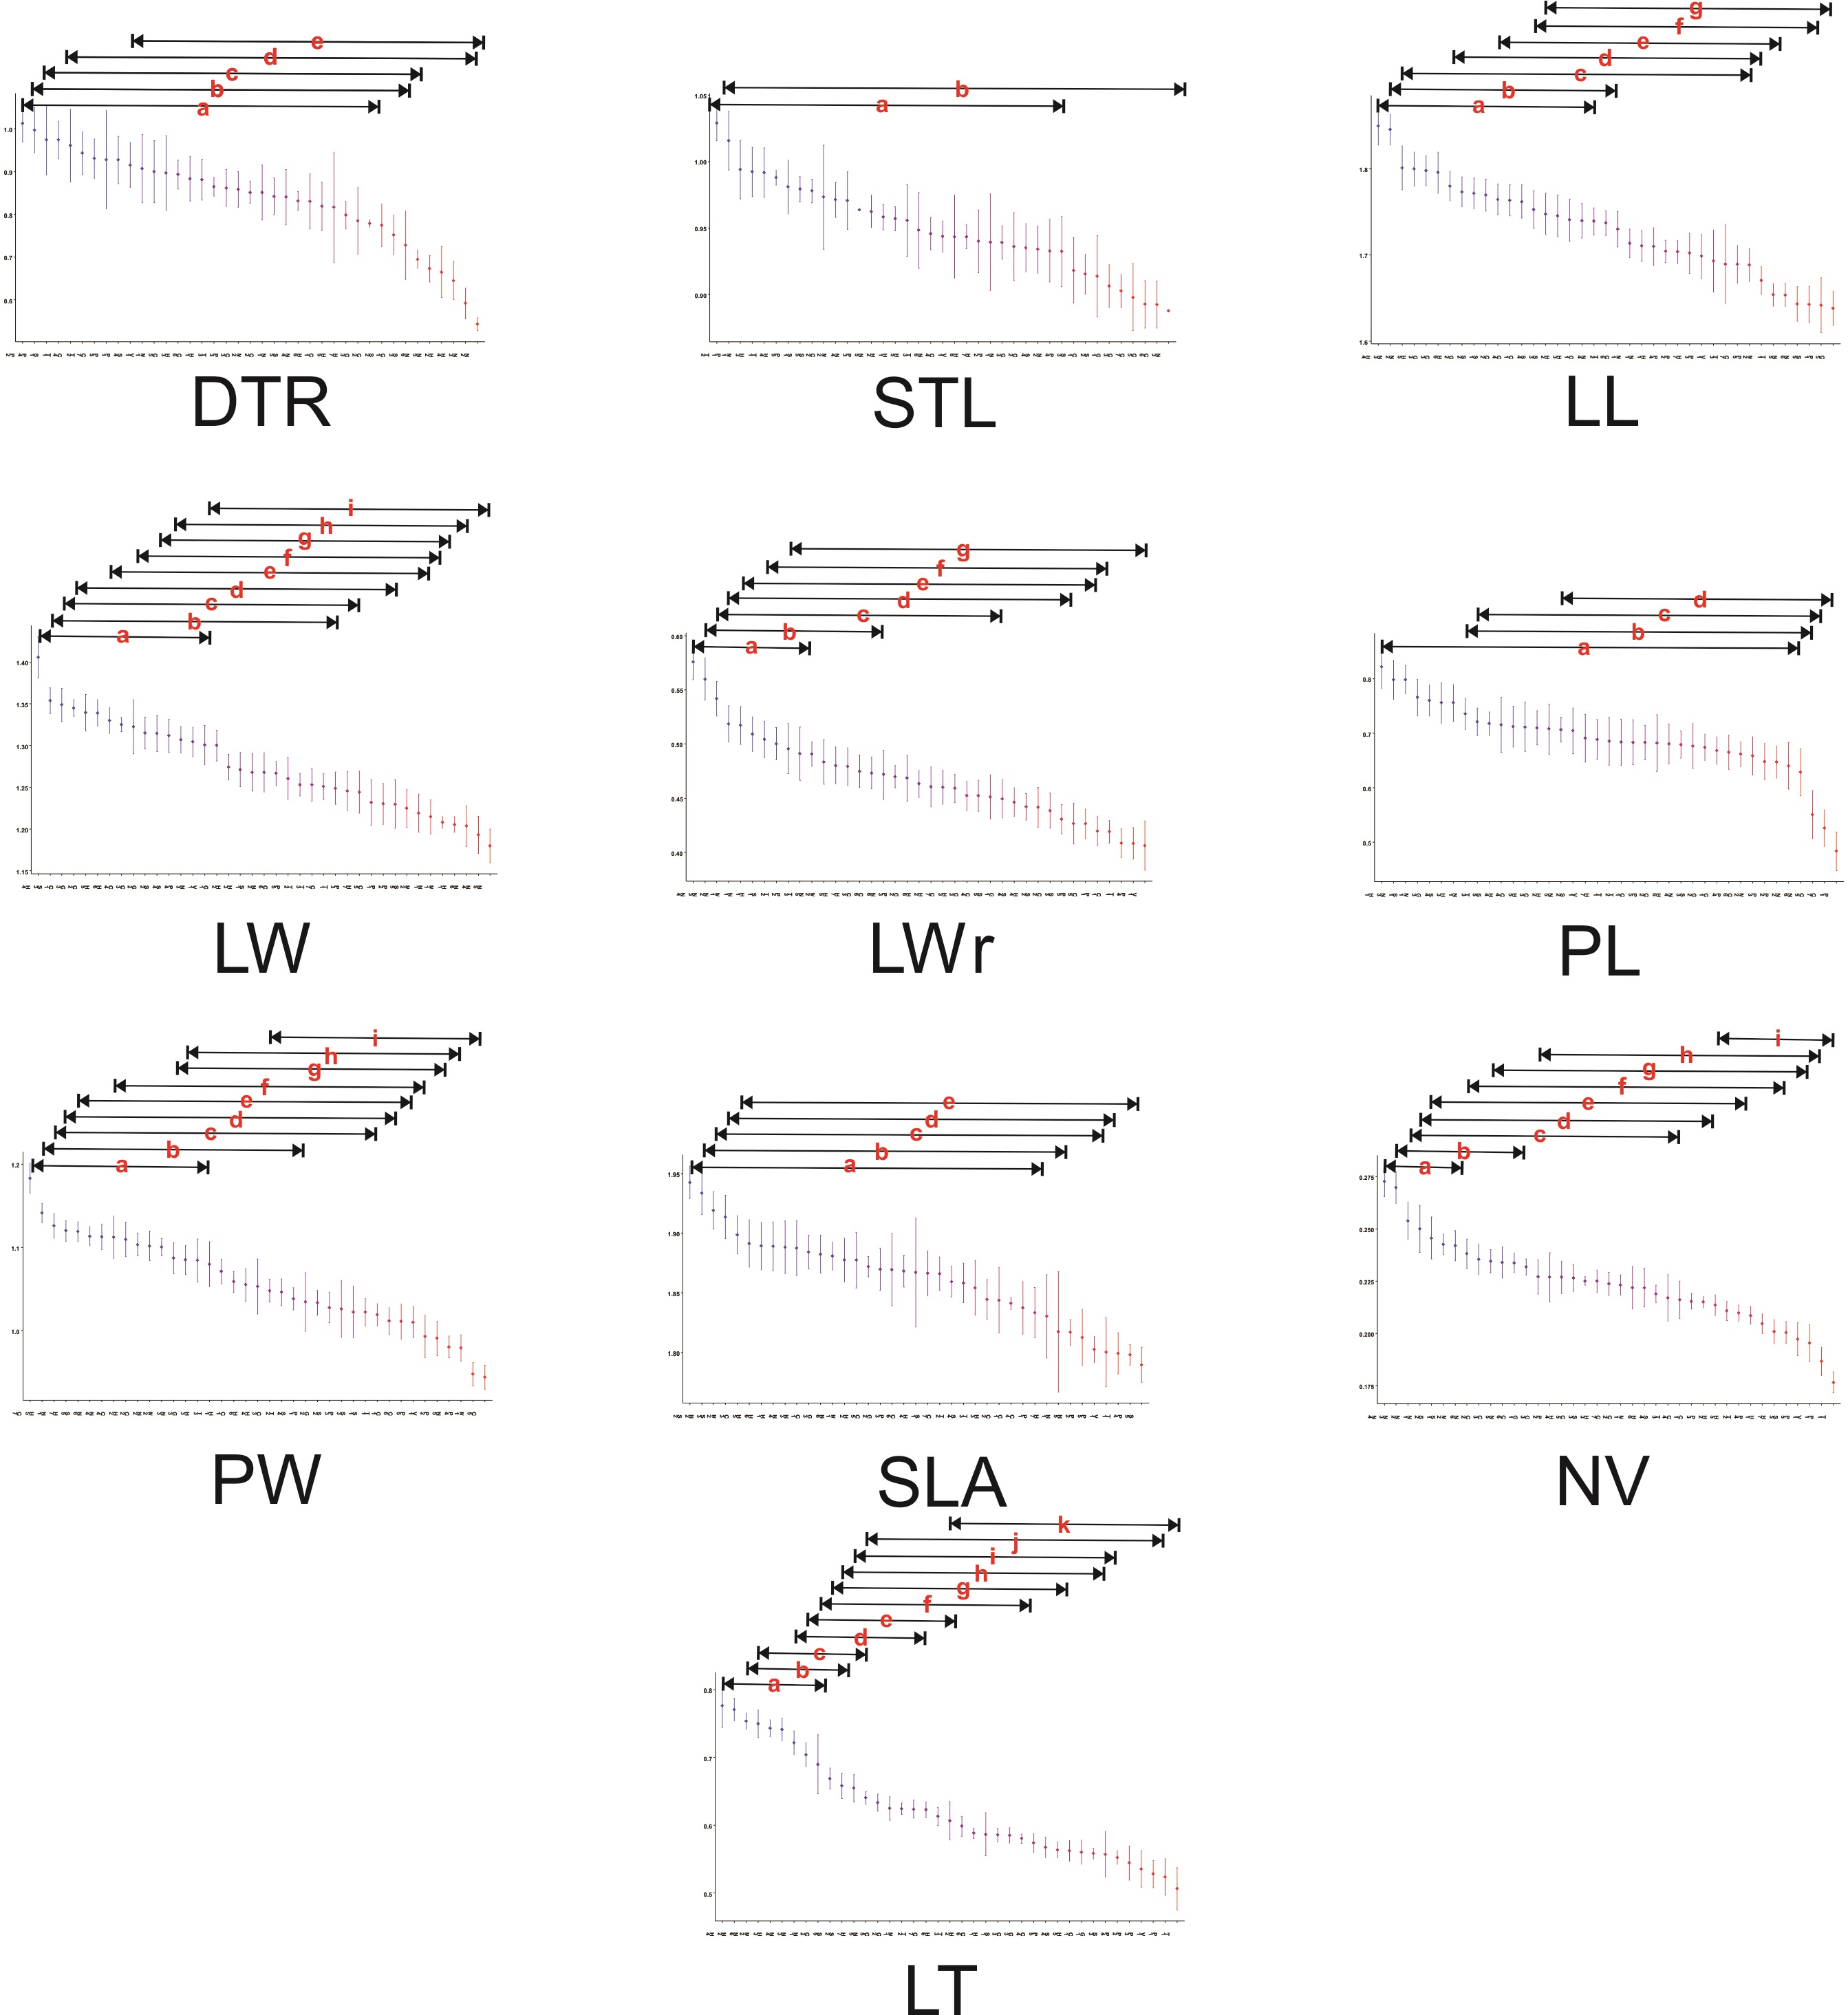
Figure 2 Summary of the Tukey-Kramer post-hoc tests for the differentiation of micro- and macromorphological traits among populations of Quercus mexicana. Lines above populations indicate no significant differences (at P < 0.05) and only the results with a significance P < 0.001 are presented. Abbreviations of leaf morphological traits as indicated in Table 1.
Among the macromorphological traits, leaf length varied without a regional pattern, whereas leaf width was significantly smaller and the leaf length/width ratio was significantly larger in the northern populations of the Sierra Madre Oriental (Figure 1). Petiole length was significantly longer in some populations in the north of the Sierra Madre Oriental (N1, N2, S1), in Hidalgo (H1, H3), and in the Trans-Mexican Volcanic Belt in Estado de Mexico and Tlaxcala (T3). Significantly wider petioles were detected in a group of populations in the northern Sierra Madre Oriental (N1, N4, N6, S5) and in the southwestern Sierra Madre Oriental (H5, Q4, Q7); narrower petioles were found in the southeastern Sierra Madre Oriental (H7, V1, P4) and parts of the Trans-Mexican Volcanic Belt (M1, P2). The specific leaf area differed in only a couple of populations in the north, and some populations displayed smaller leaf areas. The number of veins was significantly greater in the northern Sierra Madre Oriental and smaller in the southeastern Sierra Madre Oriental (H1, H7, P5, V1) as well as in some populations of the Trans-Mexican Volcanic Belt (P1, T1). The thickest leaves were found in the northern Sierra Madre Oriental and in populations in the southwestern Sierra Madre Oriental (H3, H4, M2). Significantly thinner leaves were found in several populations, predominantly in San Luis Potosí, Puebla, and Querétaro (Appendix 2).
With respect to the micromorphological traits, the populations that displayed the highest density of trichomes were in Puebla (P2, P4), and the lowest density of trichomes was found in populations of the northern Sierra Madre Oriental (N2, N3, N5), as well as populations in Hidalgo (H2, H4). The stomatal aperture length was smaller in most of the populations from Querétaro, as well as some in the north (N3, S2); the largest stomatal aperture was found in populations from the Trans-Mexican Volcanic Belt, significantly differing only in Tlaxcala (T2) (Figure 2; Appendix 2).
In the linear correlation analyses (Table 3; Figure 3), leaf length and specific leaf area displayed similar correlations with the environmental variables; they were positively correlated with latitude, all the temperature variables, potential evapotranspiration, and precipitation of driest quarter, and negatively correlated with the aridity index. Leaf width followed a similar pattern except that it was correlated with precipitation seasonality, and no correlation with the aridity index was found. The leaf length/width ratio was only positively correlated with latitude and negatively correlated with precipitation seasonality. The number of veins and leaf thickness were positively correlated with latitude, temperature seasonality, potential evapotranspiration and precipitation of driest quarter, and the number of veins and leaf thickness were inversely correlated with the aridity index and precipitation seasonality. The number of veins was positively correlated with all the temperature variables. With regard to petiole size, petiole length was not correlated with temperature, but petiole width was negatively correlated with the annual temperature range; with respect to the precipitation variables, petiole length and width were negatively correlated with precipitation seasonality.
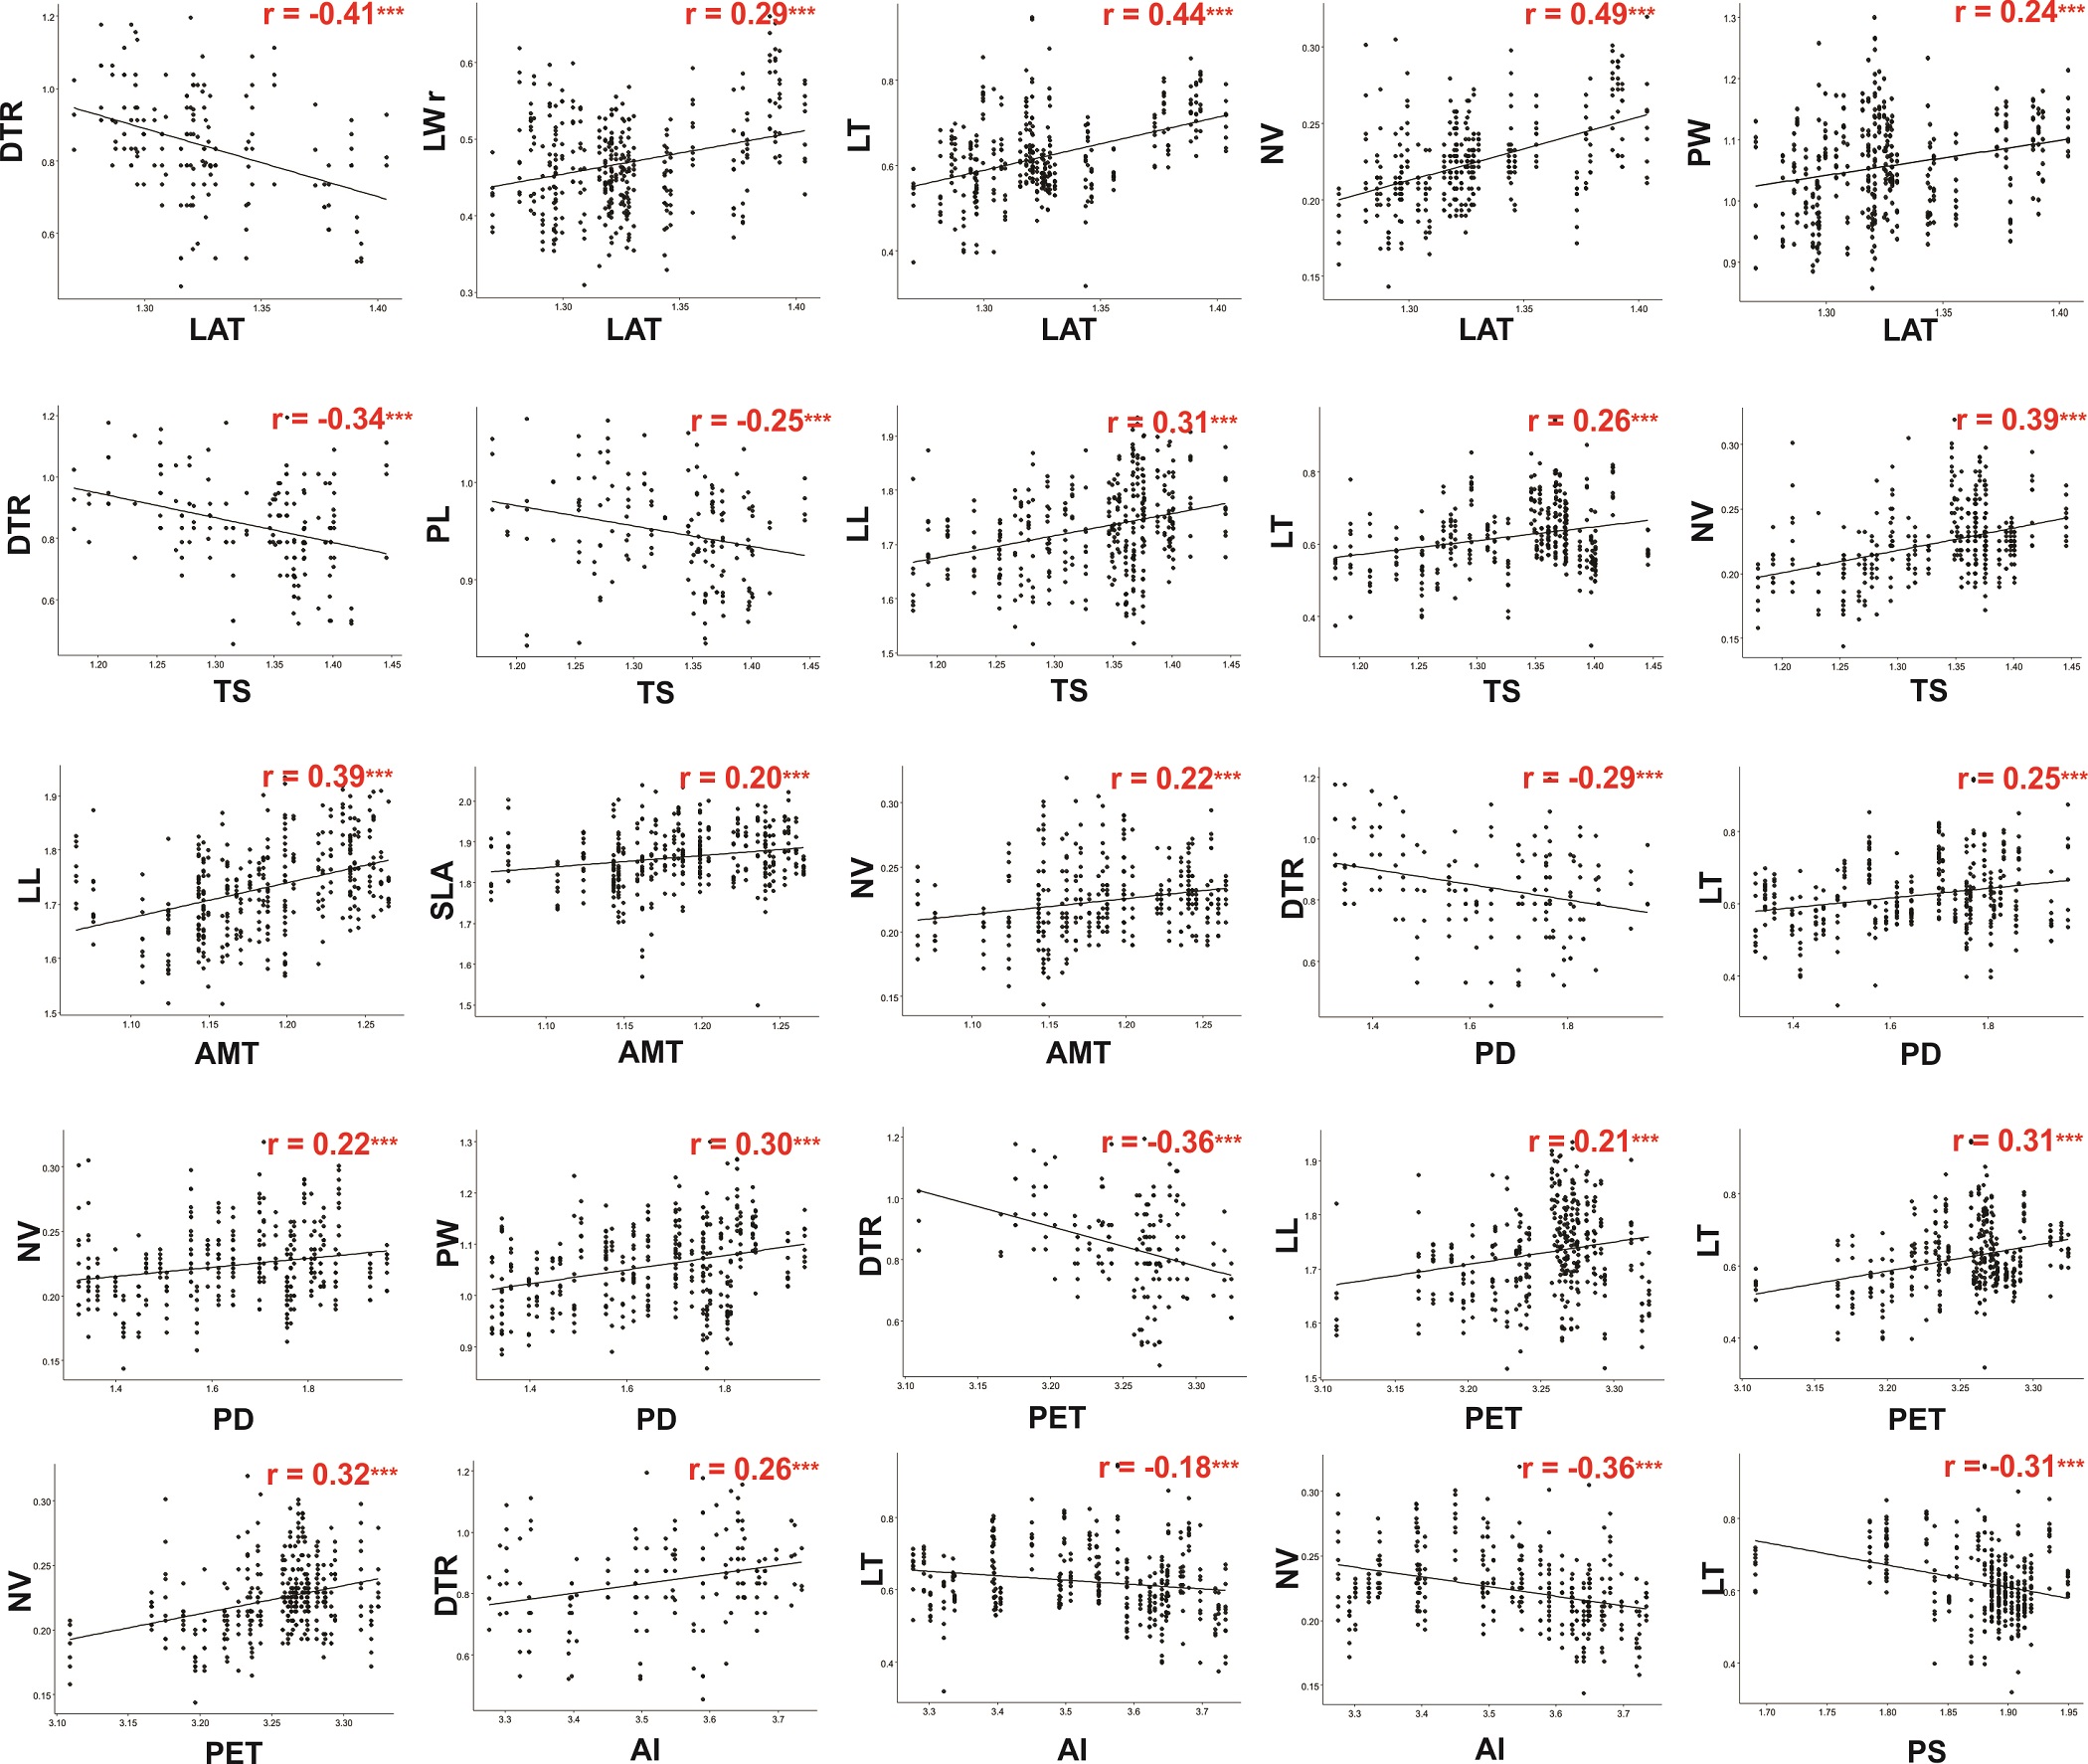
Figure 3 Graphs of Pearson’s correlations between leaf morphological traits and environmental variables. Only significant correlations are presented. Abbreviations of leaf morphological traits as indicated in Table 1.
Among the micromorphological characters, the density of trichomes showed a negative correlation with latitude, temperature seasonality, precipitation of driest quarter, and potential evapotranspiration but a positive correlation with the aridity index. Stomatal density was correlated only with potential evapotranspiration, while stomatal aperture length was negatively correlated with latitude, potential evapotranspiration, precipitation of driest quarter, and three of the temperature variables (Table 2).
Table 2 The results of ANOVA for the differentiation of leaf morphological traits among populations of Quercus mexicana. Abbreviations of leaf morphological traits as indicated in Table 1. Degrees of freedom (df), sum of squares (ss), mean squares (ms) and F-values are indicated (*** P < 0.001, and * P < 0.05).
| df populations /df residuals |
ss populations / ss residuals |
ms populations / ms residuals |
F value | |
|---|---|---|---|---|
| DTR | 38 / 126 | 1.953 / 1.741 | 0.05139 / 0.01381 | 3.72*** |
| STD | 38 / 126 | 0.471 / 1.026 | 0.01239 / 0.00814 | 1.522* |
| STL | 38 / 126 | 0.194 / 0.241 | 0.0051 / 0.00191 | 2.671*** |
| LL | 38 / 329 | 1.088 / 1.358 | 0.02862 / 0.00412 | 6.933*** |
| LW | 38 / 329 | 1.018 / 1.286 | 0.02679 / 0.0039 | 6.855*** |
| LWr | 38 / 329 | 0.579 / 0.859 | 0.01524 / 0.00261 | 5.836*** |
| PL | 38 / 329 | 1.571 / 4.128 | 0.04134 / 0.01255 | 3.295*** |
| PW | 38 / 329 | 1.115 / 1.163 | 0.02933 / 0.00353 | 8.298*** |
| SLA | 38 / 329 | 0.512 / 1.422 | 0.01349 / 0.00432 | 3.121*** |
| NV | 38 / 329 | 0.145 / 0.147 | 0.00381 / 0.00044 | 8.515*** |
| LT | 38 / 329 | 2.047 / 1.178 | 0.05386 / 0.00358 | 15.04*** |
Table 3 Results of Pearson’s correlations between environmental variables and leaf morphological traits. Abbreviations of leaf morphological traits as indicated in Table 1. Significant values: *** P < 0.001, ** P < 0.01 and * P < 0.05.
| Micromorphological traits | Macromorphological traits | |||||||||||
|---|---|---|---|---|---|---|---|---|---|---|---|---|
| DTR | STD | STL | LL | LW | LWr | PL | PW | SLA | NV | LT | ||
| LAT | -0.41*** | 0.05 | -0.18* | 0.16** | -0.04 | 0.29*** | 0.12* | 0.24*** | 0.12* | 0.49*** | 0.44*** | |
| Precipitation | AI | 0.26*** | -0.10 | 0.23** | -0.15** | -0.09 | -0.07 | -0.10* | 0.01 | -0.13* | -0.36*** | -0.18*** |
| PET | -0.36*** | 0.17* | -0.19* | 0.21*** | 0.15** | 0.08 | 0.15** | 0.17** | 0.18*** | 0.32*** | 0.31*** | |
| AP | 0 | 0 | -0.11 | 0.04 | 0.09 | -0.07 | -0.15** | 0.13* | 0.07 | -0.08 | -0.02 | |
| PS | 0.20** | 0.05 | -0.02 | 0.07 | 0.21*** | -0.23*** | -0.11** | -0.18*** | 0.07 | -0.19*** | -0.31*** | |
| PD | -0.29*** | -0.02 | -0.21** | 0.16** | 0.09 | 0.08 | -0.05 | 0.30*** | 0.14** | 0.22*** | 0.25*** | |
| Temperature | AMT | -0.14 | 0.09 | -0.22** | 0.39*** | 0.39*** | -0.02 | 0.01 | -0.04 | 0.20*** | 0.22*** | 0.04 |
| TS | -0.34*** | 0.1 | -0.25*** | 0.31*** | 0.26*** | 0.07 | 0.07 | 0.13* | 0.23*** | 0.39*** | 0.26*** | |
| ATR | 0.06 | 0.08 | -0.05 | 0.11* | 0.16** | -0.05 | 0 | -0.19*** | 0.11* | 0.17** | 0.02 | |
| MTC | -0.06 | 0.08 | -0.20* | 0.38*** | 0.39*** | -0.05 | 0 | -0.09 | 0.18*** | 0.14** | -0.03 | |
The highest correlation scores with temperature variables were observed for annual mean temperature and temperature seasonality in relation to leaf length, leaf width, density of trichomes and number of veins. On the other hand, the water availability variable with the highest correlation scores was potential evapotranspiration in relation to the density of trichomes and number of veins.
Multivariate analyses. DFA of micromorphological traits (DFAMIC) explained 51.3 % of the variation for the first discriminant function (DF1), and 30.5 % for the second discriminant function (DF2, Figure 4A). For the DFAMAC, DF1 explained 42.4 % of the variation, and DF2 explained 24.1 % (Figure 4B). In the combined dataset, DFAMOR, the DF1 explained 30 % and DF2 explained 23.3 % of the differentiation among populations (Figure 4C). All the axes were significant according to Wilk’s lambda (Figure 4). From the three analyses, the highest percentage of accurate classification was obtained with DFAMOR (68.1 %). In the three DFAs, the populations from northern Sierra Madre Oriental together with others from Hidalgo formed a separate group (Figure 4). In the DFAMIC, the density of trichomes was the trait that contributed most to explaining the DF1, while stomatal length aperture explained the variation in DF2. In DFAMAC and DFAMOR, leaf thickness and leaf length presented the highest scores in discriminating populations.
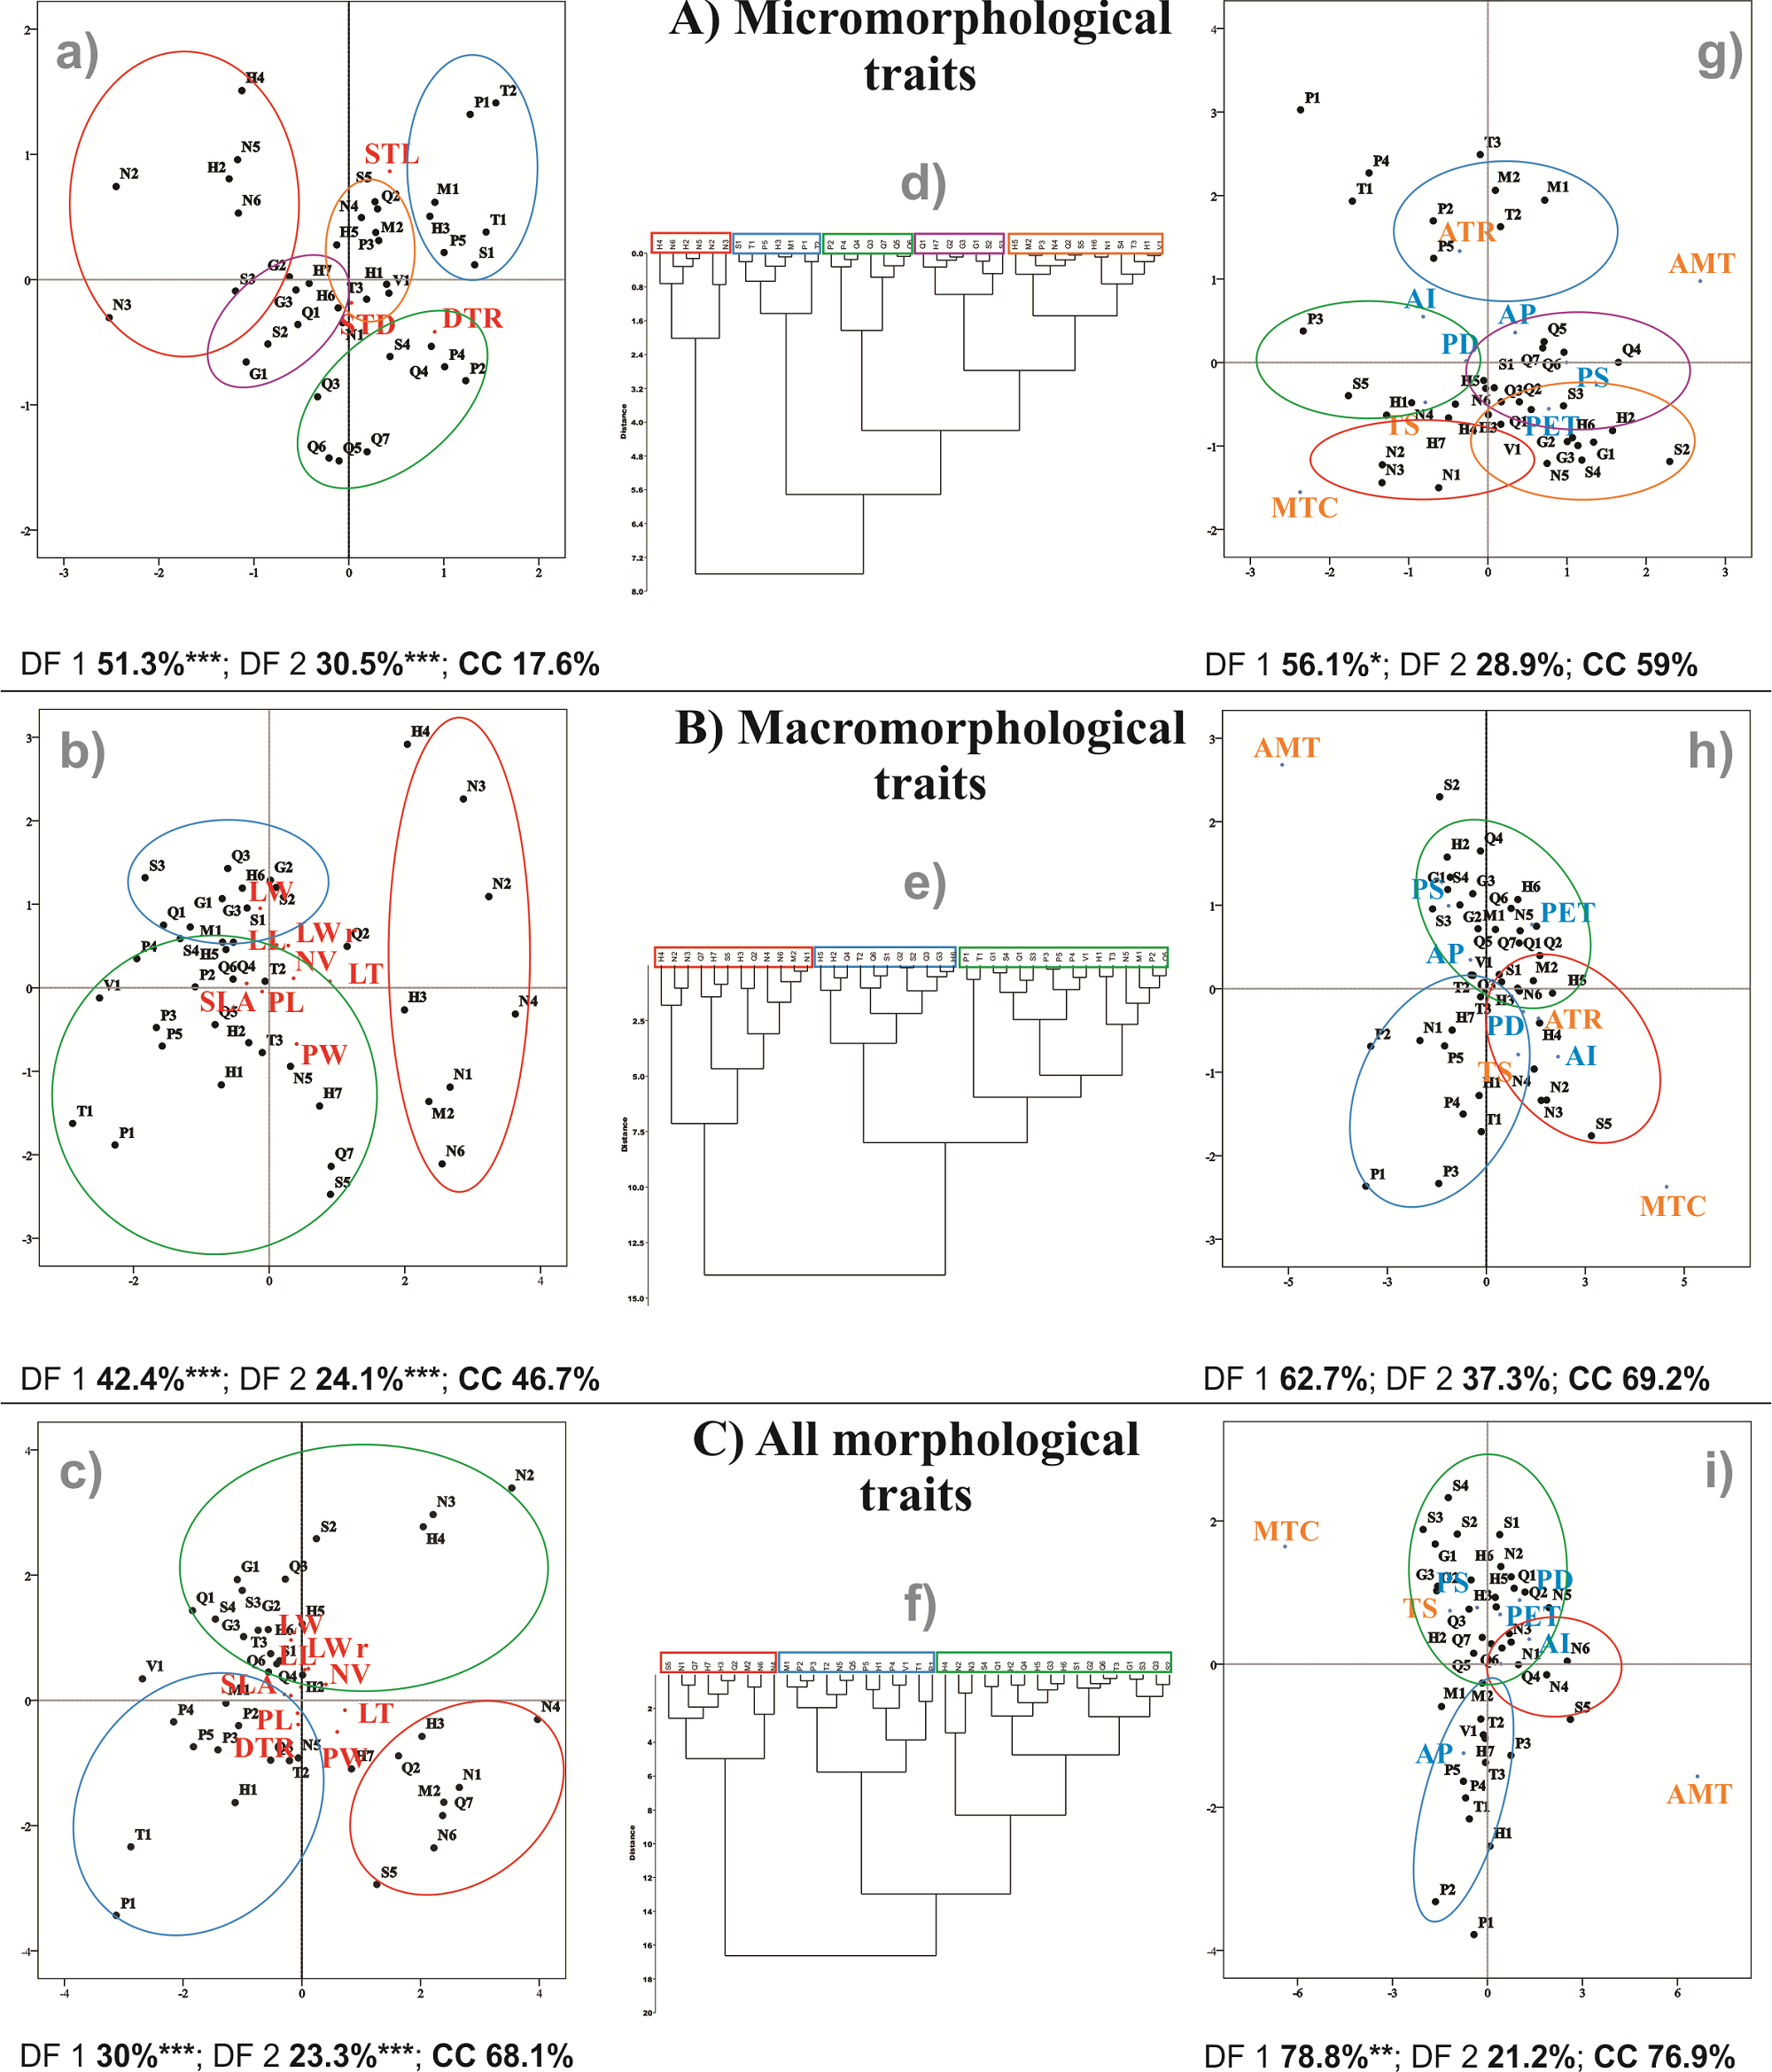
Figure 4 Discriminant function analyses (DFA) and clustering analyses (CA) for A) micromorphological traits, B) macromorphological traits and C) combined both datasets. DFA based on morphological traits (left: letters a, b, c), groups identified in the CA (center: d, e, f) and DFA based on environmental differences (right: g, h, i) are presented. Percentage of explained variation of the first two discriminant functions and CC represent the percentage of correctly classified cases in DFA. *** P < 0.001, ** P < 0.01, * P < 0.05. Abbreviations of location as shown in Figure 1 (described in Appendix 1) and of morphological traits indicated in Table 1.
The cluster analyses allowed us to identify five groups for micromorphological traits and three groups for macromorphological traits and another three for all the morphological traits (Figure 4). The first group of the cluster with all the morphological traits comprised populations from the northern of Sierra Madre Oriental and Altiplano and southern Sierra Madre Oriental regions (Figure 4C). The traits that characterized this first group were thin leaves (range 0.17 to 0.22 mm) and wide petioles (1.31 to 1.58) (DFAMOR, Figure 4C). The second group included populations from the Trans-Mexican Volcanic Belt, the southeastern Sierra Madre Oriental and one in the north. This group was characterized by high density of trichomes (8.4 to 10.56 per mm2), large stomatal aperture (8.59 to 11.09 mm2), and short (4.35 to 5.26 cm) and narrow (1.55 to 1.86 cm) leaves (DFAMOR, Figure 4C). In the third group, most of the populations were located on the western slope of the southern Sierra Madre Oriental, in San Luis Potosí and some in the northernmost distribution (Figure 4C). The traits that characterized this group were long (5.67 to 7.29 cm) and wide (1.87 to 2.63 cm) leaves with low density of trichomes (3.5 to 7.49 per mm2).
DFA based on environmental variables for DFAMIC, explained 56.1 and 28.9 % of the variance via the first two discriminant functions, respectively; only the first function was significant (Figure 4A). The contribution of precipitation seasonality to the first discriminant axis was the most important for separating the populations; however, the groups were not recovered according to the morphofunctional traits, with 59 % of them correctly classified. For DFAMAC, the first two discriminant functions explained 62.7 and 37.3 % of the variance, and neither of them was significant. The analysis that best explained the variance of the discriminant functions was DFAMOR, with 78.8 and 21.2 % for the first two discriminant functions, respectively. However, only the first function was significant. The climatic variables of temperature seasonality and potential evapotranspiration were the most important for discriminating among populations according to DF1, and these variables characterized the group of populations of the western slope of the Sierra Madre Oriental. The northern Sierra Madre Oriental group was better explained by the aridity index; the Trans-Mexican Volcanic Belt + southeastern Sierra Madre Oriental group was better explained by negative scores of annual precipitation (Figure 4C).
In the redundancy analyses, temperature-related variables explained 2.83 % (RDAMIC; P > 0.05), 4.77 % (RDAMAC: P < 0.001) and 5.45 % (RDAMOR: P < 0.001) of leaf variation, with significance in the last two analyses. Water-related variables significantly explained 5.0 % (RDAMIC; P < 0.05), 7.47 % (RDAMAC: P < 0.001) and 9.84 % (RDAMOR: P < 0.001) of the leaf variation. The interaction of temperature and water variables significantly explained 18.06 % (RDAMIC; P < 0.001), 17.01 % (RDAMAC: P < 0.001) and 20.83 % (RDAMOR: P < 0.001) of the leaf variation (Appendix 3). For the full RDA, the most important and significant environmental variable in RDAMIC was precipitation of driest quarter; for RDAMAC and RDAMOR the most important variables were precipitation seasonality, precipitation of driest quarter and the aridity index (Appendix 3). When plotting the full redundancy analysis results, precipitation seasonality and the aridity index were positively correlated with the density of trichomes. Potential evapotranspiration, precipitation of driest quarter, and temperature seasonality were negatively correlated with petiole width and leaf thickness (Figure 5).
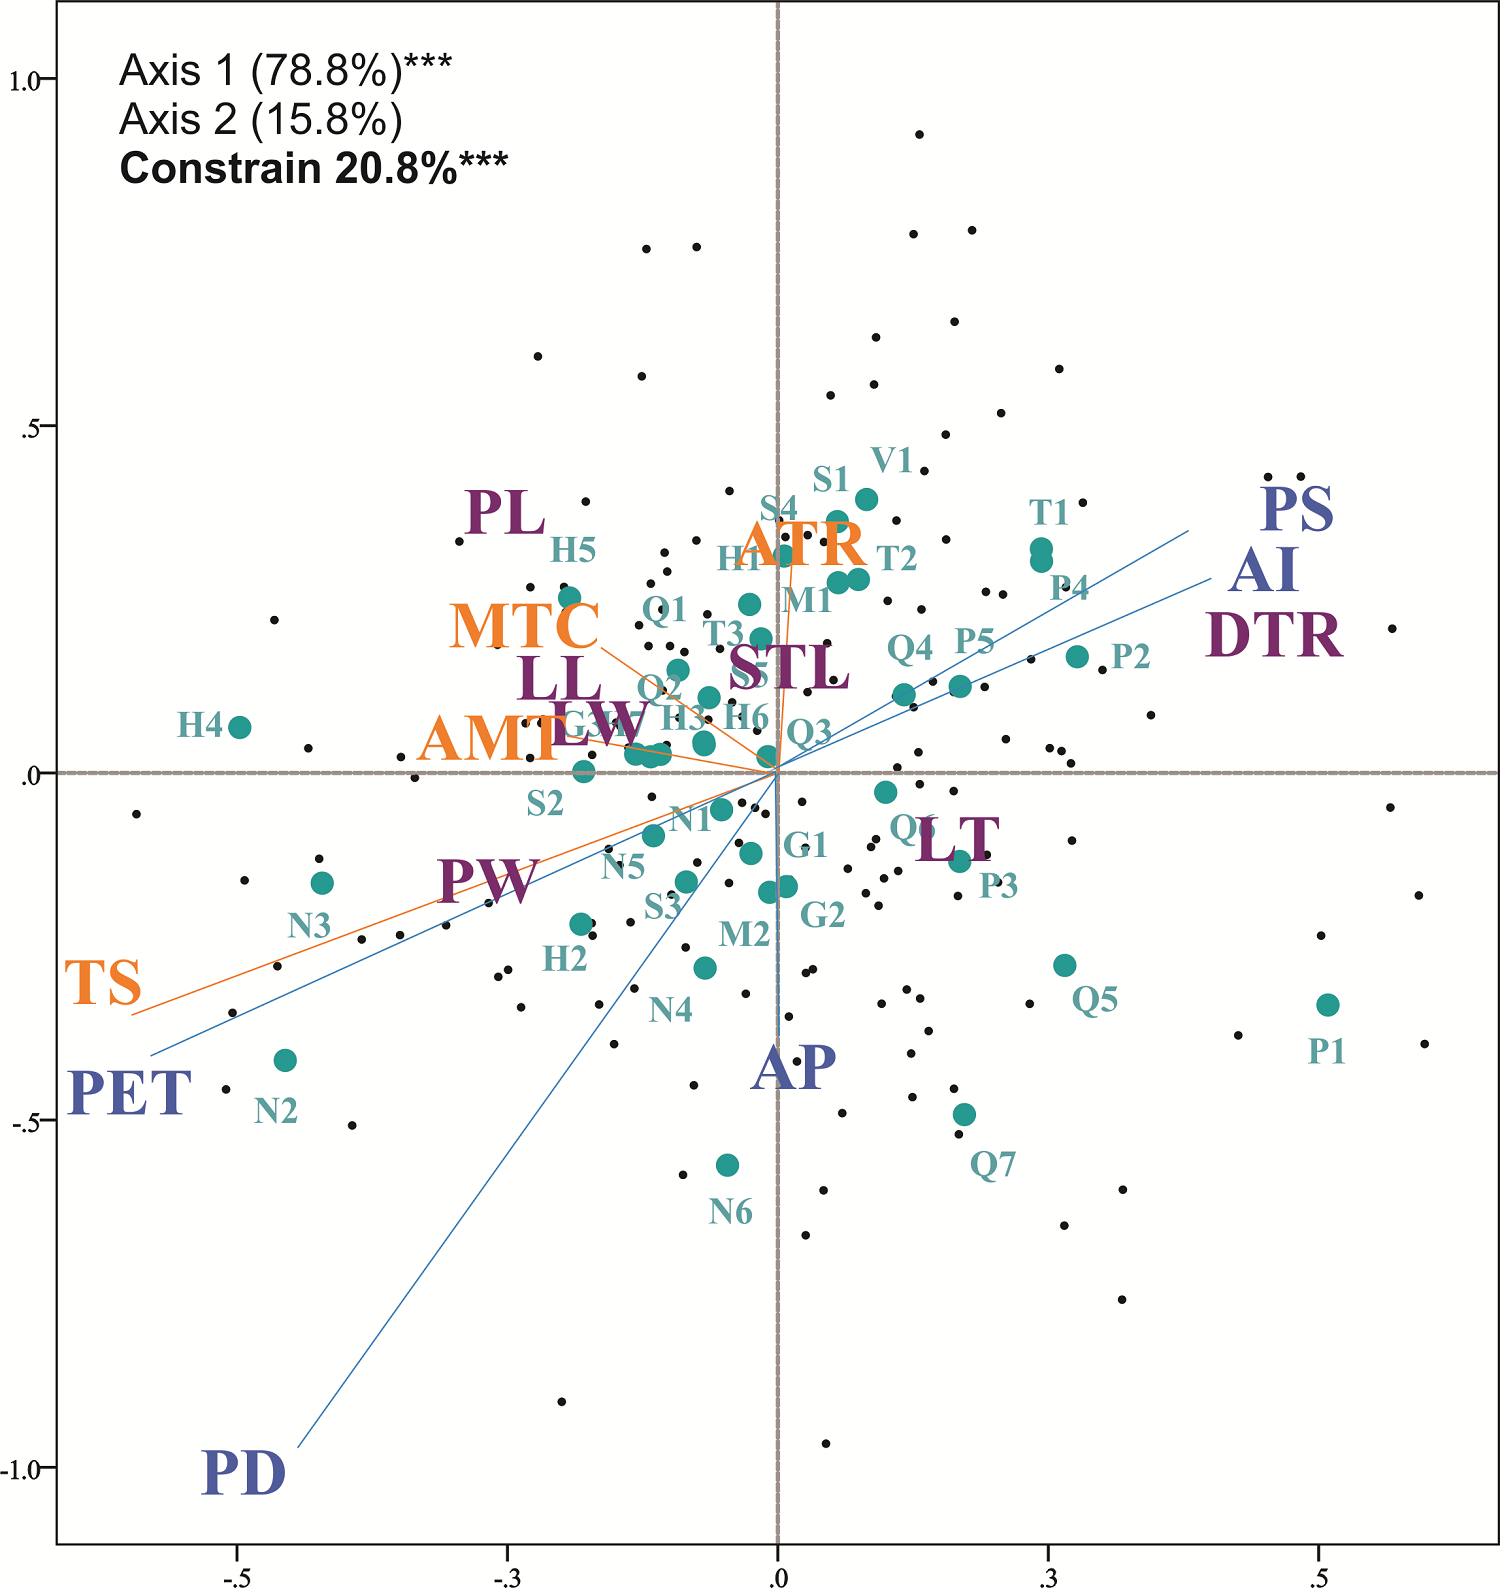
Figure 5 Full redundancy analysis with the complete data set of morphological and environmental variables (RDAMOR). Purple letters represent morphological traits, orange letters represent temperature variables and blue letters represent precipitation variables. Dots in green indicate the populations of Quercus mexicana (abbreviations of localities are described in Appendix 1). Percentage of explained variation of each axis at *** P < 0.001.
Discussion
Leaf morphological variability. Populations of Q. mexicana showed variable leaf traits along their distribution, with groups of similar traits, although some populations with similar traits are not geographically proximal. Variation in leaf traits over a wide distribution area and along environmental gradients has been detected in Q. rugosa (Uribe-Salas et al. 2008), Q. elliptica (Maya-García et al. 2020) and Q. deserticola (Rodríguez-Gómez et al. 2018). Leaf morphological variation at the landscape level has also been observed in Q. castanea (Lara-De la Cruz et al. 2020).
Specifically, the northern Sierra Madre Oriental populations showed the greatest differences and were more consistent with the recovered groups; in the correlation analyses, these populations showed most of the significant differences in leaf trait variation. Indeed, latitude was positively correlated with most of the traits evaluated. A correlation with a latitudinal trend has also been found in Q. rugosa (Uribe-Salas et al. 2008), in which shorter leaves were present in its northern distribution. The most important traits for differentiating the northern Sierra Madre Oriental group from the rest of the populations were leaf thickness and petiole width. Leaf thickness was the most significantly different trait among the populations; this trait was also the most differentiated for Q. castanea populations at the landscape level (Lara-De la Cruz et al. 2020).
Relationships with environmental factors. In Q. mexicana, all the leaf traits showed correlations with variables of precipitation and temperature, except for stomatal density. In several studies, leaf variability and geographical differentiation of Quercus species have also been correlated with environmental variables (e.g., Uribe-Salas et al. 2008, Rodríguez-Gómez et al. 2018, Maya-García et al. 2020).
In this study, leaf thickness was correlated with temperature seasonality, indicating its association with extreme temperatures, which coincides with the northern Sierra Madre Oriental populations, and thinner leaves were associated with less arid and more seasonal environments, coinciding with the Trans-Mexican Volcanic Belt and southeastern Sierra Madre Oriental populations climate (Figure 2). Lara-De la Cruz et al. (2020) also found thinner leaves at drier sites in Q. castanea at the landscape level. Contrary to our findings, in Q. elliptica, thickness was positively correlated with precipitation seasonality (Maya-García et al. 2020). Higher tissue density and thickness are correlated with higher water content (Vendramini et al. 2002). At sites with lower water availability, leaves are generally characterized by higher tissue density (de la Riva et al. 2016). Thus, a higher tissue density is associated with more successful performance under water-limited conditions (Harzé et al. 2016), which would explain the greater thickness and petiole width characterizing the northern Sierra Madre Oriental populations.
The largest specific leaf area of Q. mexicana was identified at drier sites with higher evapotranspiration and at higher latitudes. This result contrasts with the expectations of a correlation between specific leaf area and rainfall (Gouveia & Freitas 2009). Commonly, a decrease in specific leaf area has been associated with drier sites (Aranda et al. 2014) and an increase in temperature (Lee et al. 2005) in different oak species. The specific leaf area of Q. mexicana was also correlated with temperature variables. In other plant species, high temperature has been shown to decrease water use efficiency but increases specific leaf area (Meier & Leuschner 2008). Similarly, in Q. elliptica, specific leaf area was associated with drier conditions (Maya-García et al. 2020).
The number of secondary veins showed significant differentiation among populations and a significant correlation with all the environmental variables. Vein density shows a high inter- and intraspecific variation, and a very diverse responses to a combination of environmental traits (Zhu et al. 2012). For instance, higher vein density has been associated with higher sun exposure (Sack & Frole 2006) and drier soils for some species (Dunbar‐Co et al. 2009). In other species, higher vein density is found under more humid conditions (Zhu et al. 2012). For Q. mexicana, the correlations suggested that leaves with a larger number of secondary veins were associated with humidity and less marked precipitation seasonality, but leaves with a larger number of secondary veins were also associated with higher potential evapotranspiration and more marked temperature seasonality.
Among the micromorphological traits, the density of trichomes was the trait that showed the highest discrimination coefficient among populations of Q. mexicana. Populations with the highest trichome density were identified at lower latitudes, at sites with marked precipitation seasonality and less evapotranspiration, characterizing the populations of the southern Sierra Madre Oriental and Trans-Mexican Volcanic Belt (Figures 2, 3). Patterns of trichome density observed in other plant species indicate that greater density is associated with drier conditions (Pérez-Estrada et al. 2000, Benz & Martin 2006) or lower temperatures (Agrawal et al. 2004). Our results showed an inverse pattern of trichome density; for Q. mexicana lower trichome density characterized populations in the northern Sierra Madre Oriental located at sites with drier conditions and extreme high temperatures.
Although stomatal size and its density are relatively plastic traits (Richardson et al. 2001), we did not find significant differences among populations in stomatal density, nor did stomatal size or density show significant correlations with most of the environmental variables; only a significant correlation with potential evapotranspiration was found, as has been shown in other oak species (Nóbrega & Pereira 1992). Stomatal aperture length correlations with environmental variables indicate that larger stomata are associated with more humid conditions with less temperature seasonality. A small aperture length can provide a reduction in total pore area, facilitating faster closure in response to drier environments (Lawson & Blatt 2014), which would explain the presence of a larger stomatal aperture length in populations of the Trans-Mexican Volcanic Belt and southeastern Sierra Madre Oriental, where the conditions are more humid than those of the northern Sierra Madre Oriental.
On the other hand, the relationships that are established between micro- and macromorphological traits and environmental variables are very interesting and can be summarized by the RDA. First, the densities of trichomes and stomata are better explained by the seasonality of temperature and the availability of water. The size of the leaves seems to respond to changes in temperature; larger leaves and wider petioles are found in places with extreme temperature conditions, and the seasonality of temperature seems to be a key variable in the morphological variation and differentiation of Q. mexicana populations. Global trends indicate that leaves are generally smaller at drier and warmer sites, or at colder and wetter sites (Wright et al. 2017). The presence of larger leaves under drier or colder conditions is possible because of the thermoregulatory capability of leaves (Meier & Leuschner 2008, Michaletz et al. 2016): larger leaves can warm up fast on colder mornings, allowing better photosynthetic performance (Wright et al. 2017).
Even though we found that morphology was significantly correlated with environmental variables, the RDAs explained a relatively low, although significant percentage of the variation, specifically, when temperature and water variables were considered separately. This finding may be due to multiple factors, such as weak selection, extensive gene flow among populations (Riordan et al. 2016) or the effect of other environmental variables on populations, such as geomorphology or soil types (Wright et al. 2017). The global patterns of leaf change in relation to climatic variables also explain a small but significant amount of the variation, according to the evaluation of Wright et al. (2017).
To better understand the observed relationship between morphology and environmental variation and to assess if any of the aforementioned factors affect this relationship, it is necessary to assess the extent of genetic differentiation among the Q. mexicana populations. For example, in Q. deserticola, leaf variation is correlated with the environmental gradient of the Trans-Mexican Volcanic Belt but not with the genetic variation of the populations; phenotypic plasticity, common ancestry or adaptative differences could explain the environmental responses of the leaf variation (Rodríguez-Gómez et al. 2018).
Potential impacts of climate change. The morphological variability and differentiation among populations indicate species adaptability to environmental changes. Our results show a wide range of responses of Q. mexicana populations given the high environmental diversity of the distribution range of the species. Some trait variations seem to be restricted to specific climatic conditions or geographical areas, while other traits vary throughout the range without a specific pattern.
In Mexico, oak species have been moderately impacted by recurring climate changes caused by decreases in temperature coupled with conditions of moderated humidity throughout the Tertiary and Quaternary (Graham 1993). Palynological records indicated recurrent expansion-contraction changes in the communities of temperate plants during the Pleistocene (1.8 Ma to 10,000 years ago) in central Mexico (Lozano-García & Vázquez-Selem 2005). These outcomes suggested that species must have survived Pleistocene glaciations in areas with favorable climates at lower altitudes in the mountain major ranges of Mexico, and migration to higher elevations would have occurred during warm periods (Toledo 1982, Metcalfe et al. 2010). The effects of these climatic fluctuations on oak species in Mexico lead to more diversity and less genetic structure but larger historical population sizes and a complex exchange among species (González-Rodríguez et al. 2004, Tovar-Sánchez et al. 2008).
A recent assessment of the climatic trends between 1910 and 2009 in Mexico (Cuervo-Robayo et al. 2020) indicates that warmer and drier conditions can be expected in the species distribution area in the future. The Mexican Transition Zone, which includes the Sierra Madre Oriental and the Trans-Mexican Volcanic Belt, showed an increase of 0.03 °C in the annual mean temperature between 1950 and 2009 and a decrease of 12 mm in annual rainfall. If these trends continue, it is probable that populations of Q. mexicana adapted to drought or extreme temperatures will respond better to these climate changes. However, populations with morphological traits best adapted to humid conditions could be negatively affected.
Morphological and functional leaf traits show a plastic response in plants. In Q. mexicana, apart from plasticity, other factors could influence the variation in these traits. In the case of this endemic species, populations could face pressures from future climate changes, and a reduction in phenotypic plasticity and, consequently the genetic diversity of the species can be expected. Integrating data on the genetic structure of the species could provide a complete perspective on the future outcome for this endemic oak.

