


 nueva página del texto (beta)
 Inglés (pdf)
 Artículo en XML
 Referencias del artículo
 Enviar artículo por email
 Citado por SciELO
  Similares en
SciELO
Similares en
SciELO 
 Permalink
Mexico is among the most biologically and culturally diverse countries in the world. It is ranked within the top five “megadiverse” countries, which house between 60 - 70 % of all known biodiversity in the planet (Mittermeier et al. 1998). It is the fourth richest country in terms of endemic and native plants (Orantes-García et al. 2015).
Biotic and abiotic factors play a fundamental role in the distribution of plant species, since their physiology and phenology require specific temperature, humidity, soil, and luminosity conditions for them to germinate, grow, bloom, and fructify (Martínez-Pastur et al. 2017, Quirós et al. 2017). Currently, natural and human-driven changes in ecosystems throughout the planet have contributed to the redistribution of species. This has in turn caused changes in their physiological and phenological processes, given the fact that each species has a different tolerance interval to shifts in environmental and anthropogenic phenomena (Arias-Aguilar et al. 2016, Martínez-Pastur et al. 2017). Due to the dramatic transformations that humans have produced on the environment, effects on natural ecosystems have been documented, as has the direct impact caused by the loss of species caused by changes in the use of soil and vegetation. These effects on ecosystems are expected to translate into alterations in the distribution and abundance of species, or in the disappearance of some species or populations (Godoy-Burki 2016).
Regarding this, several predictive models have been designed to help estimate the potential distribution of wild species as to inform management and preservation actions (Bañuelos-Revilla et al. 2019). The models help determine the locations where environmental conditions are most favorable for a species to prosper according to parameters obtained from prior data collections. These models have proven useful for studies evaluating distribution patterns, such as biogeography, ecology, or conservation analyses (Quirós et al. 2017, González-Hernández et al. 2018).
Most models predicting the likely presence of a species in an unexplored area generally correlate known sites in which the species prospers with a combination of environmental factors, particularly climate. Bioclimatic and climatic variables are significant factors affecting or determining the distribution of organisms. However, the inclusion of variables that incorporate the phenology or physiology of a given species, improves predictive models (Lira-Noriega et al. 2013), and helps heighten accuracy when determining the reasons for the presence or absence of a species at particular sites (Chuine 2010, Chuine & Beaubien 2001, Martinez et al. 2014, Visser & Both 2005). Each species has their own bioclimatic profile, so analyzing the variables affecting said profile can help quantify the differences between climatic dominions (that is, the niche or space in which the survival of a species is deemed likely in natural conditions) for different species (Godoy-Burki 2016). This knowledge is of particular relevance for species with a restricted distribution, or those with populations at risk of disappearing or under an endangered category.
Croton guatemalensis is a tree that measures 5-15 m high, it is a species native to southeast Mexico (Chiapas) and Central America (Guatemala, El Salvador, Honduras, Nicaragua, Costa Rica, Panama), which is found within humid, dry, and mixed forests, commonly on rocky hillsides between 50 and 1,800 m asl. It is an evergreen tree with annual flowering (July-April) and fruiting (March-June) (Pozo-Gómez et al. 2020). Currently, it is under “Special protection” by Mexican law (SEMARNAT 2010) because there are no legal provisions for its use. Because it is a species used for multiple purposes, its availability is of great significance to diverse rural communities that count on it for construction, as firewood, as a live fence, or because of its medicinal properties (Pozo-Gómez et al. 2019).
Currently, no scientific literature exists on the potential distribution of C. guatemalensis so, for the first time, we determine this based on the use of climatic, bioclimatic variables and a layer of ideal habitat designed using variables of reproductive effort (number and size of seeds per fruit, seed health and viability) and reproductive success (germination rate). The inclusion of reproductive data in the model of potential distribution improves it providing precise information about the ideal habitats in which this species can thrive. Having precise data of the distribution of this multi-purpose protected species is of great relevance to establish management and conservation actions (Hernández-Ruíz et al. 2016).
Materials and methods
Study area. This study was carried out in the state of Chiapas, Mexico, which spans 75,634 km2 at 17° 59', 14° 32’ N and 90° 22', 94° 14' W (Figure 1). The study area includes nine local physiographic regions: I Coast Plain of Chiapas and Guatemala Discontinuity, II. South Chiapas Mountains Sub-Province, II. Central Depression of Chiapas Discontinuity, III. Central Depression of Chiapas Discontinuity, IV. Isthmus Plain Discontinuity, V. Central American Volcanoes Sub-Province, VI. Highlands of Chiapas Sub-Province, VII. Lacandon Mountain Range Sub-Province, VIII. Chiapas Northern Mountain Range Sub-Province, IX. Tabasco Plain and Swamp Sub-Province (El Colegio de la Frontera Sur, Ecosur 2005). C. guatemalensis may be located within tropical rain forests, medium strata tropical rainforest, tropical dry rainforests, and secondary vegetation, in soils with a pH ranging from 6.8 to 7.7 and which are rich in organic matter (3.01 - 4.20 %), have good porosity (40 - 55 %), and are clayey or highly clayey (Pozo-Gómez et al. 2019).
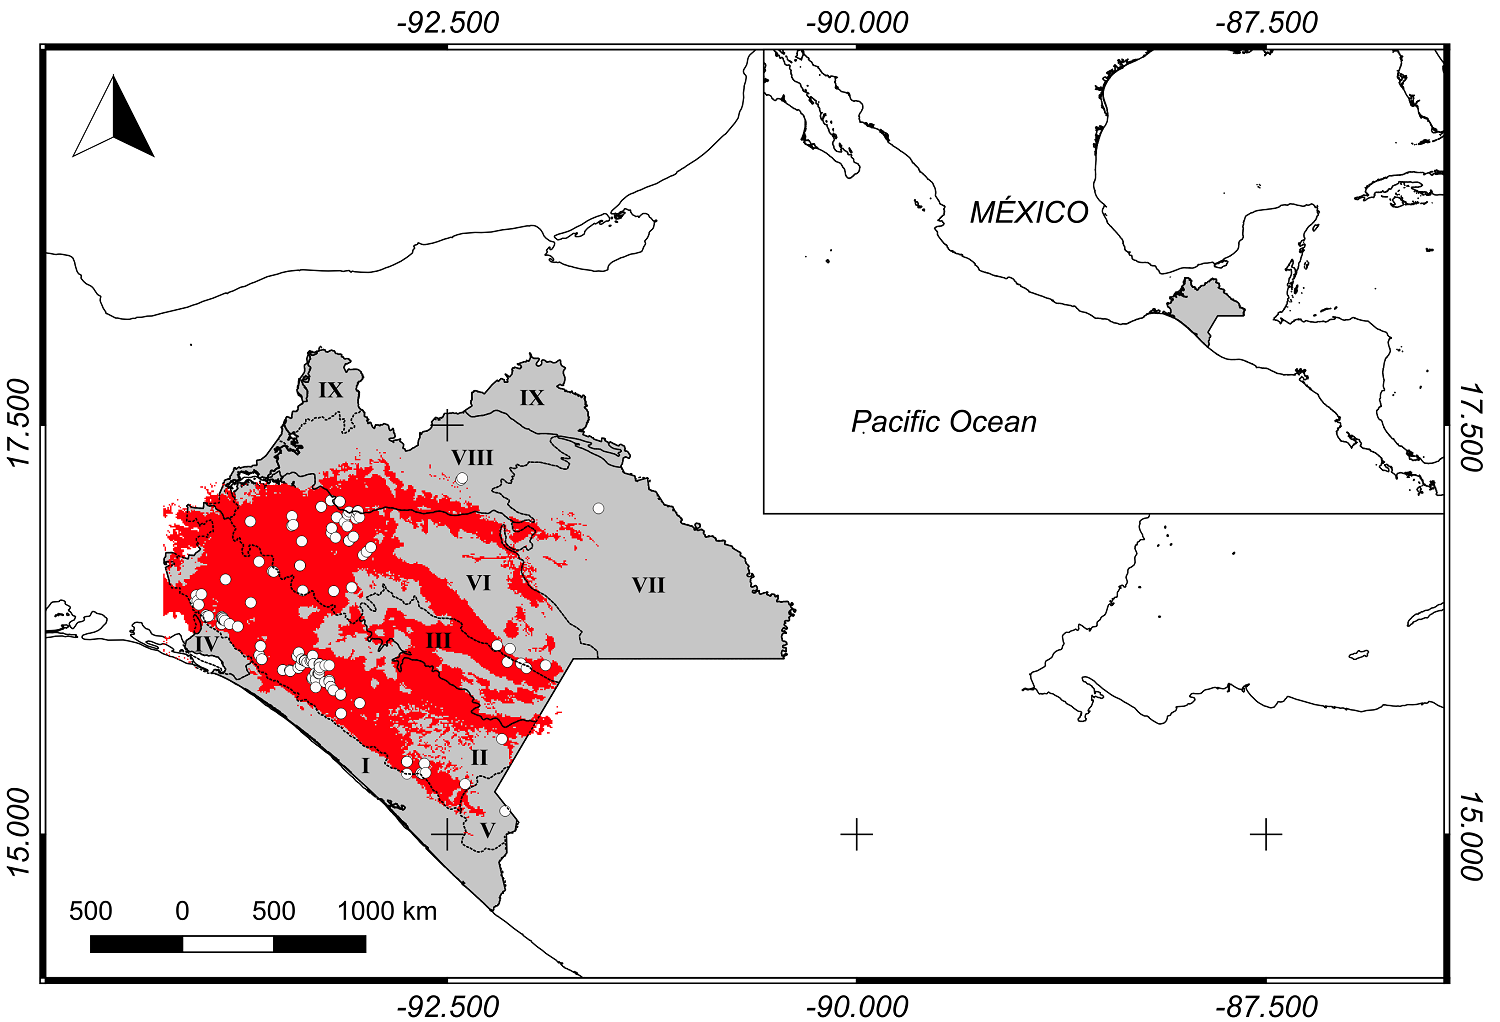
Figure 1 Potential distribution of C. guatemalensis at Chiapas, Mexico (red). The records used for the modeling of the species are showed (white dots). I. Coast Plain of Chiapas and Guatemala Discontinuity, II. South Chiapas Mountains Sub-Province, II. Central Depression of Chiapas Discontinuity, III. Central Depression of Chiapas Discontinuity, IV. Isthmus Plain Discontinuity, V. Central American Volcanoes Sub-Province, VI. Highlands of Chiapas Sub-Province, VII. Lacandon Mountain Range Sub-Province, VIII. Chiapas Northern Mountain Range Sub-Province, IX. Tabasco Plain and Swamp Sub-Province.
Database. A database containing field records of C. guatemalensis in Mexico from 1970 to 2020 was elaborated. The information was obtained from the following scientific databases: The Plant List (www.theplantlist.org/), Sistema Nacional de Información sobre Biodiversidad de México (www.snib.mx/), Comisión Nacional para el Conocimiento de la Biodiversidad (CONABIO 2019), COMPADRE and COMADRE (COMPADRE and COMADRE Matrix Databases 2019), Biodiversity Information Facility (www.gbif.org/es), and Mesoamerican Flora (www.tropicos.org). The scientific collections from the Eizi Matuda, Instituto de Historia Natural y Ecología (CHIP), Herbario Nacional de México (MEXU), Facultad de Ciencias de la Universidad Nacional Autónoma de México (FCME), and El Colegio de la Frontera Sur (ECOSUR) in both its San Cristóbal de Las Casas and Tapachula units. Along with this, floristic listings and specialized journals (Lacandonia, Botanical Sciences, Polibotánica, Revista Mexicana de Biodiversidad, and Acta Botanica Mexicana) were consulted. Finally, a total of 350 records of C. guatemalensis were found for Chiapas.
Environmental Variables. We used 19 bio-climatic variables generated for the project version 1.4 WorldClim, as well as climatic and elevation layers (Hijmans et al. 2005), with a spatial resolution of 30° (~ 1 km2), which result from interpolating the monthly averages of worldwide meteorological stations from 1,950 to 2,000 (Hijmans et al. 2005). All environmental variables were clipped using the limits of the state of Chiapas as a mask. A selection of layers was carried out using a Pearson correlation coefficient test between all bioclimatic and climatic variables, choosing those with correlation values lower than 0.7 (Phillips & Dudík 2008, Gormley et al. 2011). Of the total correlated layers, 16 layers remained for analysis. Correlation analysis were developed using “base” package in R software (R Core Team 2018).
Additionally, a habitat suitability layer was created specifically for C. guatemalensis. To build this layer, information about the reproductive phenology and physiology of the species reported by Pozo-Gómez et al. (2019, 2020) was used. This included ideal conditions for reproductive effort (number and size of fruits), reproductive potential (number and size of seeds per fruit, health and viability of seeds), and reproductive success (germination rate). For the construction of the habitat suitability layer, we compile all the occurrences reported by Pozo-Gómez et al. (2019, 2020, pers. comm.), which were filtered, keeping only those where they reported the maximum values of reproductive effort, reproductive potential, and reproductive success. Only 20 occurrences that included these attributes were used. Later, these localities were projected geographically. Subsequently, for each occurrence the bioclimatic, climatic, and elevation information was obtained according to the layers of Hijmans et al. (2005). It was assumed that localities with the highest reproductive effort, potential and success represent the “ideal” habitat sites (appropriate for the species to establish and reproduce). Afterward, a new raster layer was created with each of the 16 environmental variables. Only the cells that contained the ideal values were kept. All these new raster layers were homogenized to a range of 0.00 to 1.00. Finally, the 16 raster layers were arithmetically added to obtain a single layer that had the combination of ideal conditions for the species. The final raster values were also homogenized to a range of 0.00 to 1.00 (considering the highest value as the maximum habitat suitability given that it meets all the optimal conditions for C. guatemalensis). A total of 17 layers were used for the final model (Table 1).
Table 1 Bioclimatic and climatic variables (from Hijmans et al. 2005), elevation, and habitat suitability variable (constructed from reproductive data of the species) used in the potential distribution model.
| Description | |
|---|---|
| Bio_3 | Isothermality (Bio_2/Bio_7) (×100) |
| Bio_5 | Max Temperature of Warmest Month (°C) |
| Bio_7 | Temperature Annual Range (Bio_5 - Bio_6) (°C) |
| Bio_14 | Precipitation of Driest Month (mm) |
| Bio_15 | Precipitation Seasonality (Coefficient of Variation) |
| December Maximum Temperature | |
| April Solar Radiation | |
| May Solar Radiation | |
| September Solar Radiation | |
| September Precipitation | |
| October Precipitation | |
| November Precipitation | |
| June Solar Radiation | |
| October Monthly Minimun Temperature | |
| Elevation (m asl) | |
| Habitat suitability (0.00-1.00) |
Potential Distribution. To create the model, we used the MaxEnt 4.4.4 algorithm (Palma-Ordaz & Delgadillo-Rodríguez 2014), which has been used for multiple purposes in biogeography, conservation biology, and ecology with good results (Phillips & Dudík 2008, Radosavljevic & Anderson 2014). MaxEnt 4.4.4 functions with presence data for a given species to predict its geographic distribution based on maximum entropy (closer to homogeneity), subject to restrictions and depending on both quantitative and qualitative environmental variables (Lira-Noriega et al. 2013), using a transformation of the relative occurrence rate (Phillips & Dudík 2008). As model calibration area, the Chiapas state was used. There are areas of the region in which the species has not been reported, and we wanted to know the probability of this species presence in such areas. Furthermore, the information on the ideal conditions for C. guatemalensis comes from localities within this same region. In order to reduce spatial correlation between species occurrence records a spatial thinning was applied (Aiello-Lammens et al. 2015). Also, Maxent option to remove duplicates was used. After those processes a total of 98 occurrence records remained. We used 75 % of the occurrence data for modeling, while the remaining 25 % were employed to evaluate errors of omission and commission. The configuration of the model was set to logistic function as the output format, creating response curves. A total of 10 replicates were developed using a crossed validation, consisting of re-sorting the data for modelling and for the evaluation of the obtained model under the new parameters, were used (Phillips et al. 2006). Random seed was selected, which prevents MaxEnt 4.4.4 from repeating the same sampling in every instance. Also, don’t clamp, and no extrapolation were selected, which prevents MaxEnt 4.4.4 from taking a limit value from the calibration region and extending it, thus avoiding undesirable extrapolations of the model. Regularization multiplier the default value of 1 was left. A maximum of 10,000 background points was selected. Through a Jackknife test, the variables used in the model were evaluated and the information they provide and percentage of the model they explain were obtained. Using the Area Under the Curve (AUC), we evaluated the predictive ability of the generated distribution models through a graph (Palma-Ordaz & Delgadillo-Rodríguez 2014). The AUC values can be interpreted as the probability that, when randomly choosing a presence and an absence spot, the presence spot will have a higher value of suitability or probability of presence on the model. According to graph (Palma-Ordaz & Delgadillo-Rodríguez 2014), a general classification guide for the precision of the model, considering the AUC, is: 0.50-0.60 = insufficient; 0.60-0.70 = poor; 0.70-0.80 = average; 0.80-0.90 = good; 0.90-1 = excellent. According to this criterion, the best model of the replicas was chosen as the final model (AUC = 0.964 ± 0.004). The distribution probability map was re-categorized into a binary map (0 = absence, 1 = presence), using the 10 percentile training presence value as a cut-off line (Liu et al. 2005).
The final potential distribution map was generated using QGIS 3.2. (https://qgis.org).
Results
The efficiency of prediction of our model showed that C. guatemalensis is at an interval of 0.964 ± 0.005 in its AUC value, that is, the precision of the model is excellent. The variables “seasonality of precipitation” (Bio 15), “habitat suitability”, “elevation”, “April sun radiation”, “June Solar Radiation”, “October Precipitation”, “November Precipitation” and “Temperature Annual Range” contribute 86.5 % to explain the potential distribution model (Table 2).
Table 2 Contribution percentage from the most important variables according to the potential distribution model of C. guatemalensis in Chiapas, Mexico.
| Variables | Contribution (%) |
|---|---|
| Precipitation Seasonality (Coefficient of Variation) | 26.5 |
| Habitat Suitability | 17.8 |
| Elevation | 15.8 |
| April Solar Radiation | 7.7 |
| June Solar Radiation | 5.7 |
| October Precipitation | 4.4 |
| November Precipitation | 4.3 |
| Temperature Annual Range | 4.3 |
According to the potential distribution model, the presence of the species is continuous in the physiographic regions: Subprovince Central America South Mountain Range, Discontinuity Central Depression of Chiapas, and Subprovince Highlands of Chiapas (Figure 1).
Discussion
The resulting model, with a prediction efficiency of 0.964 ± 0.005, shows that the species is continuously distributed along three different regions: Subprovince Central America South Mountain Range, Discontinuity Central Depression of Chiapas, and Subprovince Highlands of Chiapas. These regions contain extensive areas with tropical dry rainforests, medium strata tropical rainforest, and tropical rain forests, with an average environmental temperature of 22 °C and an average annual rainfall of 1,000 mm, environmentally ideal conditions for the establishment and reproduction of C. guatemalensis (Pozo-Gómez et al. 2020). Regions with such environmental features allow an optimal development of trees year-round; the climate prevents hydric and thermal stress and plant communities are complex, providing appropriate microhabitats (Giraldo-Cañas 2000, Moles et al. 2004, Andreu et al. 2006).
Regardless of the results of the model, certain areas within these three regions, such as the Socoltenango and Venustiano Carranza municipalities in the Discontinuity Central Depression of Chiapas region, the Ángel Albino Corzo and Villa Flores localities in the Subprovince Central America South Mountain Range region, and Las Rosas in the Subprovince Highlands of Chiapas region do not have historic records of C. guatemalensis. It is highly likely that this is due to the fact that these areas lack exhaustive floristic studies.
The presence model discards the distribution of C. guatemalensis in all other physiographic regions of Chiapas, such as the Lacandon Mountain Range Subprovince, Northern Mountain Range Subprovince, and Tabasco Plain and Swamps Subprovince. This may be due to climatic factors (25 °C and 5,000 mm rainfall), the mountainous nature of the terrain with thin, rocky, limestone soils, and the presence of vegetable associations of oak-pine forests, which are inadequate for the establishment and reproduction of the species (Pozo-Gómez et al. 2020). The model also discards the presence of C. guatemalensis in the Chiapas and Guatemala Coast Plain Discontinuity, Isthmus Plain Discontinuity, and Central America Volcanoes Discontinuity, which are characterized by an average temperature of 24 °C and a rainfall of 3,000 mm. While these regions contain medium-stratum tropical rainforests, it has been almost completely substituted by livestock grazing fields and extensive crop lands, which, along with the presence of estuaries, mangroves and the aquatic vegetation characteristic of this littoral zone, provides inadequate conditions for C. guatemalensis (www.gob.mx/inafed).
According to our results, two bioclimatic variables (seasonality of precipitation and anual temperature range), five climatic variables (elevation, April solar radiation, June solar radiation, October precipitation and November precipitation), and a habitat suitability variable (habitat adequacy for the establishment and reproduction of the species), explain 86.5 % of the model. Pozo-Gómez et al. (2020) points out that all of these variables play relevant roles for the reproductive physiology of this species, from the production of flowers to seed germination. This species requires moderate rainfall and abundant sun radiation during its fruiting and fruit opening (for seeds success), as is the case for other tropical tree species (Vera 1995, Cortés-Flores et al. 2011). When light is scarce and rainfall abundant, the fruits of C. guatemalensis absorb humidity and tend to rot, causing the seed to become unviable (Pozo-Gómez et al. 2019, 2020). Fischer & Orduz (2012) mention that tree growth and fruit production are closely related to light usage; the reduction of light intensity affects the induction of floral blooms, their differentiation, size, color, and the quality of fruit, more than it does tree growth. The flowering of C. guatemalensis happens from June through January, seasons with a radiation spanning 12 to 13 hours, and a temperature averaging at 22 °C, as well as a rainfall of 50 mm or absent (0 - 10 mm). On the other hand, Wright & Van Schaik (1994) state that certain arboreal species have a much larger flowering period in the driest time of the year, which is also the period with the most sun radiation; while Morellato et al. (2000) point out that the flowering and fruit bearing period in some arboreal species occurs shortly before the humid period, when days are longer and environmental temperature higher, as is the case for C. guatemalensis (Pozo-Gómez et al. 2019, 2020).
Including the variable of habitat suitability, based on previous knowledge of the reproductive phenology and physiology of the species (Pozo-Gómez et al. 2019, 2020) significantly contributed to predict the distribution of C. guatemalensis. Previous knowledge of the biotic and abiotic factors that a species requires for its physiologic and phenological processes in favorable environmental conditions, is essential to know and understand its distribution. Lira-Noriega et al. (2013), who analyzed how climate factors explain the distribution area of a parasite plant (Phoradendron californicum) in the Sonora and Mojave deserts, recommend the integration of different environmental and biological factors in geographic ranges to gain a fuller understanding of the distribution patterns of processes of different species. On the other hand, Bañuelos-Revilla et al. (2019) state that, for Euphorbia antisyphilitica (candelilla), knowing the habitat variables was relevant to obtain information about its potential distribution, abundance, and size, deducting that, naturally, the distribution of species depend on both environmental and anthropic factors.
These results provide updated information about the potential distribution of C. guatemalensis in Chiapas, which is indispensable not only to understand its biology or the reasons behind its presence or absence in a given site, but also to carry out management and preservation plans for this species and the environments where it is found.

