


 nueva página del texto (beta)
 Inglés (pdf)
 Artículo en XML
 Referencias del artículo
 Enviar artículo por email
 Citado por SciELO
  Similares en
SciELO
Similares en
SciELO 
 Permalink
Understanding the processes leading to speciation and biodiversity in plants is one of the main research topics in evolutionary biology. Flowering time has a strong effect on gene flow among populations (Fitter & Fitter 2002). For example, floral synchrony results in the simultaneous and massive flowering of individuals, offering abundant floral resources that can attract numerous pollinators and favoring outcrossing rates (Domínguez & Dirzo 1995, Rodríguez-Pérez & Traveset 2016). In the same way, there is evidence that flowering synchrony increases reproductive success in wind-pollinated species (Bogdziewicz et al. 2020). In contrast, plant asynchrony or sporadic flowering might reduce the availability of mates and thus reproductive success in both insect and wind-pollinated species (Domínguez & Dirzo 1995, Bogdziewicz et al. 2020). Asynchrony in flowering time across populations should result in lower levels of gene flow and greater genetic structure, even for populations that are geographically close together (Kirkpatrick 2000, Reisch & Posclod 2009).
Geographic distance and the environment represent key components influencing species’ genetic structure (Rousset 1997, Wang & Bradburd 2014). Several species exhibit a significant pattern of isolation by distance (IBD), which suggests that genetic differentiation increases with geographic distance. On the other hand, isolation by environment (IBE) has been proposed to describe the relationship between environmental heterogeneity and the spatial distribution of genetic variation (Wang & Bradburd 2014). Thus, genetic differentiation among populations increases with their environmental differentiation (Wang & Bradburd 2014). In contrast, limited dispersal constrains gene flow among populations and reduces the possibility of counteracting genetic drift (Slatkin 1993, Rousset 1997).
Woody bamboos (Poaceae: Bambusoideae: Bambuseae) are a large taxonomic group with notable economic and ecological importance. Flowering in woody bamboos is peculiar because many of them remain in a vegetative phase for a long period of time, as long as decades or a century, followed by mass synchronous flowering and subsequent death (Janzen 1976). Other woody bamboos are characterized by sporadic flowering with only a few individuals reproductively active in their populations. Flower phenology in woody bamboos falls into four spatio-temporal patterns: 1) Flowering distribution, with a small percentage of individuals flowering the first or second year before and after the main flowering; 2) Flowering wave, with gregarious flowering occurring in patches in successive years; 3) Variation in periodicity between populations, leading to diffuse flower temporality within a species; 4) Sporadic flowering, random or other non-gregarious patterns of flowering (Troup 1921, Janzen 1976, Gadgil & Prasad 1984, Banik 1998, Franklin 2004, Bhattacharya et al. 2009, Zheng et al. 2020). Understanding how asynchronous flowering phenology can influence patterns of gene flow in woody bamboos is crucial to elucidating its role in population genetic divergence and speciation.
The genus Guadua Kunth is one of the six genera of the subtribe Guaduinae (Judziewicz et al. 1999, Clark et al. 2015, Tyrrell et al. 2018). It includes 33 species and is one of the most diverse genera in the subtribe (Clark et al. 2015, Ruiz-Sanchez et al. 2021). Species of Guadua are distributed from Mexico to Argentina, most of the species occur in South America, and this region is considered its center of diversification (Medina & Medina 1965, Judziewicz et al. 1999, Londoño 2001, 2011, Clark et al. 2015). Mexico has seven species of Guadua: G. aculeata Rupr. ex Fourn., G. amplexifolia J. Presl., G. longifolia (E. Fourn.) R.W. Pohl, G. paniculata Munro, G. inermis Rupr. ex Fourn, G. velutina Londoño & L.G. Clark, and G. tuxtlensis Londoño & Ruiz-Sanchez. The last three species are endemic to Mexico, and except for G. paniculata, which is distributed along the Pacific coast of Mexico, the other species are distributed along the Gulf of Mexico in the states of Campeche, Chiapas, Hidalgo, Oaxaca, Puebla, San Luis Potosí, Tabasco, Tamaulipas, and Veracruz (Londoño & Ruiz-Sanchez 2014, Ruiz-Sanchez et al. 2020). Most of the species are used to build houses, fences, kiosks, and to make handicrafts (Londoño & Ruiz-Sanchez 2014).
Few studies have reported the flowering cycles of Guadua species. Guerreiro (2014), Guerreiro et al. (2020) and Vega & Hernández (2008) recorded massive flowering events and estimated flowering cycles for three South American Guadua species: Guadua chacoensis (Rojas) Londoño & P. M. Peterson (28-31 years), G. paraguayana Döll (38 years), and G. trinii (Nees) Nees ex Rupr. (30-33 years). Liebsch & Reginato (2009) estimated cycles of 27-28 years between flowering events for G. sarcocarpa Londoño & P. M Peterson and G. weberbaueri Pilg, while sporadic flowering and massive events have been recorded in G. angustifolia Kunth (Londoño 2002) and only sporadic flowering in G. inermis Rupr. ex Fourn (Aguilera López 2020).
Herbarium records and field collections show that G. amplexifolia has massive flowering cycles of unknown periodicity. We collected flowering plants of G. aculeata in 2012, and some from Puebla state that were flowering in 2020 (Morocho pers. comm.). G. inermis with flowers have been collected in different localities of Veracruz in different years (2009, 2012, 2014, and 2015), and from isolated blooming individuals (Ruiz-Sanchez pers. obs.). Finally, flowering has not been recorded in G. tuxtlensis (Londoño & Ruiz-Sanchez 2014).
Even though some bamboo species are of economic and ecological importance, there is little information on their patterns of genetic diversity and structure in Mexico. Knowledge of the genetic diversity resources of woody bamboos would provide valuable information for conservation strategies as the habitat of bamboos is highly vulnerable due to human practices such as livestock farming. In particular, the size of G. inermis’ populations are small in comparison with those of other Guadua species (i.e., G. velutina) and, according to Ruiz-Sanchez et al. (2018), the projected distribution of G. inermis in 2050 could be reduced by as much as 42 % as a consequence of global warming. Increasing habitat fragmentation, habitat vulnerability due to climate change, and the sporadic flowering of G. inermis will threaten the prevalence of this species. Therefore, analyzing its genetic diversity is crucial to develop effective conservation efforts.
In this study, we used nuclear microsatellites for three Guadua species (G. amplexifolia, G. inermis, and G. tuxtlensis) to answer the following questions: (1) Are the three Guadua species genetically differentiated? (2) Does the vulnerable species G. inermis have low levels of genetic diversity? (3) What are the relative contributions of geographic and environmental factors to the genetic structure of G. inermis?
Materials and methods
Study species. Guadua amplexifolia, G. inermis, and G. tuxtlensis are morphologically similar, and some of their populations are sympatric within the state of Veracruz (Londoño & Ruiz-Sanchez 2014, Ruiz-Sanchez et al. 2015, 2020). The first two species are the most morphologically similar and are difficult to distinguish. It has been suggested that G. tuxtlensis is of hybrid origin and one of the potential parent species could be G. inermis (Londoño & Ruiz-Sanchez 2014) (Figure. 1). Guadua inermis is endemic to Mexico, occurring in the states of Campeche, Chiapas, Oaxaca, Tabasco, and Veracruz; in tropical sub-deciduous forests (Cortés-Rodríguez 2000, Londoño & Ruiz-Sanchez 2014). This species has culms 4 to 12 m tall, 3 to 10 cm in diameter, and solid or thick-walled culms. G. amplexifolia occurs from Mexico to Colombia. Culms 10-15 m tall, 6-10 cm in diameter, solid at the base, and hollow in its distal portion. Flowering phenology is massive. The distribution of G. tuxtlensis is restricted to Los Tuxtlas, Veracruz in Mexico. The culms are 10 to 20 m tall and 8 to 14 cm in diameter. This species has hollow culms, walls are thick, thorny branches from the first node, culm leaves are persistent basally (Figure 1). Flowering has not been recorded for this species. According to Guo et al. (2019), Neotropical woody bamboos are tetraploid and wind-pollinated species.
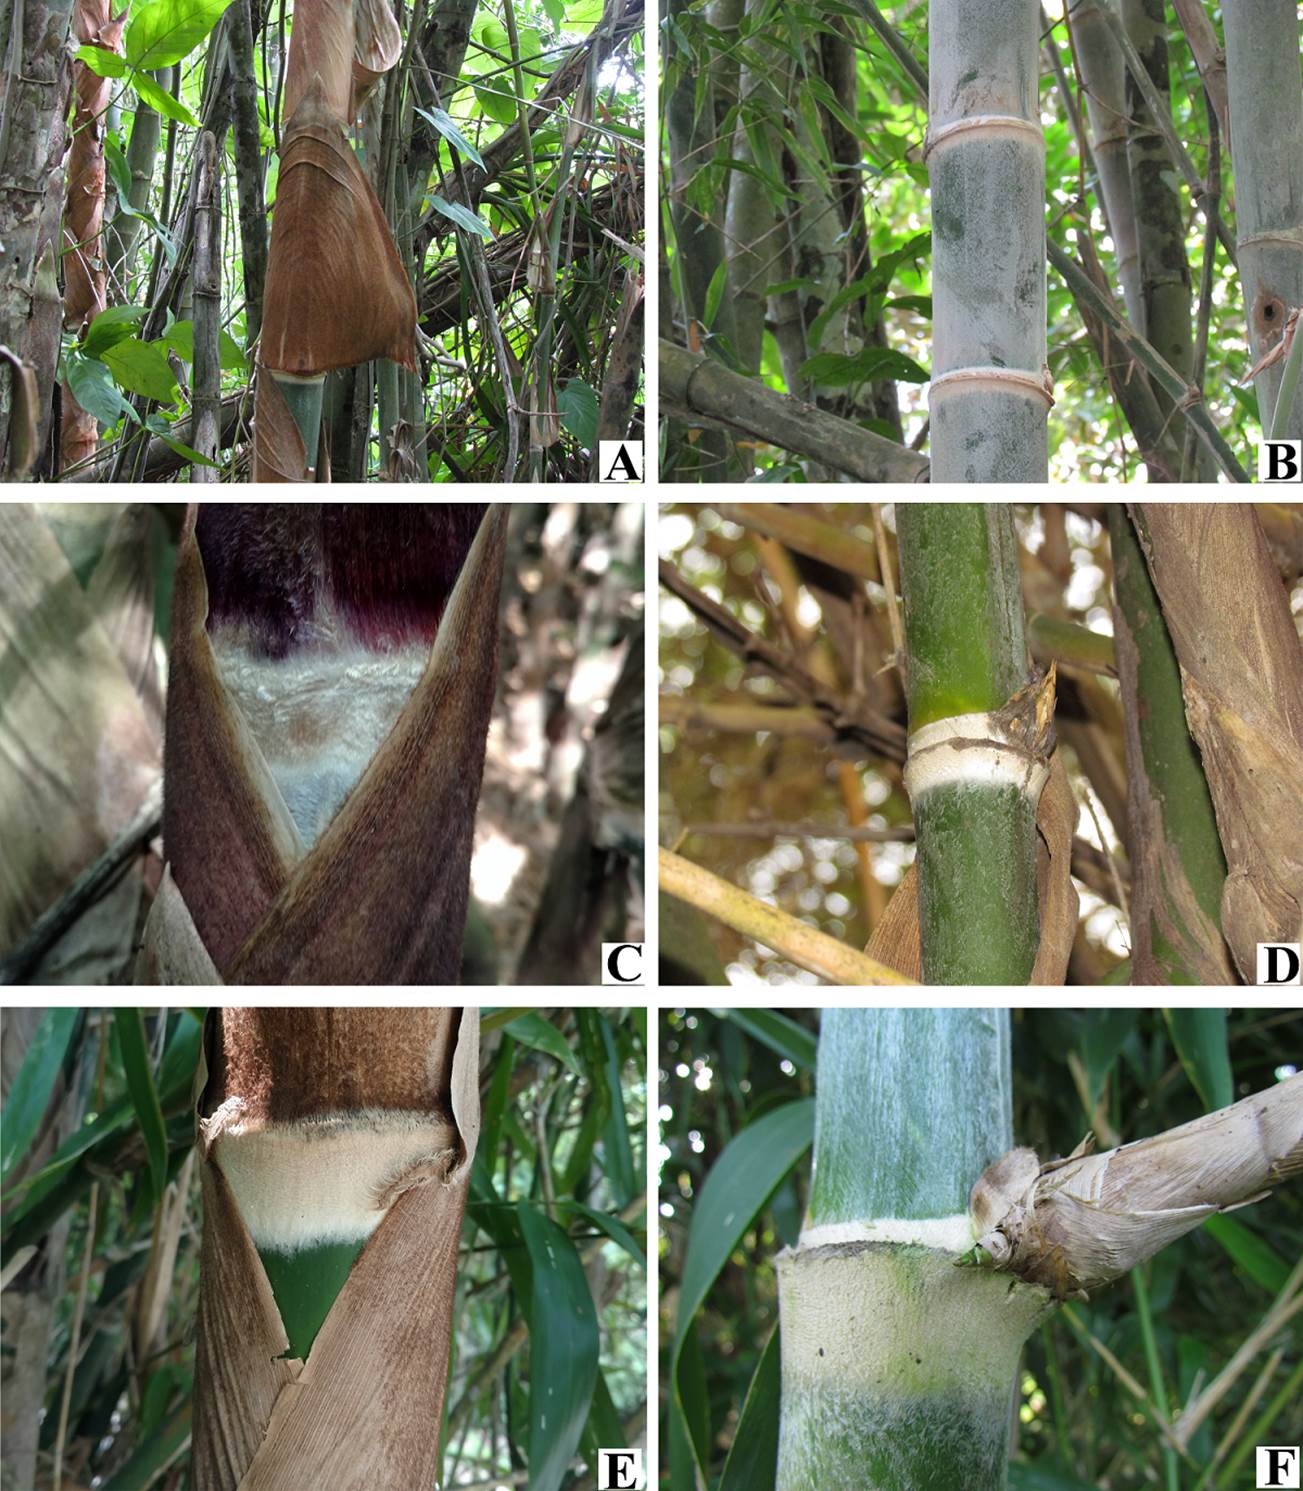
Figure 1 Morphological differentiation in three Guadua species from eastern Mexico. A-B. Guadua tuxtlensis, C-D. G. amplexifolia, and E-F. G. inermis. Photos by Eduardo Ruiz-Sanchez.
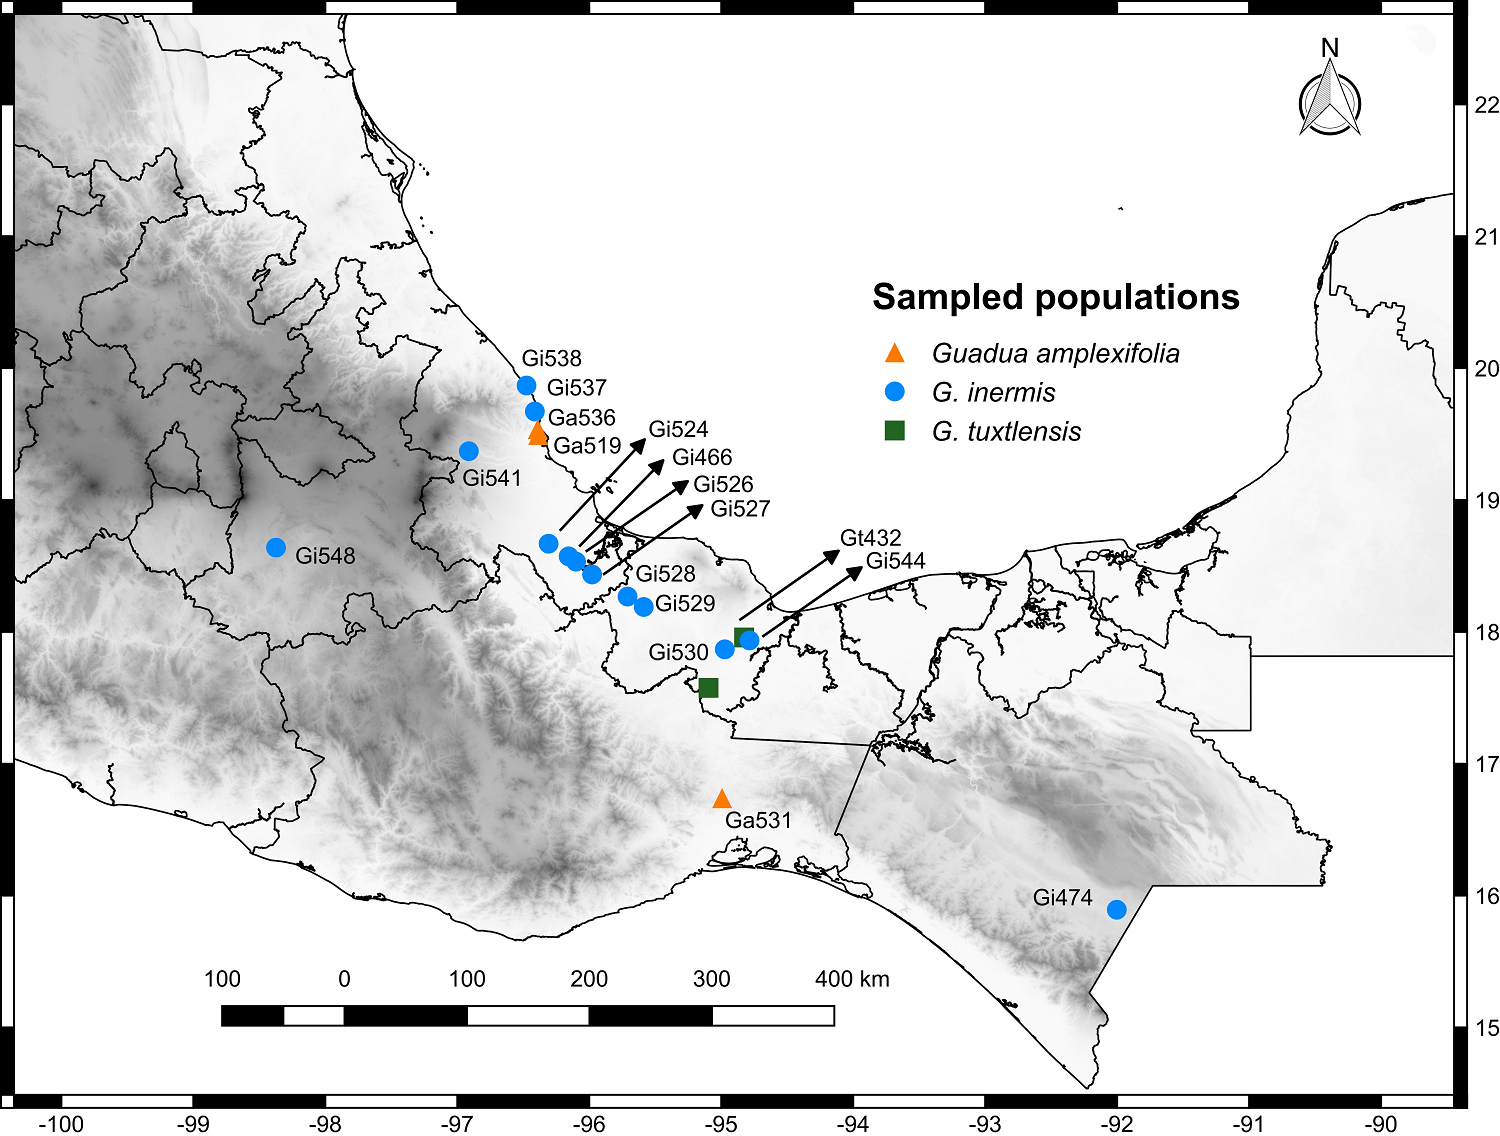
Species sampling. We collected fresh leaves from these three Guadua species during 2014 and 2015. For G. inermis, we collected from thirteen populations in Veracruz, Chiapas, and Puebla. The Puebla population is probably a cultivated population, because the native distribution of G. inermis does not include this state. G. amplexifolia was collected from three populations in Veracruz and Oaxaca, and G. tuxtlensis from two populations in southern Veracruz (Appendix 1, Figure 2). In total 155 individuals were analyzed, and the number of individuals collected per site varied from 2 to 16 (Appendix 2). Foliar tissue of adult and juvenile plants was collected from plants separated by at least 10 m to reduce the possibility of sampling the same genotype. The material was preserved in silica gel prior to DNA extraction. GPS coordinates were recorded for each population.
DNA extraction and microsatellite genotyping. Genomic DNA was isolated from 100 mg of leaf tissue following Doyle & Doyle’s (1987) CTAB procedure. The DNA was dissolved in 100 µL of Milli-Q water. We tested seven microsatellite primers developed for Guadua angustifolia (Pérez-Galindo et al. 2009) and two developed for Aulonemia aristulata (Abreu et al. 2011). PCR reactions contained 2.5 μl of a multiplex solution, 5-100 ng of DNA template, and 0.3 μM of each primer. The final volume was 5.5 μl. PCR reactions were performed using an AERISTM thermal cycler (Esco Healthcare, Singapore) under the following conditions: 96 ºC - 15 min; 35 cycles of 94 ºC - 30s, a gradient of annealing temperature from 50 to 60 ºC - 1:30 min, 72 ºC - 1 min. The final extension lasted 30 min at 60 ºC. We successfully amplified five primers. The forward primers FJ444929 and FJ444936 were labeled with HEXTM, and the forward primers Aar12, FJ476075, and FJ444930 were labeled with 6-FAMTM dyes. The PCR amplification for labeled primers consisted of 2.5 μl of a multiplex solution, 5 - 100 ng of template DNA, and 0.5 μl of the primer mix. The primer mix included 2 μM for each primer and two pairs of primers per reaction were combined except for one of them (FJ444929 + Aar12; FJ444936 + FJ444930; and FJ476075). PCR temperature cycling conditions were as follows: 96 °C for 15 min; 35 cycles of 94 °C - 30 s, 57 °C - 1:30 min, 72 °C - 1 min. The final extension included 60 °C for 30 min. We diluted each PCR reaction (1:30) and sent them to Illinois University, UIUC Core Sequencing Facility to conduct the fragment analysis using GeneScanTM-500 LIZ Size Standard. GeneMapper v4.1 (Applied Biosystems) was used to carry out genotype scoring. Because G. inermis is a tetraploid species, the genotype configuration for each allele was determined using the MAC-PR method, microsatellite DNA allele counting - peak ratios (Esselink et al. 2004). This method infers the number of alleles as a function of the peak area for each individual and each locus.
Genetic diversity analyses. We estimated the average null allele for each locus based on De Silva’s method (De Silva et al. 2005) implemented in Polysat (Clark & Jasieniuk 2011). We calculated genetic diversity statistics, including observed (HO), Nei’s gene diversity corrected for sample size (HE), number of alleles per locus (NA), and effective number of alleles per locus (NAe) using the software Spatial Pattern Analysis of Genetic Diversity (SPAGeDi) v1.3a (Hardy & Vekemans 2002). We also estimated allelic richness using the rarefaction method implemented in the Allelic Diversity Analyzer (ADZE) (Szpiech et al. 2008). This method trims unequal sample sizes to the same standardized sample size (g), taking a value that is less than or equal to the smallest sample size for the whole dataset. We set g = 4 to have a more comparable measurement of genetic diversity among populations.
Genetic structure analyses. Genetic differentiation among the populations of all three species was estimated using the F ST statistic implemented in the software SPAGeDi v1.3a (Hardy & Vekemans 2002). In addition, the G ST statistic was calculated for each species using Genodive v 2.0b27 (Meirmans 2020). We performed assignment genetic analysis using a Bayesian method implemented in the software STRUCTURE v2.3.4 (Pritchard et al. 2000). We included an admixture model and uncorrelated allele frequencies because we analyzed three bamboos species. Additionally, we carried out a second analysis including only the populations of G. inermis using the admixture model and correlated allele frequencies. We ran the analysis with 1 × 10⁶ Markov chain Monte Carlo (MCMC) steps and a burn-in of 1 × 10⁵ steps, with 10 replicates for each K (number of clusters), where K = 1 to 10. To determine the most appropriate value of K, the average and standard deviation (SD) of the likelihood of each model were used to calculated ∆K (Evanno et al. 2005) using Structure Harvester (Earl & vonHoldt 2012). The visual output of the STRUCTURE results was generated using DISTRUCT (Rosenberg 2003) and CLUMPAK (Kopelman et al. 2015).
We also ran a Principal Components Analysis (PCA) in the R package adegenet (Jombart et al. 2010). PCA is a multivariate method free of Hardy-Weinberg and linkage disequilibrium assumptions. We carried out an Analysis of Molecular Variance (AMOVA) by grouping populations by species and only for G. inermis populations without a specific hierarchical structure. These analyses were run in the popr R package with significant values determined after 20,000 replicates (Kamvar et al. 2014).
Isolation by Distance (IBD) and Isolation by Environment (IBE) in G. inermis. We explored the influence of geographic and environmental variables on genetic differentiation to test IBD and IBE in G. inermis. Linearized F ST values (F ST/1 - F ST) were used to obtain the pairwise genetic matrix. The geographic distance matrix was obtained using the great-circle distance in the geosphere R package v1.5.10 (Hijmans 2019). We obtained the 19 environmental variables from WorldClim (www.worldclim.org/) with a resolution of 30 arcsec (1 km2). We performed a PCA on all bioclimate variables. The variables most strongly correlated with the first three PCA axes containing the highest variance were selected. We checked for multicollinearity among the selected variables with the variance inflation factor (VIF) and excluded variables with VIF > 10 using the vifstep function in the usdm R package v1.1.18 (Naimi 2015). The bioclimate variables selected were isothermality (Bio 3), max temperature of warmest month (Bio 5), mean temperature of warmest quarter (Bio 10), precipitation of wettest month (Bio 13), and precipitation of coldest quarter (Bio19). First, we tested for IBD using the Mantel test with 1000 permutations in the vegan package (Oksanen et al. 2013). Then the statistical relationships of IBD and IBE with the genetic distance matrix were evaluated with maximum‐likelihood population effects model (MLPE; github.com/nspope/corMLPE; Clarke et al. 2002). This approach explicitly accounts for the non-independence of values in regressions run on distance matrices (Clarke et al. 2002). Parameter estimation was performed using restricted maximum likelihood (REML). To select among competing univariate models, we utilized information theoretical criteria such as the Akaike information criterion corrected for sample size (AICc) and the Akaike model weights (wi) calculated using the dredge function from the MuMIn v1.4 package (Bartoń 2018).
Results
Diversity and genetic structure of three Guadua species. The average frequency of null alleles for each locus analyzed was 0.26 for FJ444929, 0.08 for Aar12, 0.26 for FJ476075, 0.30 for FJ444936, and 0.22 for FJ444930. The number of alleles for Guadua inermis, G. amplexifolia and G. tuxtlensis was 28, 25, and 13 alleles, respectively. The multilocus statistic of genetic diversity based on HO was 0.20 for G. inermis, 0.21 for G. amplexifolia and 0.33 for G. tuxtlensis (Table 1). Average levels of genetic diversity were lower for G. inermis, and most of the estimated statistics were higher for G. tuxtlensis (Appendix 2). The rarefaction statistic for AR was 1.45 for G. inermis, 1.71 for G. amplexifolia, and 1.71 for G. tuxtlensis. All populations of G. amplexifolia (Ga519, Ga531, and Ga536) exhibited significant values of inbreeding, but this only occurred in three populations of G. inermis (Gi524, Gi528, and Gi529) and in one G. tuxtlensis population (Gt532) (Appendix 2).
Table 1 Genetic diversity statistics, genetic differentiation and inbreeding coefficient for three Guadua species for specimens from the states of Chiapas, Oaxaca, Puebla, and Veracruz, Mexico.
| Species | Code | N | N pop | Ho | HE | GST | GIS | P |
|---|---|---|---|---|---|---|---|---|
| G. amplexifolia | Ga | 41 | 3 | 0.21 | 0.38 | 0.10 | 0.39 | 0.001 |
| G. tuxtlensis | Gt | 16 | 2 | 0.33 | 0.38 | 0.04 | 0.06 | 0.09 |
| G. inermis | Gi | 98 | 13 | 0.20 | 0.30 | 0.29 | 0.12 | 0.001 |
N sample size; N pop number of populations, Ho observed heterozygosity; HE expected heterozygosity; GST genetic differentiation; GIS inbreeding; P probability of GIS and Hardy-Weinberg equilibrium test.
According to Delta K, the STRUCTURE analysis showed that the most likely number of clusters was K = 4 (Figure 3). Group 1 (color: green) corresponded to individuals of Guadua tuxtlensis; the second group (color: orange) included individuals of G. amplexifolia, while the third and fourth groups (color: blue and purple respectively) were composed of G. inermis plants. For these last two groups, group 3 included mainly individuals from populations Gi524, Gi537, Gi538, and Gi541, which are located in the northern part of the sampling region and Gi548 located in the state of Puebla. Group 4 was composed of plants from populations Gi466, Gi526, and Gi527, which are in the central part of the study region. The southern populations Gi544, Gi528, Gi529, Gi530 had plants assigned to groups 3 or 4 and some individuals had a mixed ancestry. Population Gi474, located in Chiapas, had a mixed ancestry from groups 2, 3, and 4; population Gi524 also had mixed ancestry with group 2 that corresponds to the G. amplexifolia cluster. The PCA for the three species had a pattern similar to that observed in STRUCTURE, where there is a distinction among the populations of the three species (Figure 3).
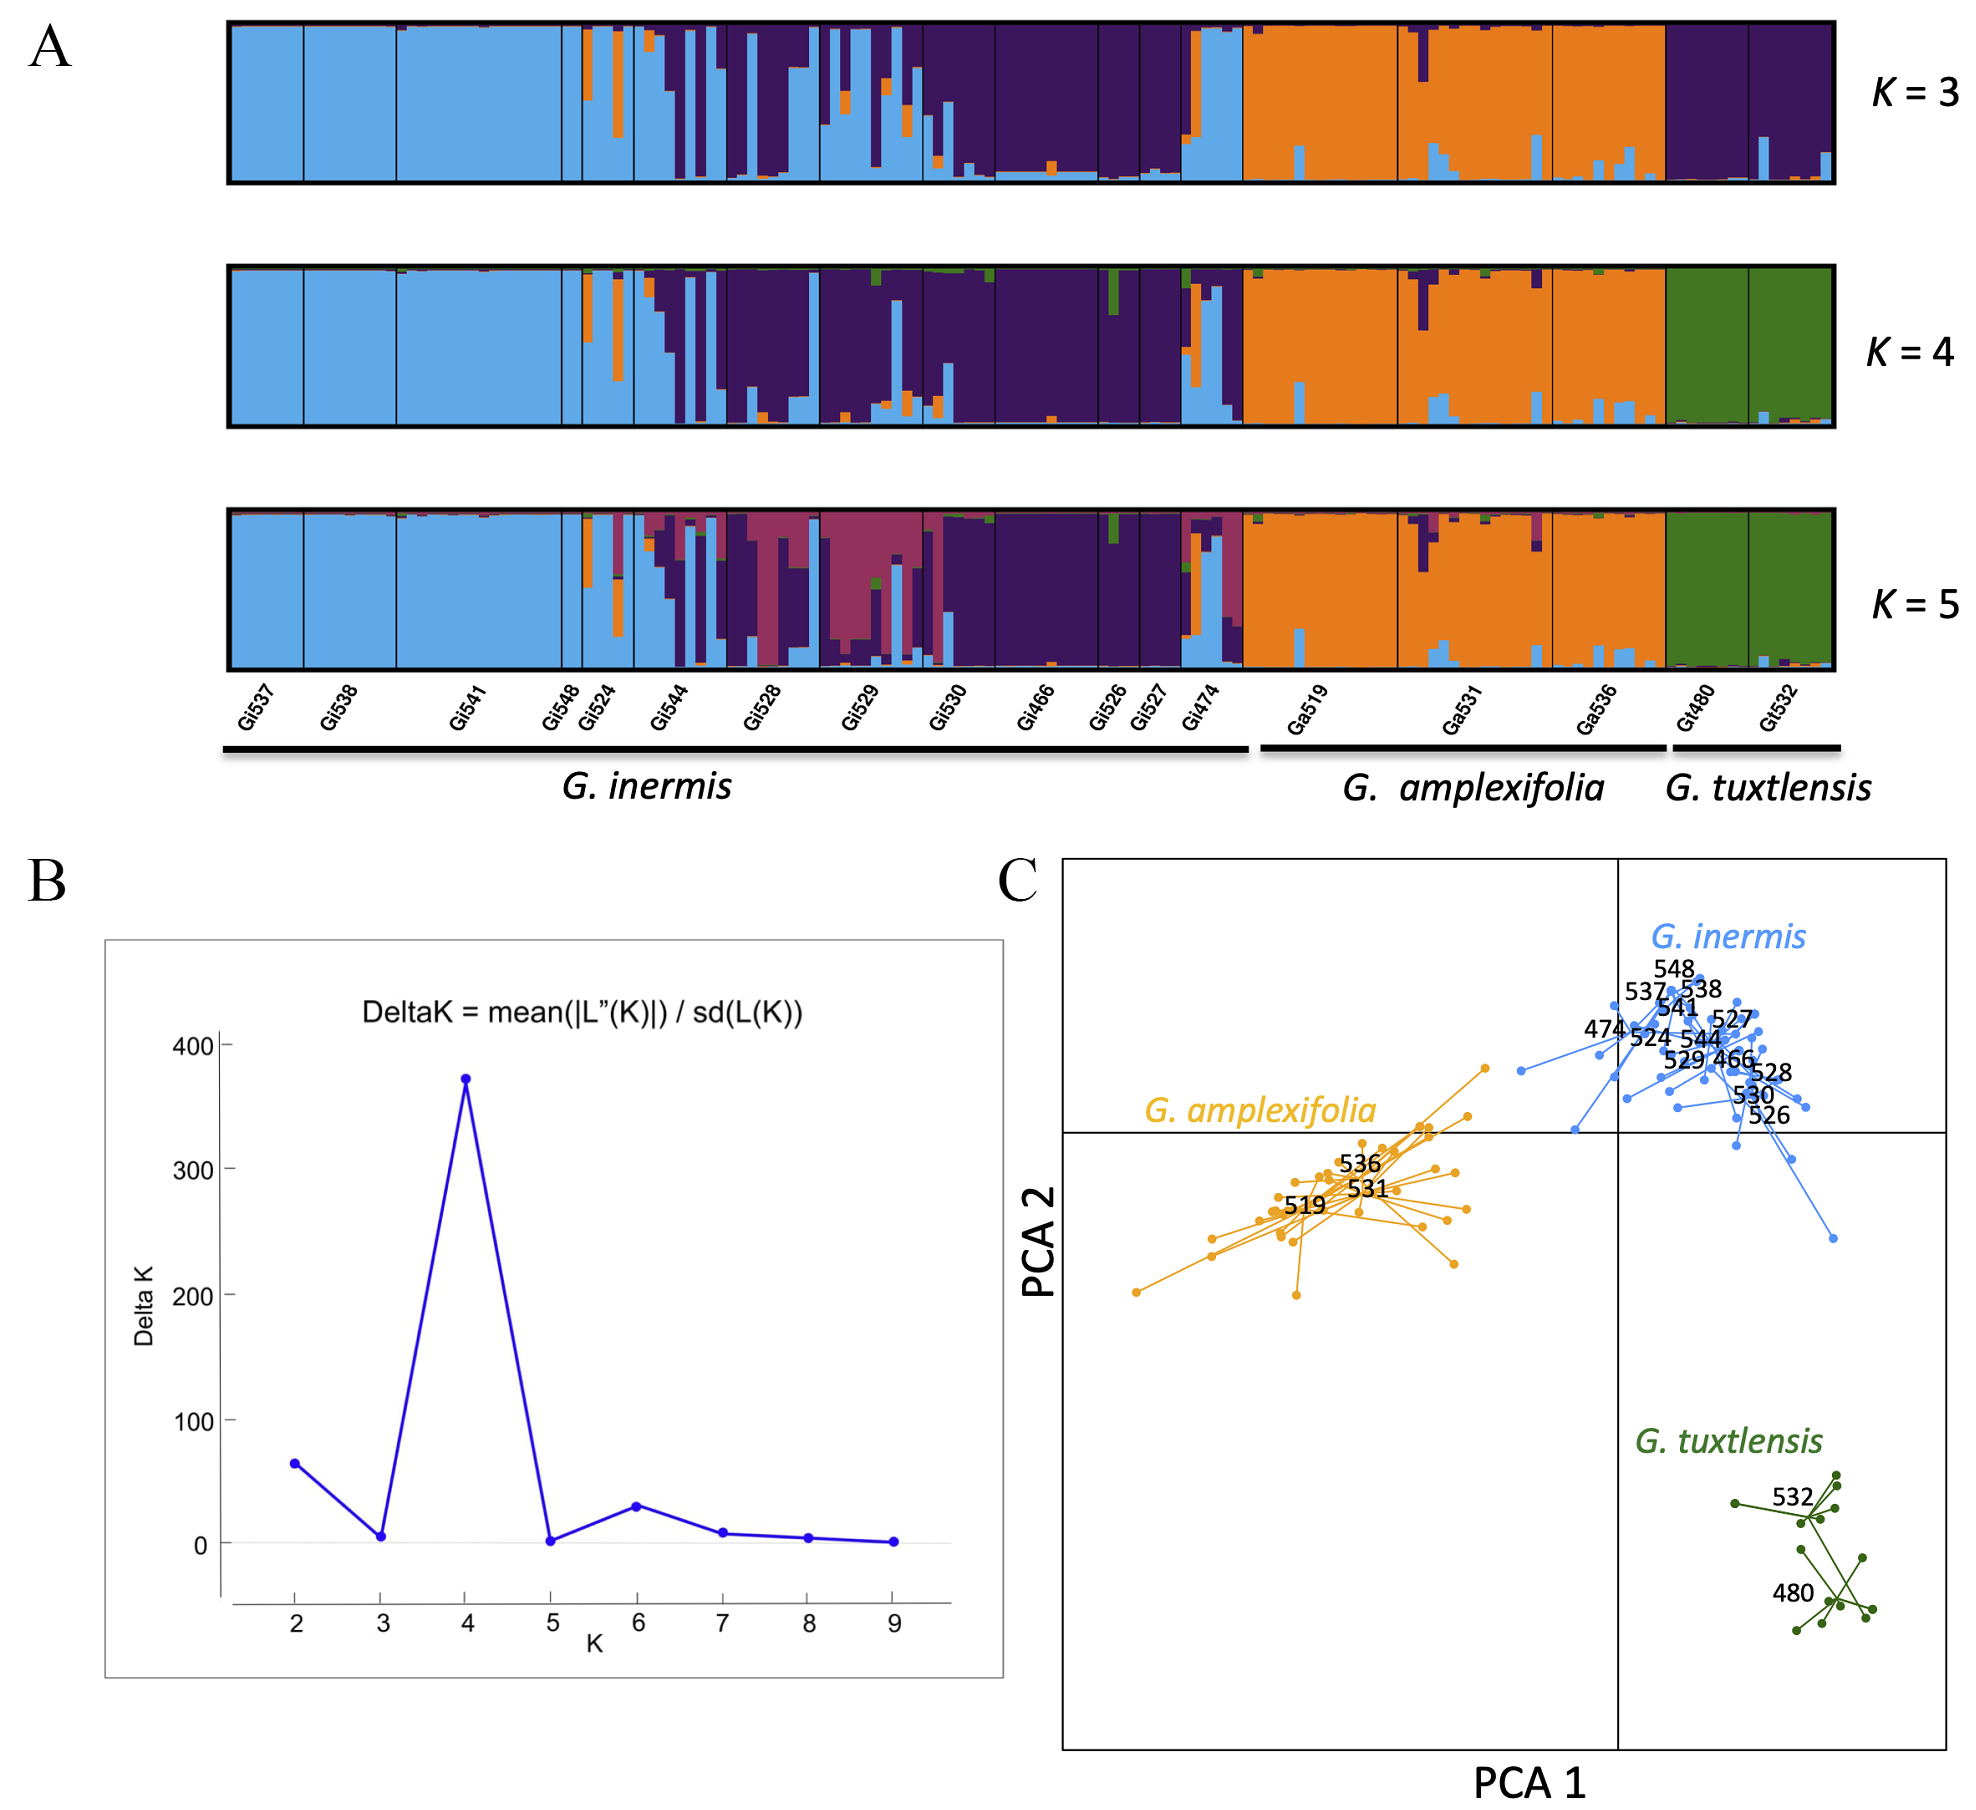
Figure 3 A. STRUCTURE plot (K = 3 to 5) for the assignment of individuals. B. K groups identified by Evanno’s method. C. PCA for three species of Guadua based on five nuclear microsatellites.
The AMOVA indicated that 59.89 % of the genetic variance was explained among the three species, in contrast to 19.39 % of the genetic variance among populations within species and 20.71 % of the variance within populations (Table 2). The G ST for G. amplexifolia, G. tuxtlensis and G. inermis was 0.10, 0.04 and 0.29 respectively (Table 1). The highest levels of genetic differentiation were detected between one population of Guadua tuxtlensis (Gt480) and the populations of G. inermis located in the northern region of the sampling area in Veracruz (Gi537, Gi538, and Gi541; Appendix 3). The lowest levels of genetic differentiation were detected between Ga531 located in Oaxaca and Gi474 located in Chiapas; also Ga531 exhibited low levels of genetic differentiation with populations of G. inermis located mainly in the southern part of the sampling region in Veracruz (Appendix 3). These results agree with the PCA and STRUCTURE analyses, where G. amplexifolia and G. inermis had lower levels of genetic differentiation than G. tuxtlensis did.
Table 2 Analysis of molecular variance for a) three species of Guadua and b) G. inermis.
| Source of variation | df | SS | MS | % CV |
|---|---|---|---|---|
| a) Among groups | 2 | 107.24 | 53.62 | 59.89 |
| Among populations within species | 15 | 51.36 | 3.42 | 19.38 |
| Within populations | 104 | 51.72 | 0.49 | 20.71 |
| Total | 121 | 210.33 | 1.73 | 100 |
| b) Among populations | 12 | 111.93 | 9.32 | 71.74 |
| Within populations | 57 | 37.63 | 0.66 | 28.25 |
| Total variation | 69 | 149.57 | 2.16 | 100 |
Diversity, genetic structure, and connectivity of Guadua inermis. Average levels of genetic diversity of G. inermis were HE = 0.23 and Ho = 0.20 (Appendix 2). The lowest levels of genetic diversity based on HO, HE, and NAE were found in population Gi537 located in the northern part of the sampling region, and population Gi548 in Puebla, while the highest values of HO, HE, and NAE were detected for Gi528 and Gi530 located in the central and southern part of the sampling region (Appendix 2).
According to Delta K for STRUCTURE, the most likely number of clusters was K = 2. The first group (orange, Figure 4) was composed of five populations (Gi537, Gi538, Gi541, Gi548) from the northern part of Veracruz and one population (Gi474) from Chiapas. The second group included three populations (Gi466, Gi526, and Gi527) from the central part of the sampling region in Veracruz, while five populations (Gi524, Gi544, Gi528, Gi529, and Gi530) included individuals with mixed ancestry from the two groups, located mainly in southern ranges (Figure 4). The PCA exhibited a pattern similar to the result of K = 3 from STRUCTURE, where some individuals are intermixed among populations. Specifically, one group included the most northern populations Gi541, Gi474, Gi524, Gi548, Gi544, Gi537, and Gi538. The second group included populations located mainly in southern ranges, Gi528, Gi528, Gi530 (purple group of K = 3) and the third group, those located in the central part of the sampling area, Gi527, and Gi526 (the same as the pure blue group in K = 2 and 3) (Figure 4). The Gi474 population (located in Oaxaca) included wide variation, with some individuals similar to other populations while others are divergent. The AMOVA results showed that 71.74 % of the genetic variance was explained by differences among populations, while 28.25 % could be attributed to the genetic variance within populations (Table 2).
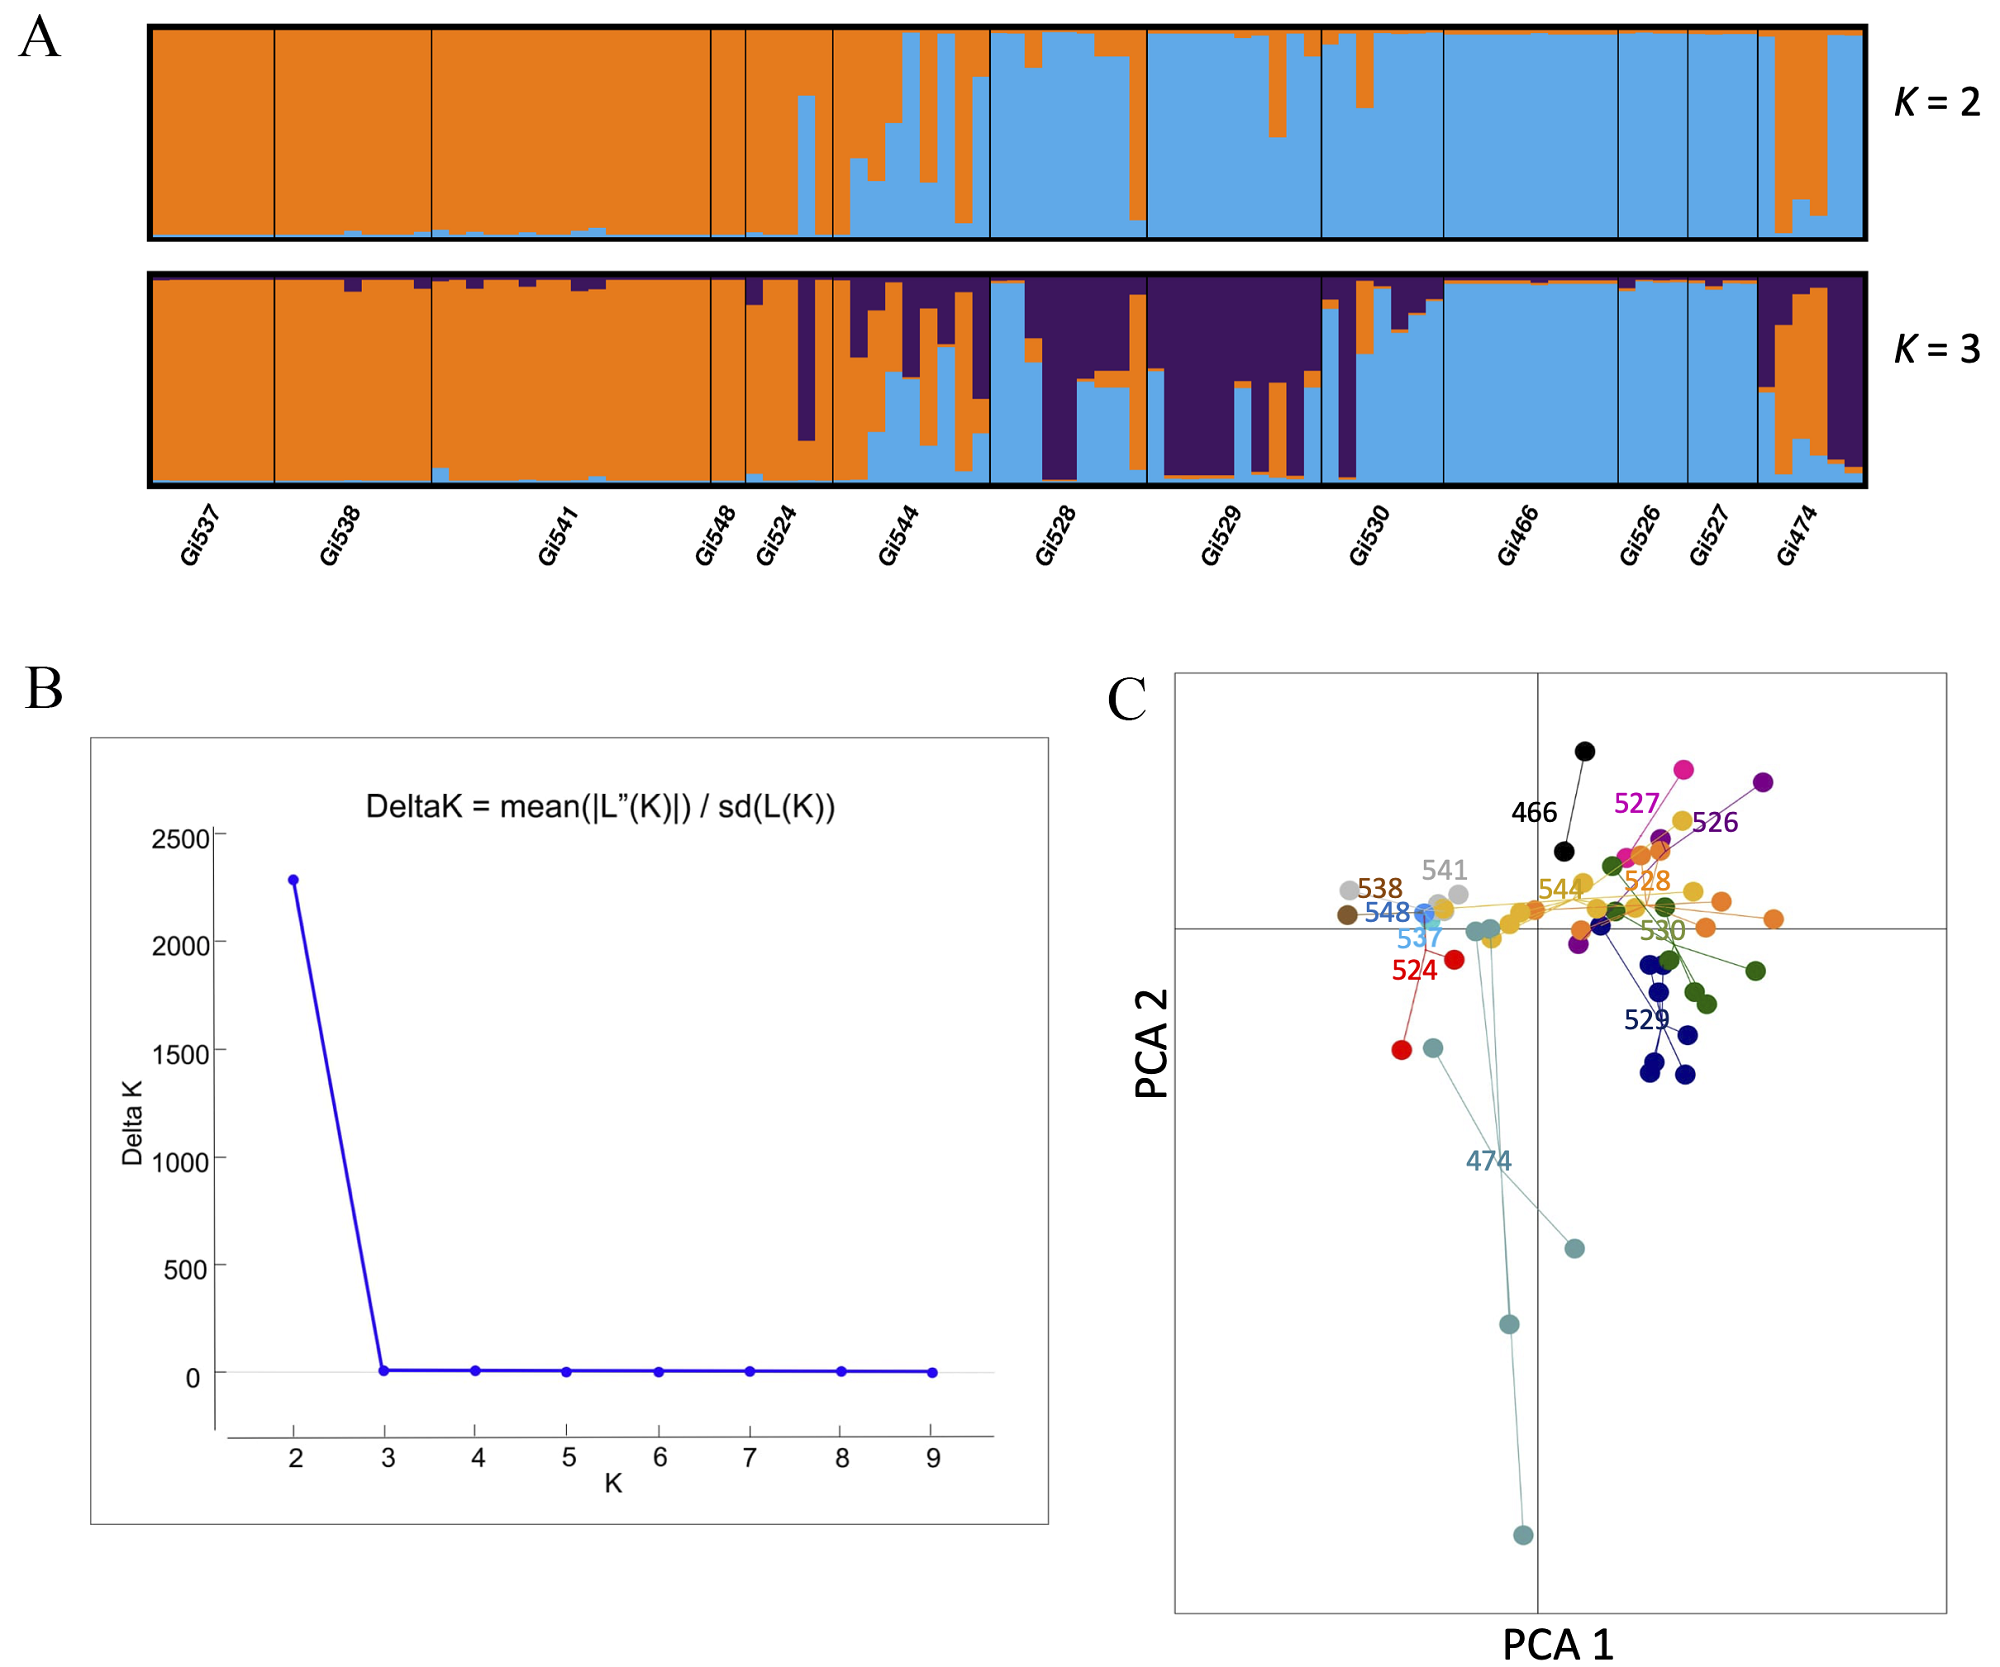
Figure 4 A. STRUCTURE bar plots (K = 2 and 3) for the assignment of individuals. B. K groups identified by Evanno’s method. C. PCA for 13 populations of Guadua inermis based on five microsatellites.
G. inermis populations exhibited wide variation for F ST pairwise comparisons, ranging from 0 to 0.67. Genetic differentiation at the species level was F ST = 0.47 and G ST = 0.44. The highest levels of genetic differentiation were detected between populations located in Chiapas, those in the center of the sampling area in Veracruz (Gi466, Gi526, and Gi527), and the northernmost populations of Veracruz (Gi537, Gi538, and Gi541). Overall, the lowest levels of genetic variation (F ST = 0) were found in geographically close populations (Appendix 3).
We did not find a significant IBD pattern (r = 0.13, P = 0.2). Multimodal inference showed that the best performing MPLE model included the maximum temperature of the warmest month (Bio 5) as this variable had the maximum model probability (wi = 1) and the lowest AICc score (-51.3) relative to the other models. This environmental variable explained 33 % of the genetic variation in population genetic distances (Table 3). None of the other bioclimate variables explained gene flow in G. inermis.
Table 3 Results from a multimodel inference on MLPE regression models in G. inermis. Log likelihood (LogLik), Akaike’s information criterion corrected for sample size (AICc), relative difference between the best model and each of the other models in the set (ΔAIC), model weight representing the probability that a model is the best in the set (wi), and the correlation coefficient rho ( ρ).
| Predictor | logLik | AICc | ΔAIC | wi | Ρ |
|---|---|---|---|---|---|
| Bio 5 | 29.90 | -51.3 | 0 | 1 | 0.333* |
| IBD | 18.62 | -28.7 | 22.57 | 0 | 0.109 |
| Bio19 | 18.03 | -27.5 | 23.73 | 0 | 0.096 |
| Bio10 | 16.33 | -25.1 | 26.12 | 0 | 0.041 |
| Bio 3 | 16.28 | -24.0 | 27.25 | 0 | 0.054 |
| Bio 13 | 16.14 | -23.7 | 27.54 | 0 | 0.050 |
*P = 0.0001.
Discussion
Our main results confirm the taxonomic designation of the three Guadua species as they exhibited evident genetic differentiation (Londoño & Ruiz-Sanchez 2014). This was clear from the results of STRUCTURE and PCA that coherently separated the three species. Pairwise genetic differentiation among species was also high. The average levels of genetic diversity were lower for G. inermis, and the values for most of the statistics were larger for G. tuxtlensis. We found a strong genetic structure in G. inermis. We found a significant association of genetic distances with the maximum temperature of the warmest month, but not with geographic distance. Moreover, we did not find any evidence supporting the hybrid origin of G. tuxtlensis (which was thought to have G. inermis as one of its parental species), as suggested by Londoño & Ruiz-Sánchez (2014).
Genetic diversity and structure among Guadua species. Higher levels of genetic diversity were detected in Guadua tuxtlensis than in G. inermis or G. amplexifolia for most of the statistics, while the lowest levels of genetic diversity were detected in G. inermis. However, it was a population of G. inermis that exhibited the highest levels of genetic diversity, according to the Ho and HE statistics for the Gi530 population, which is in the southern region of Veracruz. The PCA, STRUCTURE, and AMOVA indicated that each species is genetically different, supporting their taxonomic designation. The PCA, however, did reveal that G. amplexifolia and G. inermis are genetically closer to each other than to G. tuxtlensis. This result was supported by slightly lower FST pairwise comparisons between both species. According to Londoño (pers. comm.), G. inermis and G. amplexifolia would be grouped in the same genetic complex, while G. tuxtlensis would be grouped with other Guadua species. The inbreeding coefficient for most of the G. inermis populations we studied indicated an excess of heterozygotes, and the three populations of G. amplexifolia exhibited inbreeding. This result is partial, because G. amplexifolia has a wide distribution (Mexico to Colombia) and we only analyzed three populations of this species in Mexico.
Genetic diversity and connectivity in G. inermis. Multiple factors determine the genetic diversity of species, including flowering synchrony, geographic range, and mating system (Hamrick & Godt 1996, Nybom 2004). Genetic diversity in bamboos exhibits a wide range of variation. Guadua inermis harbors, on average, lower levels of genetic diversity (Ho = 0.20 and He = 0.23) compared to six other species of bamboos using SSR (Ho = 0.55 and HE = 0.46) (Posso 2011, Attigala et al. 2017, Jiang et al. 2017, Yang et al. 2018, Meena et al. 2019, Huang et al. 2020). Among the highest levels of genetic diversity detected were those of G. angustifolia (HE = 0.56 including 30 locations and 9 SSR markers in the Colombian Eje Cafetalero; Muñoz et al. 2010, Posso 2011).
G. angustifolia has a wide distribution range with massive and sporadic flowering; factors that could explain the high levels of genetic diversity in this species. In contrast, even though the bamboo Dendrocalamus sinicus Chia & J.L. Sun, flowers sporadically and has a narrow distribution, it has higher levels of genetic diversity than G. inermis does (HE = 0.54, HO = 0.48, including 8 SSR markers and 18 populations; Yang et al. 2018). Chen et al. (2017) found high levels of outcrossing rates in this species and another study estimated low levels of biparental inbreeding in D. sinicus (Xie et al. 2019). This explains the high values of diversity detected in this species. Other bamboos also exhibit high levels of genetic diversity and excess heterozygosity even when flowering is sporadic (Phyllostachys edulis - Jiang et al. 2017, Fargesia spathacea complex - Huang et al. 2020). The authors suggested that even the sporadic flowering events can potentially contribute to the population diversity of these species.
Moreover, the flowering time interval within the sporadic phenology should vary among species, which potentially contributes to the variation in genetic diversity among bamboo species. In the case of G. inermis, during sample collection, we detected only six individuals flowering in six different populations. This highlights just how rare flowering is. However, it is necessary to further analyze flowering phenology to understand its role in the structure of population genetics.
G. inermis has lower levels of genetic diversity than other bamboo species. When it is compared to 79 other monocot outcrossing species, their levels of genetic diversity are higher (HE = 0.15; Hamrick & Godt 1996). Polyploidy has been one of the factors that contribute to maintaining high levels of genetic diversity in bamboos. Theoretical and experimental data have shown a reduction of inbreeding in polyploid species as a consequence of a higher number of alleles per locus (Moody et al. 1993, Soltis & Soltis 2000, Baduel et al. 2018).
The higher genetic diversity and mixed ancestry of southern populations of Guadua inermis suggest that this region is the ancestral distribution. This result agrees with the southern origin of tropical bamboos (Clark 1997, Ruiz-Sanchez 2011). Northern range expansion could occur as a consequence of warming weather in the Late Pleistocene and Holocene. Other species inhabiting this region also migrated toward northern ranges (Ruiz-Sanchez & Ornelas 2014, Ornelas et al. 2016, 2019).
The AMOVA indicated high levels of genetic differentiation among populations. Further, we detected large genetic differences between northern and central populations, even when they are in proximity. Further research, including the use of more genetic markers, is needed to test this result. High genetic structure has been also detected in the tallest bamboo Dendrocalamus giganteus using ISSR (7 primers, 7 populations, G ST = 0.84; Tian et al. 2012). The authors indicated that intensive selection of genotypes and their introduction into natural populations is one of the reasons for the high levels of genetic differentiation. Moreover, the long vegetative period and sporadic flowering are also important factors that influence the high degree of genetic structure and low levels of genetic diversity (HE = 0.04 and HO = 0.06; Tian et al. 2012).
Guadua inermis had higher levels of genetic differentiation than G. angustifolia (F ST = 0.098; Posso 2011), D. sinicus (G ST = 0.23; Yang et al. 2018), or D. membranaceus did (21.05 % of the variation was among populations; Yang et al. 2012). Even though D. sinicus has sporadic flowering, its genetic structure was not greater than that of G. inermis. It would be important to increase the number of genetic markers in future studies to increase accuracy when quantifying the levels of genetic diversity and structure of these species.
Anthropogenic habitat loss and fragmentation contribute to the reduction in population size and isolation of populations (Reed & Frankham 2003, Lowe et al. 2005, Chávez-Pesqueira et al. 2014, Schlaepfer et al. 2018), to which endemic species are more susceptible. Additionally, the loss of genetic diversity could have a negative impact on fitness, viability of individuals, and their ability to respond to environmental challenges (Reed & Frankham 2003). Habitat fragmentation, the sporadic flowering and the projected future reduction in the distribution of G. inermis (Ruiz-Sanchez et al. 2018) all threaten the prevalence of this species. Genetic diversity is an important aspect in the conservation and utilization of resources. Our study contributes to this knowledge and can be helpful when drawing up conservation management plans.
Precipitation and temperature are important factors influencing plant growth, development, survival, reproduction, and other ecological aspects (Manel et al. 2012). Our results show that the environment influenced the genetic structure of G. inermis. Specifically, the maximum temperature of the warmest month was significantly correlated with genetic distances, while geographic distance had no effect. This result was partially expected since geographically close populations are genetically differentiated, particularly in the center and northern ranges.
Our study is the first to evaluate levels of genetic diversity in Mexican endemic woody bamboos. We detected that the genetic diversity of G. inermis is on average lower than that reported in six other bamboo studies using SSR, and higher than that of other outcrossing monocots. Even with its small population size, patchy distribution and its sporadic flowering, G. inermis maintains its genetic diversity. Its sporadic flowering and habitat fragmentation could reduce genetic connectivity for this species. We detected a strong genetic structure between northern and central populations. Even when populations are geographically close, their genetic differences are as high as those in the comparisons of populations among species. Our study also confirms the taxonomic identity of three endemic bamboo species.

