nueva página del texto (beta)
 Inglés (pdf)
 Artículo en XML
 Referencias del artículo
 Enviar artículo por email
 Citado por SciELO
  Similares en
SciELO
Similares en
SciELO 
 Permalink
Maize (Zea mays L.) is the second most cultivated crop in the world, after wheat (Triticum spp), with a planted surface area of 140 million hectares around the world (Paliwal et al. 2001); it is estimated that by 2024 global production will increase by 9 % compared to 2019, due to a possible increase in demand of 1.3 % per year in the same period (International Grains Council 2019). The crop is cultivated under a diversity of management practices that vary widely from one agricultural or cultural environment to another (Aguilar et al. 2003, Das et al. 2014, Ren et al. 2016). Crop areas can be thought of as food production ecosystems that undergo continuous biotic and abiotic changes; these changes depend on the type of crop and, above all, on the way it is managed. Crop management thus influences the ecological dynamics inside these areas (Hoy 2015). For example, the intercropping of several species changes the microclimate within the crop area (soil and air temperature and moisture), which may benefit the nutrition and growth of plants in the system, as long as they are not competing for the same resources (Midmore et al. 1988, Pino et al. 2000).
In Mexico, maize is grown from zero to 3,400 meters above sea level (CONABIO 2011). Diverse management practices have been developed within highly variable conditions, based on the climatic, topographic and biocultural characteristics of a particular place (Mariaca 2011, González-Merino & Ávila-Castañeda 2014, Mateos-Maces et al. 2016, Weerarathne et al. 2017). One of the most widespread practices in rural agriculture is the milpa system, where agronomic practices include the intercropping of maize with other crops as well as crop rotation sequences (Aguilar et al. 2003). This system mainly combines maize with bean (Phaseolus vulgaris L.) and squash (Cucurbita spp; Mariaca 2011). This intercropping provides a series of ecological advantages, such as the fixation of atmospheric nitrogen by Rhizobium spp. in symbiosis with bean plants, weed control and soil moisture retention and protection against erosion by the squash. The maize, in turn, provides support for the bean plant and shade for the beans and the squash; in the same way, maize makes a physical barrier against certain diseases by blocking the dissemination of spores (Francis 1986, Mariaca 2011, Latati et al. 2016, Wang et al. 2017). This cultivation system, like many others around the world, relies on local technology and depends on rainfall for the survival of the plants (Paliwal et al. 2001).
Climate change is widely affecting food security of crops grown under the milpa system, due to altered precipitation patterns and temperatures, and an increased frequency of extreme climatic events, creating negative impacts on crop yields (IPCC 2014, Mbow et al. 2019). This is particularly the case in Mexico and Mesoamerica, where maize is the basis of human nutrition, and approximately 78.4 % of maize cropping depends on rainfall as the main source of water (SIAP 2019). Cropping practices may mitigate the impact of climate change on food security, however, few studies have analysed how variations in agricultural practices influence microclimate within the crop area, and thereby the physiological performance of the maize plant (Murray-Tortarolo et al. 2018). Such studies are necessary for a better understanding of the ecological and functional dynamics within regional maize crop systems.
Most physiological studies of maize have focused on monoculture systems under controlled conditions (Crafts-Brandner & Salvucci 2002, Kim et al. 2007, Wei et al. 2016, Yu et al. 2016). Few studies characterize the physiological performance of this plant under different agricultural management systems as applied in the field (Leakey et al. 2006, Farhad et al. 2018), and most of these focused on the effect of fertilizers or irrigation systems. There is therefore scope for a better understanding of the physiological response of maize to microclimatic variations as a result of different agricultural management systems. Studies in this regard are useful for designing strategies that contribute to reducing the negative effects of climate change on maize yield (Xu et al. 2017) in small-scale management systems, particularly in rainfed conditions, and whose food security is severely threatened by climate modifications (Nigh & Diemont 2013, Murray-Tortarolo et al. 2018).
As most of the area cultivated with maize in Mexico is rainfed, it is necessary to lessen famers’ vulnerability to reduced water availability, as well as rising air temperatures due to climate change. Research as reported in this article may provide knowledge on ways to contribute to this by agricultural management practices that promote soil water retention and lower air and soil temperatures within the crop area. Therefore, the aim of this study was to analyze microclimatic variation and the physiological response of maize under three agricultural management systems: monoculture, maize-bean intercropping and maize-bean-squash intercropping. This would determine which management system offers the best microclimatic conditions for the adequate physiological performance of maize. As suggested in earlier research, soil nutrient availability and maize growth and production are enhanced by their association with other crops (Dahmardeh et al. 2010, Lithourgidis et al. 2011, Ebel et al. 2017, Hassen et al. 2017), therefore we expected that the microclimatic conditions created with maize-bean-squash and maize-bean intercropping would improve the physiological performance of the maize as compared to maize in monoculture.
Materials and methods
Study area. The study was conducted in the municipality of Nacajuca, Tabasco, Mexico. The climate in the area is warm and humid with summer rains, annual rainfall is 1,730.7 mm with a maximum monthly average of 282.5 mm during October and a minimum monthly average of 39.8 mm in April; average annual relative humidity is 82 % (Díaz et al. 2006). Soils are eutric greysol (INEGI 2005). During the study period from December 2016 to April 2017, the nearby weather station recorded an average maximum temperature of 31.3 °C; total rainfall 135.1 mm and average relative humidity 83.3 % (INIFAP 2019, CONAGUA 2020).
Experimental design. An experiment was established on one ha surface area, which was schematically divided into 100 m2 blocks (10 × 10 m). Using a randomized block design, three treatments were established: 1) maize monoculture (M); 2) maize-bean intercropping (MB); 3) maize-bean-squash intercropping (MBS). Each treatment was established in triplicate, resulting in a total of nine blocks of 100 m2 each. Seeds of local varieties of maize (Zea mays L.; Tuxpeño breed) and bean (Phaseolus vulgaris L.) and squash plants (Cucurbita moschata Duchesne ex Poir.) were obtained from local growers.
Prior to maize sowing, weeds were manually eliminated from the soil. Maize was sown by hand, without tilling the soil, placing five seeds in holes at 7 cm in depth along rows of 10 m in length. In all the treatments, maize was sown in December 2016, at an approximate density of 40,000 plants per ha. Bean plants were intercropped with maize plants in a ratio of 1:2 in the MB and MBS blocks; one squash plant per block was planted between the rows of maize in the MBS treatment.
The bean seeds and squash plants were sown and planted 30 days after the maize to avoid competition between seedlings. No water (rainfed agriculture), fertilizer or any other kind of agrochemical was applied during the entire experiment. Weeds were controlled manually during the first 60 days after maize sowing.
The microclimate within each block and the physiological response of the maize plants in them was measured on four occasions: 33, 58, 79 and 99 days after the maize was sown (between January and April 2017).
Microclimate. Microclimate was measured using stations equipped with Onset (Onset Computer Corporation, Bourne, U.S.A.) sensors to measure air temperature and relative humidity (S-THB-M002; placed 1.5 meters above soil level), soil temperature (S-TMB-M002; placed 5 cm deep) and soil volumetric water content (S-SMD-M005; placed 15 cm deep). The sensors were connected to a HOBO U30-NRC data logger. At the same time as the measurement systems within each block, an open-air microclimate station was installed for reference. Microclimate characterization was done for a period of one week per measurement. Vapor pressure deficit was calculated using the air temperature and relative humidity data following Jones (1992).
Gas exchange. CO2 assimilation rate (A, µmol CO2 m-2 s-1), transpiration rate (E, mmol H2O m-2 s-1) and stomatal conductance to water vapor (Gsw, mol H2O m-2 s-1) were measured in 12 maize plants per treatment on each sampling day at four plants per block. Measurements were taken between 06:00 h and 18:00 h at three-hour intervals. An LI-6400XTR infrared gas analyzer (Li-Cor Inc. Lincoln, Nebraska, U.S.A.) was used coupled to a leaf chamber equipped with an LED light source (6400-02), which provided constant light conditions during the measurements. The amount of light was similar to the ambient light measured just before each reading. CO2 concentration was maintained at 400 ppm during all measurements. A and E data are presented by the readings taken throughout the day and the daily totals, which were obtained by calculating an integral from the data taken during the day (Pimienta-Barrios et al. 2003, LI-COR Technical Solutions 2015) as follows:
Where
Where 180 min is the time in minutes between measurements. The instantaneous A and E data were used to calculate water use efficiency (WUE) by the division of A (μmol CO2 m-2 s-1) by E (mol H2O m-2 s-1); the daily average of the plants in each treatment is also presented.
Chlorophyll fluorescence. Immediately after gas exchange measurements, and using the same leaves, readings were taken for photosystem II quantum yield (ΦPSII), electron transport rate (ETR; µmol m-2 s-1) and non-photochemical quenching (NPQ). Readings were taken at three-hour intervals between 06:00 and 18:00. A Mini-PAM II (WALZ, Effeltrich, Germany) portable fluorometer was used. ΦPSII, ETR and NPQ was calculated following Maxwell & Johnson (2000):
Where:
F'm |
- Maximum fluorescence of light-adapted plants. |
Ft |
- Level of fluorescence immediately before the saturating light pulse. |
F0m |
- Maximum fluorescence of dark-adapted plants. |
PFDa |
- Fraction of incident light absorbed by the leaf, 0.84 is used as default value for green leaves. |
0.5 |
- Is a factor that takes into account the partitioning of energy between photosystem I and II. |
Water potential. In each sampling, 5 × 5 cm foliar samples were collected from nine different plants per treatment. Collection was done between 05:00 h and 06:00 h; the samples were kept in hermetic bags under refrigeration until laboratory processing. Leaf water potential (Ψ, MPa) was determined using a WP4C (Decagon Devices, Washington, USA) water potential meter.
Chlorophyll content. Chlorophyll content (Chl C) was measured using an MC-100 (Apogee Instruments, Inc, Utah, USA) chlorophyll meter. A reading was taken from nine plants per treatment in each sampling, three from each block.
Statistical analyses. A one-way analysis of variance (ANOVA) with an α = 0.05 and post hoc Tukey tests were used to compare the environmental (Tsoil, Tair, SVWC and VPD) and physiological (A, E, WUE, Gsw, Ψ, Chl C, ΦPSII, ETR, NPQ) variables per treatment (M, MB, MBS) and per measurement (at days 33, 58, 79 and 99 after sowing). Prior to the analysis, the homogeneity of variances and normality of data were tested. The Kruskall-Wallis test was used when data did not present normality, which was the case for data on soil temperature and volumetric water content, WUE, ΦPSII, ETR and NPQ. For all analyses, R software version 4.02 (R Core Team 2020) was used.
Non-metric multidimensional scale analysis (NMDS) was used to identify similarities in the physiological strategies used by maize plants between treatments. For this analysis, the vegan package was used (Oksanen et al. 2019) in R software version 4.02. Covariance for NMDS data output was calculated per treatment for comparison of ranges of variation (this analysis does not assume a linear relationship between the variables). NMDS scores were tested for correlation with the different environmental variables measured, to analyze the relationship between the physiological and microclimatic parameters.
Results
Microclimate. During the first three sampling days (days 33, 58 and 79), the differences between treatments in terms of microclimate were minimal across all the measured variables. The only exception was soil temperature, which from day 58 onwards was always highest in the monoculture treatment (Appendix 1). At day 99 after maize sowing, when the bean and squash plants were well developed, the maximum soil temperature recorded differed between treatments (χ2(2) = 49.8; P < 0.05): in the MB treatment, the temperature reached 30.5 ± 0.1 °C, while in the MBS and M treatments the recorded temperatures reached 32.9 ± 0.1 ºC and 35.1 ± 0.03 °C, respectively, between 13:00 h and 16:00 h in all cases (Figure 1A). The maximum air temperature between 13:00 h and 16:00 h also differed between treatments (F(2) = 18.36; P < 0.05): in monoculture the maximum temperature was up to 1.2 °C higher than in the other two treatments, which did not show significant differences (Figure 1B).

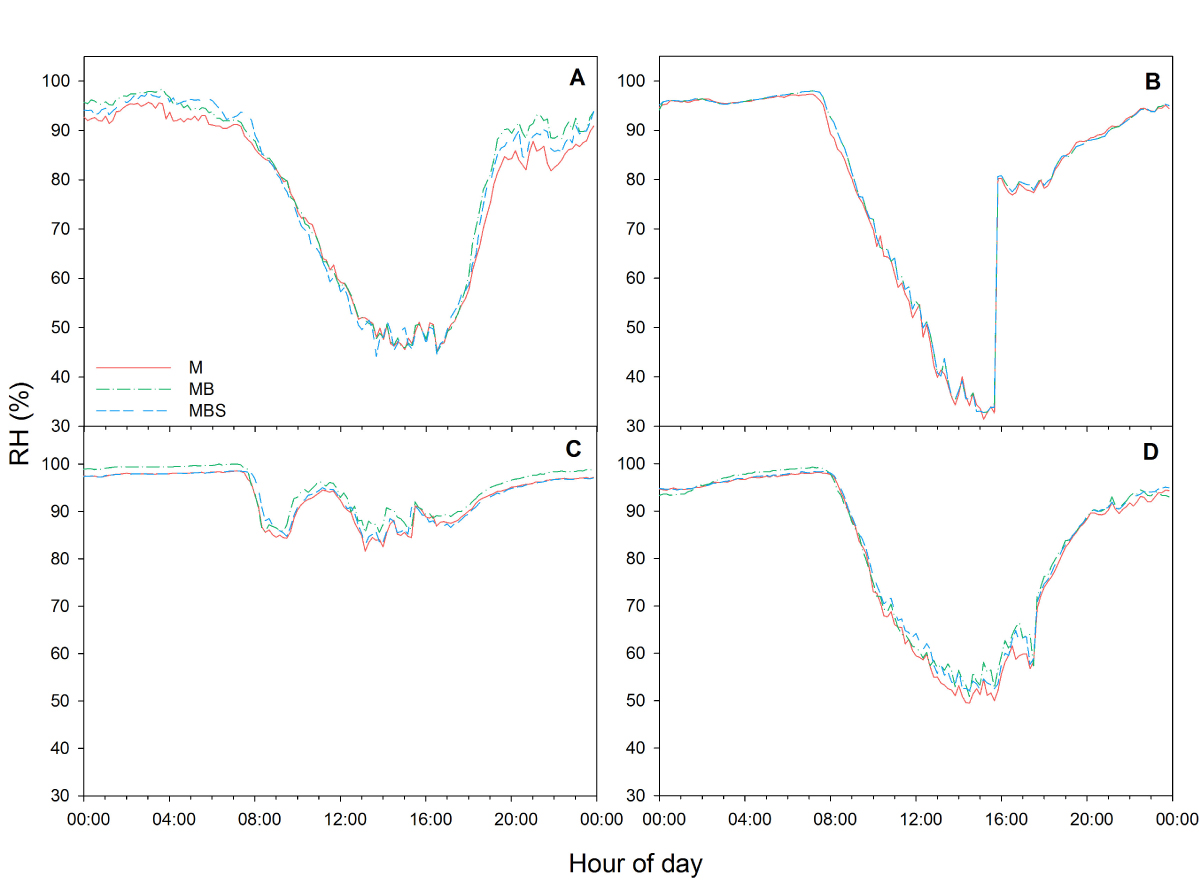
Figure 1 Daytime behaviour of four microclimatic parameters characterized at day 99 after maize sowing in three treatments: M.- maize, MB.- maize-bean: MBS.- maize-bean-squash. A) soil temperature, B) air temperature, C) soil volumetric water content (SVWC), D) vapor pressure deficit (VPD). Data are averages from one week of measurements.
Soil volumetric water content was higher in the MBS treatment compared to the other two, presenting a difference throughout the day of up to 42 % compared to the M treatment and 12.1 % compared to the MB treatment (Figure 1C). All the treatments showed statistical differences between them (χ2(2) = 193.94; P < 0.05). The highest VPD was measured between 13:00 h and 16:00 h in all cases, reaching values up to 3.4 kPa in the maize monoculture, which was significantly higher than in the other two treatments (Figure 1D; F(2) = 25.02; P < 0.05).
Physiological variables. Daily average net CO2 assimilation had the highest recordings in the first measurement at day 33 after maize sowing, with no significant differences between treatments, and at day 58 after maize sowing, when maize plants in the maize-bean-squash intercropping presented the highest assimilation (1.27 ± 0.03 mol m-2 d-1; F(2) = 3.91; P = 0.04; Table 1). At day 99 after maize sowing, the MB and MBS maize plants had a significantly higher rate of photosynthesis than the M plants (F(2) = 3.69; P = 0.038); the MB plants showed the highest rates of photosynthesis (0.81 ± 0.006 mol m-2 d-1; Table 1). Fixation recordings throughout the day showed that the plants under all three treatments presented similar assimilation during the first and second readings, with the exception of midday when the plants in the MB treatment presented the highest and lowest values, (in the first and second reading, respectively; Figure 2A, B), while for the third reading, no differences were recorded throughout the day (Figure 2C), and towards the last reading the M plants presented the lowest assimilation throughout the daylight period (Figure 2D).
Table 1 Daily net CO2 assimilation (A; mol CO2 m-2 d-1), daily net transpiration (E; mol H2O m-2 d-1), daily average water use efficiency (WUE; mol CO2/ mol H2O), water potential (Ψ; MPa) and chlorophyll content (Chl C; µmol m-2) of maize plants under three treatments: maize monoculture (M), maize-bean intercropping (MB) and maize-bean-squash intercropping (MBS) during four measurements: day 33, 58, 79 and 99 after sowing. Different letters indicate significant differences between treatments within each measurement (α = 0.05). The data are averages ± SE; n = 9 in all cases.
| Day | Treatment | A | E | WUE | Ψ | Chl C |
|---|---|---|---|---|---|---|
| M | 1.01 ± 0.07a | 184.2 ± 10.6b | 0.005 ± 0.0002a | -1.30 ± 0.06c | 237.2 ± 17.7a | |
| 33 | MB | 1.10 ± 0.03a | 222.7 ± 6.4a | 0.005 ± 0.0005a | -0.97 ± 0.06ab | 276.8 ± 19.5a |
| MBS | 0.99 ± 0.05a | 194.5 ± 10.5ab | 0.005 ± 0.0003a | -0.90 ± 0.13a | 214.6 ± 21.1a | |
| M | 1.14 ± 0.03a | 248.9 ± 11.5a | 0.005 ± 0.0002b | -1.32 ± 0.09a | 421.2 ± 35.9a | |
| 58 | MB | 1.07 ± 0.06b | 233.6 ± 16.1a | 0.005 ± 0.0003ab | -1.64 ± 0.09a | 394.6 ± 32.6a |
| MBS | 1.24 ± 0.03ab | 210.9 ± 10.9a | 0.006 ± 0.0006a | -1.33 ± 0.13a | 361.8 ± 23.3a | |
| M | 0.63 ± 0.02a | 151.2 ± 8.2a | 0.004 ± 0.0003b | -1.37 ± 0.07a | 448.6 ± 33.1a | |
| 79 | MB | 0.64 ± 0.02a | 139.4 ± 5.5ab | 0.005 ± 0.0003a | -1.49 ± 0.09a | 444.6 ± 25.3a |
| MBS | 0.59 ± 0.01a | 122.9 ± 6.2b | 0.005 ± 0.0002a | -1.58 ± 0.09a | 471.4 ± 34.9a | |
| M | 0.57 ± 0.06b | 277.7 ± 32.4b | 0.002 ± 0.0001a | -0.99 ± 0.13a | 438.8 ± 44.3a | |
| 99 | MB | 0.81 ± 0.05a | 350.1 ± 34.1a | 0.002 ± 0.0001a | -1.79 ± 0.12bc | 409.9 ± 35.9a |
| MBS | 0.76 ± 0.07ab | 354.9 ± 29.7a | 0.002 ± 0.0001a | -1.72 ± 0.14c | 326.3 ± 20.2a |
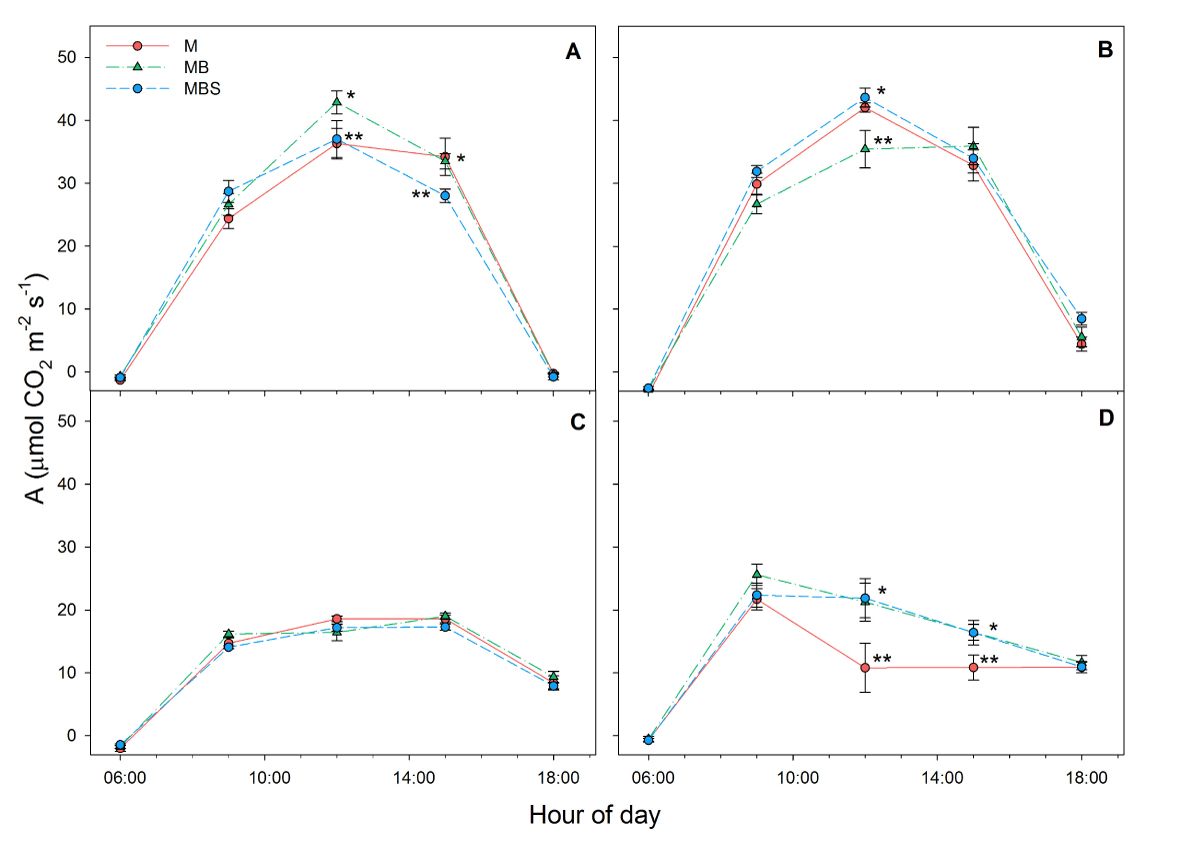
Figure 2 Daytime CO2 assimilation (A) recorded in maize plants under three treatments: M.- maize monoculture, MB.- maize-bean intercropping, MBS.- maize-bean-squash intercropping at A) 33 days, B) 58 days, C) 79 days, D) 99 days after maize sowing. Different symbols indicate significant differences between treatments within the same hour of day; the absence of symbols indicates that there were no statistical differences (α = 0.05). Data are averages ± SE.
The highest total daily average transpiration rates (E) were recorded during the last sampling day (day 99) in the MB and MBS maize plants (22.6 ± 0.01 and 23 ± 0.03 mol m-2 d-1, respectively), however, no significant differences were found between treatments (F(2) = 1.81; P = 0.19; Table 1). Unlike the first three sampling days, where daytime transpiration rates were similar across all the maize plants in the different treatments (Figure 3A-C), during the last sampling date the transpiration rate of the M plants was observed to be significantly lower at midday (7.52 ± 1.19 mmol m-2 s-1; F(2) = 3.16; P = 0.07; Figure 3D) than the maize plants in the other two treatments (10.3 ± 1.14 and 11.6 ± 1.12 mmol m-2 s-1 for MB and MBS plants, respectively).

Figure 3 Transpiration rate (E) recorded in maize plants under three treatments: M.- maize monoculture, MB.- maize-bean intercropping, MBS.- maize-bean-squash intercropping at A) 33 days, B) 58 days, C) 79 days, D) 99 days after maize sowing. Different symbols indicate significant differences between treatments within the same hour of day; the absence of symbols indicates that there were no statistical differences (α = 0.05). Data are averages ± SE.
Stomatal conductance was similar between maize plants of the different treatments during the first three measurement days (Figure 4 A-C). However, towards day 99 of the experiment, the maize plants under the MBS treatment, as well as those under the MB treatment, maintained higher stomatal conductance than the M plants, reaching values of 0.56 ± 0.06 mol H2O m-2 s-1, 0.36 ± 0.07 mol H2O m-2 s-1 and 0.16 ± 0.04 mol H2O m-2 s-1 at 12:00 h for the MBS, MB and M maize plants, respectively (Figure 4D; F(2) = 9.33; P < 0.05).

Figure 4 Stomatal conductance (Gsw) recorded in maize plants between 06:00 h and 18:00 h under three treatments: M.- maize monoculture, MB.- maize-bean intercropping, MBS.- maize-bean-squash intercropping at A) 33 days, B) 58 days, C) 79 days, D) 99 days after maize sowing. Different symbols indicate significant differences between treatments within the same hour of day; the absence of symbols indicates that there were no statistical differences (α = 0.05). Data are averages ± SE.
Although no significant differences were recorded in water use efficiency between maize plants under different treatments throughout the day in the four measurements (Figure 5), total water use efficiency dropped in all cases in reading four at day 99 after maize sowing. No significant differences were found between the plants in the different treatments (Table 1; χ2(2) = 3.79; P > 0.05).
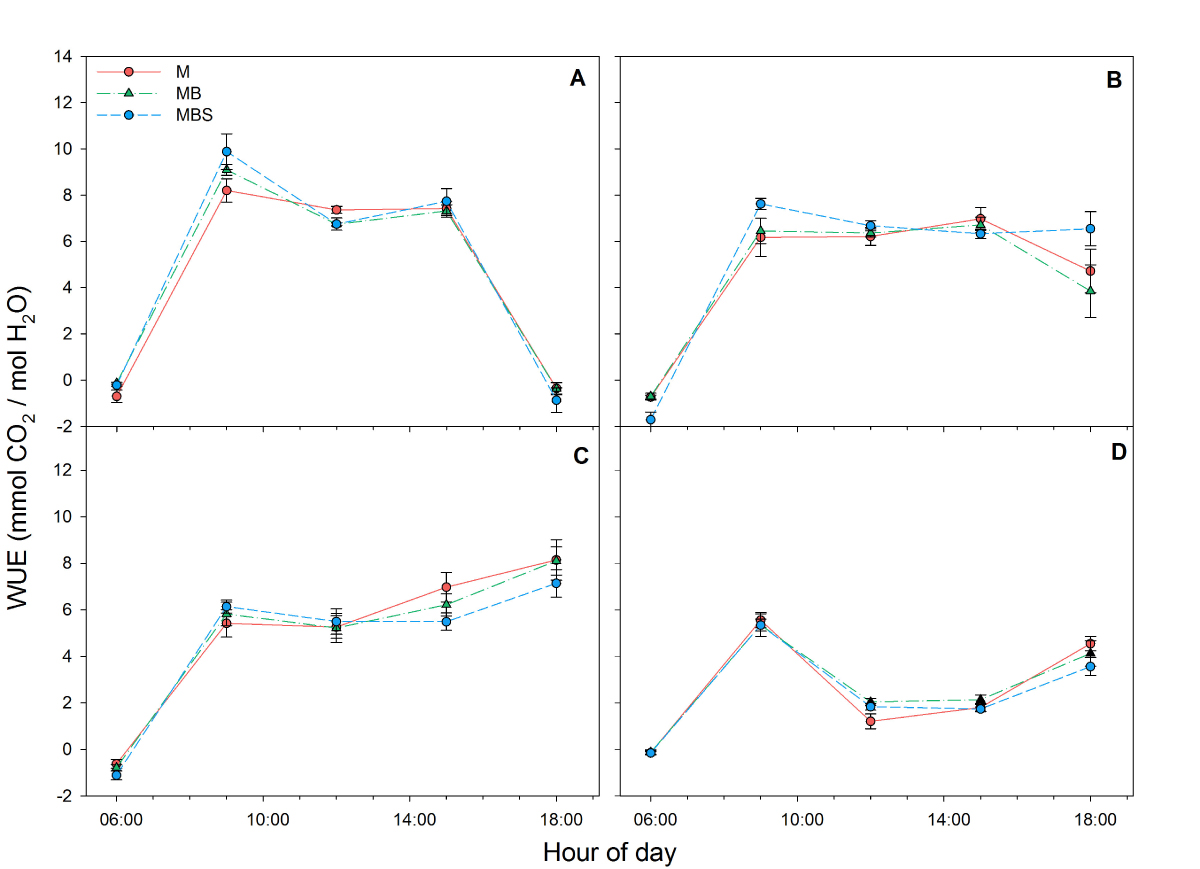
Figure 5 Water use efficiency (WUE) recorded in maize plants between 06:00 h and 18:00 h under three treatments: M.- maize monoculture, MB.- maize-bean intercropping, MBS.- maize-bean-squash intercropping at A) 33 days, B) 58 days, C) 79 days, D) 99 days after maize sowing. No significant differences were found between treatments per hour of measurement (α = 0.05). Data are averages ± SE.
The foliar water potential (Ψ) at day 33 after sowing showed the highest values in the MBS maize plants, with a difference of 0.4 MPa compared to the M plants, which showed the lowest values (F(2) = 5.36; P = 0.0119). No significant differences were recorded between maize plants in the different treatments at days 58 and 79 after sowing. At day 99, the M plants presented a higher water potential (-0.99 ± 0.13 MPa), which was between 0.8 and 0.73 MPa less negative than the MB and MBS maize plants (F(2) = 11.13; P < 0.05; Table 1).
The lowest values for chlorophyll content (Chl C) were recorded on the first sampling day, while the highest were recorded at day 99 after maize sowing. Although there were no significant differences in chlorophyll content between treatments throughout the experiment (F(2) = 27.44; P > 0.05; Table 1), on the last sampling day the MBS maize plants presented on average 112.46 ± 48.9 µmol m-2 less chlorophyll content than the M maize plants.
During the first sampling day (Table 2), maize plants in the MBS treatment presented higher ΦPSII, ETR and NPQ values compared to the plants in the other two treatments (F(2) = 4.88, P = 0.0167; F(2) = 3.58, P = 0.0434; F(2) = 3.995, P = 0.0318, respectively) in the hours of greatest light incidence. During sampling days 58 and 79, no significant differences were recorded between treatments (Table 2). Towards the end of the experiment (day 99) the lowest NPQ was recorded in the M plants (0.54 ± 0.13), while the highest was in the MBS maize plants (1.99 ± 0.44, Table 2). At day 99 after the start of the experiment, observed ΦPSII was higher in the M maize plants throughout the day compared to the other two treatments (0.61 ± 0.05; 0.59 ± 0.06 and 0.51 ± 0.06 at 12:00 h for M, MB and MBS maize plants, respectively; Figure 6A), but the observed differences were not statistically significant (χ2(2) = 2.51; P = 0.29). The highest values of electron transport rate (ETR) were recorded at 09:00 h (Figure 6B), with no significant differences between treatments (χ2(2) = 2.38; P = 0.31). The MBS maize plants obtained higher NPQ values throughout the day, reaching a maximum of 1.99 ± 0.44 at 12:00 h, in contrast to the plants of the other two treatments (χ2(2) = 10.34; P < 0.05). The monoculture maize plants presented the lowest NPQ values (0.54 ± 0.14 at 12:00) throughout this last reading (Figure 6C).
Table 2 Photosystem II quantum yield (ΦPSII), electron transport rate (ETR) and non-photochemical quenching (NPQ) in maize plants recorded between 12:00 and 16:00 for the readings taken at days 33, 58, 79 and 99 after maize sowing. Data are averages ± SE. Different letters denote statistical differences between treatments in each measurement (α = 0.05).
| Day | Treat | ΦPSII | ETR (µmol m-2 s-1) | NPQ |
|---|---|---|---|---|
| 33 | M | 0.28 ± 0.02b | 154.5 ± 13.40b | 1.87 ± 0.25a |
| MB | 0.46 ± 0.06a | 141.3 ± 18.14b | 1.03 ± 0.30b | |
| MBS | 0.34 ± 0.04ab | 212.4 ± 26.26a | 2.25 ± 0.36a | |
| 58 | M | 0.32 ± 0.04a | 178.1 ± 28.76a | 2.92 ± 0.29a |
| MB | 0.31 ± 0.02a | 194.6 ± 4.46a | 2.75 ± 0.25a | |
| MBS | 0.28 ± 0.03a | 197.5 ± 19.59a | 3.71 ± 0.34a | |
| 79 | M | 0.65 ± 0.01a | 26.2 ± 9.34a | 0.56 ± 0.13a |
| MB | 0.65 ± 0.02a | 33.6 ± 8.47a | 0.42 ± 0.12a | |
| MBS | 0.66 ± 0.01a | 29.7 ± 5.72a | 0.55 ± 0.12a | |
| 99 | M | 0.61 ± 0.05a | 29.9 ± 8.11a | 0.54 ± 0.13b |
| MB | 0.46 ± 0.07b | 32.3 ± 8.34a | 1.03 ± 0.38b | |
| MBS | 0.51 ± 0.05ab | 29.9 ± 5.59a | 1.99 ± 0.44a |
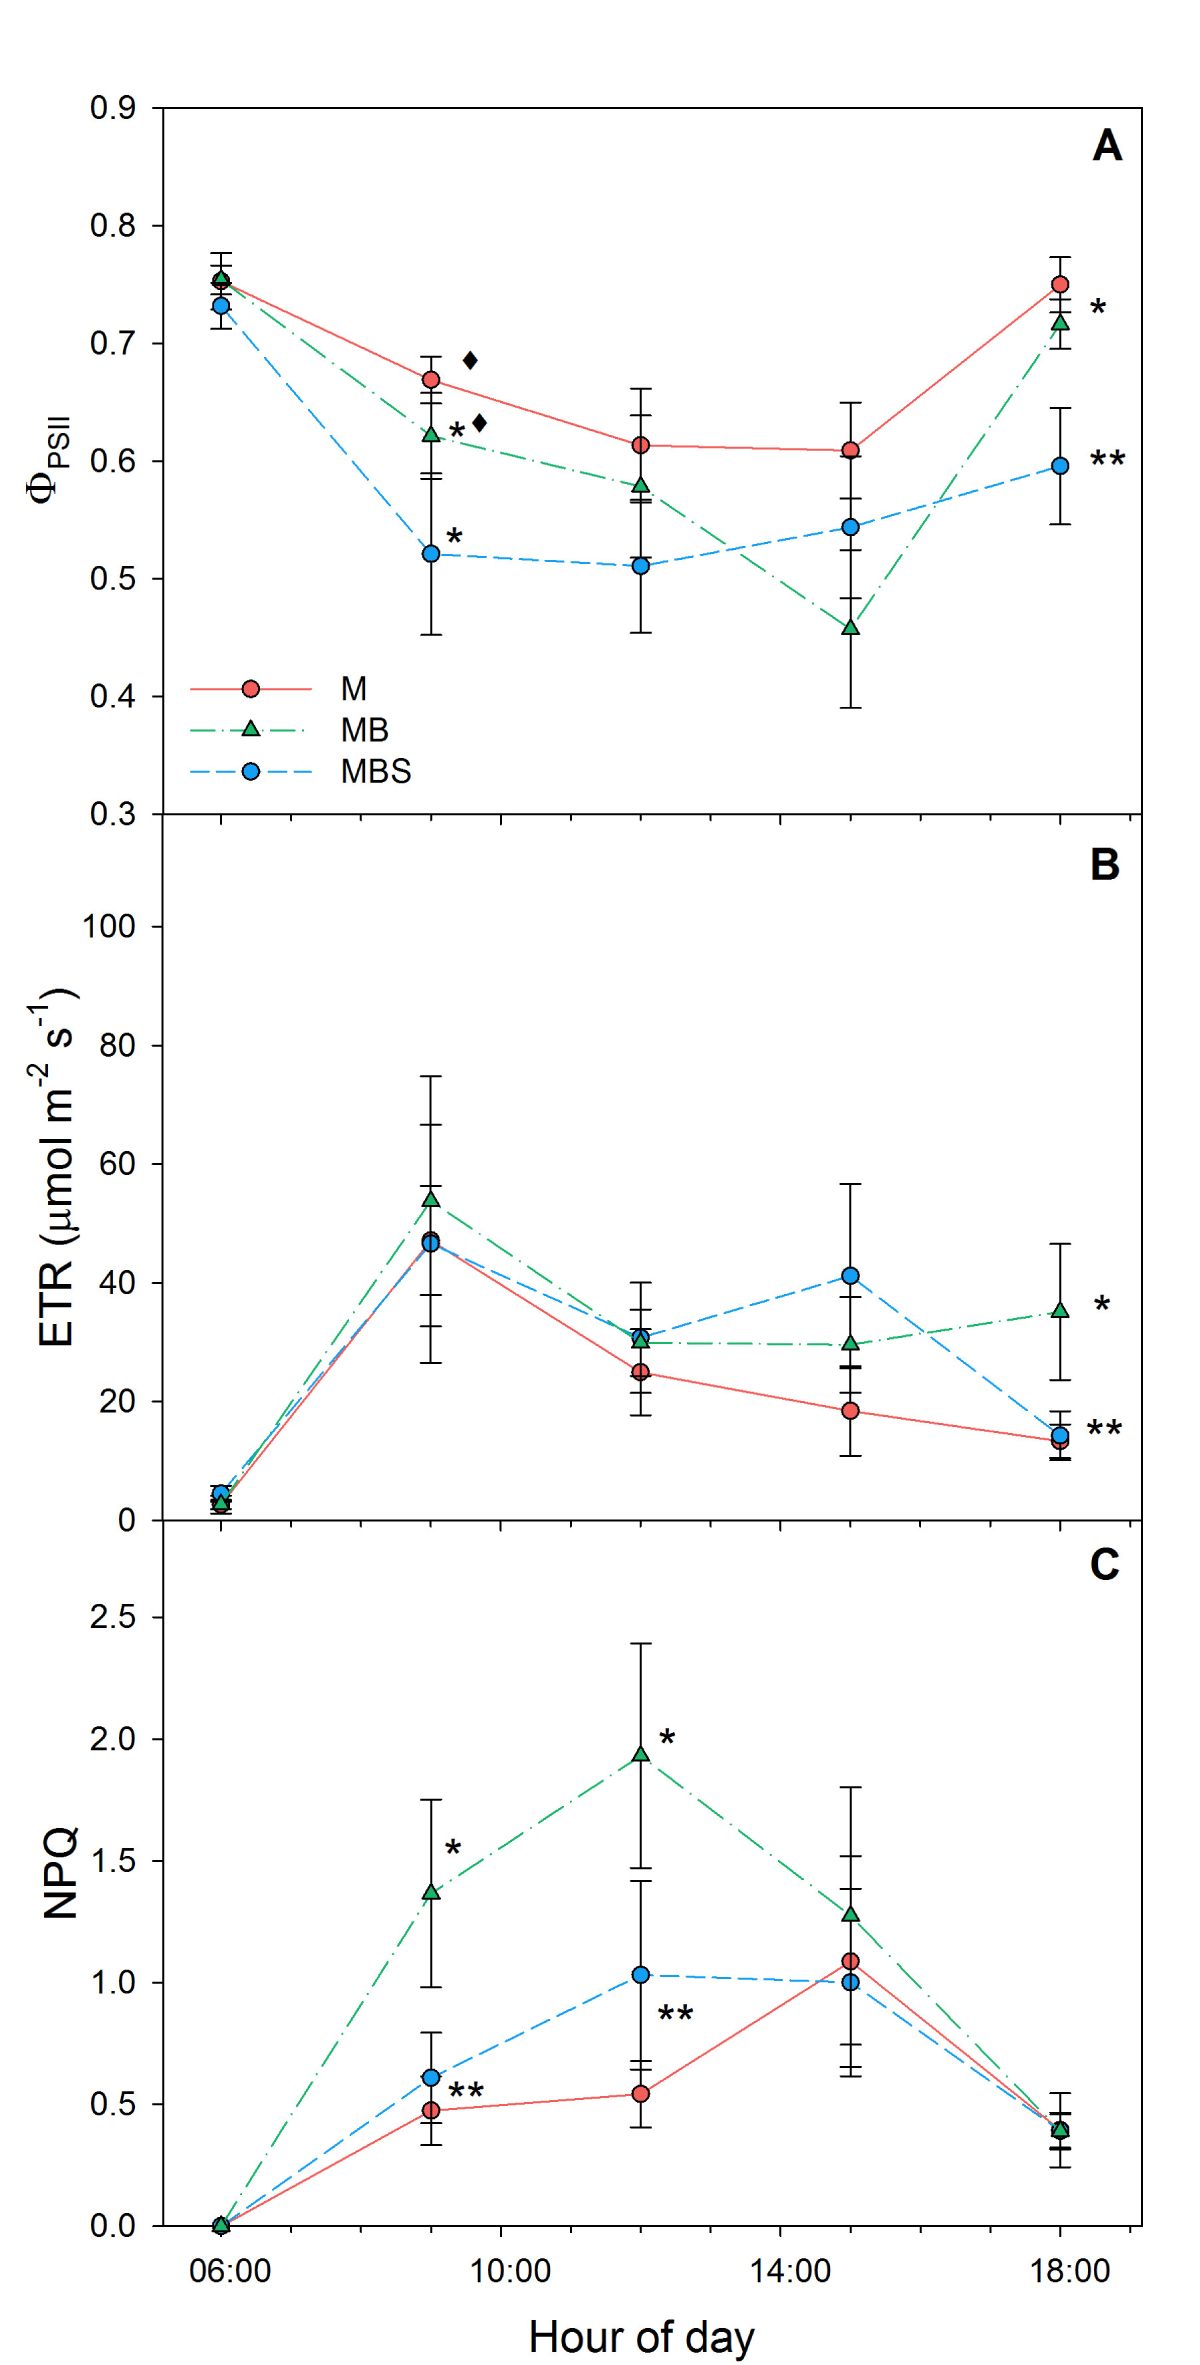
Figure 6 Chlorophyll fluorescence in maize plants at 99 days after sowing. M.- maize monoculture, MB.- maize-bean intercropping, MBS.- maize-bean-squash intercropping. A) Quantum efficiency of Photosystem II ΦPSII; B) Electron transport rate; C) Non-photochemical quenching. Different symbols indicate significant differences between treatments within the same hour of day; the absence of symbols indicates that there were no statistical differences (α = 0.05). Data are averages ± SE.
The non-metric multidimensional scale analysis shows that soil temperature and volumetric water content had an opposite relationship between them and on plant physiological behavior (NMDS; Figure 7). Dispersion of the points that represent maize plants under MB and MBS treatments was similar between them (highly associated with the soil volumetric water content), while maize plants under M treatment had a different dispersion compared to the other two treatments, and highly associated with soil temperature and VPD. The above is clearer when observing the ellipses that represent the covariance of the dispersion of the points in each treatment: there is a clear overlap of the MB and MBS treatments, while M treatment is different from the other two (Figure 7).
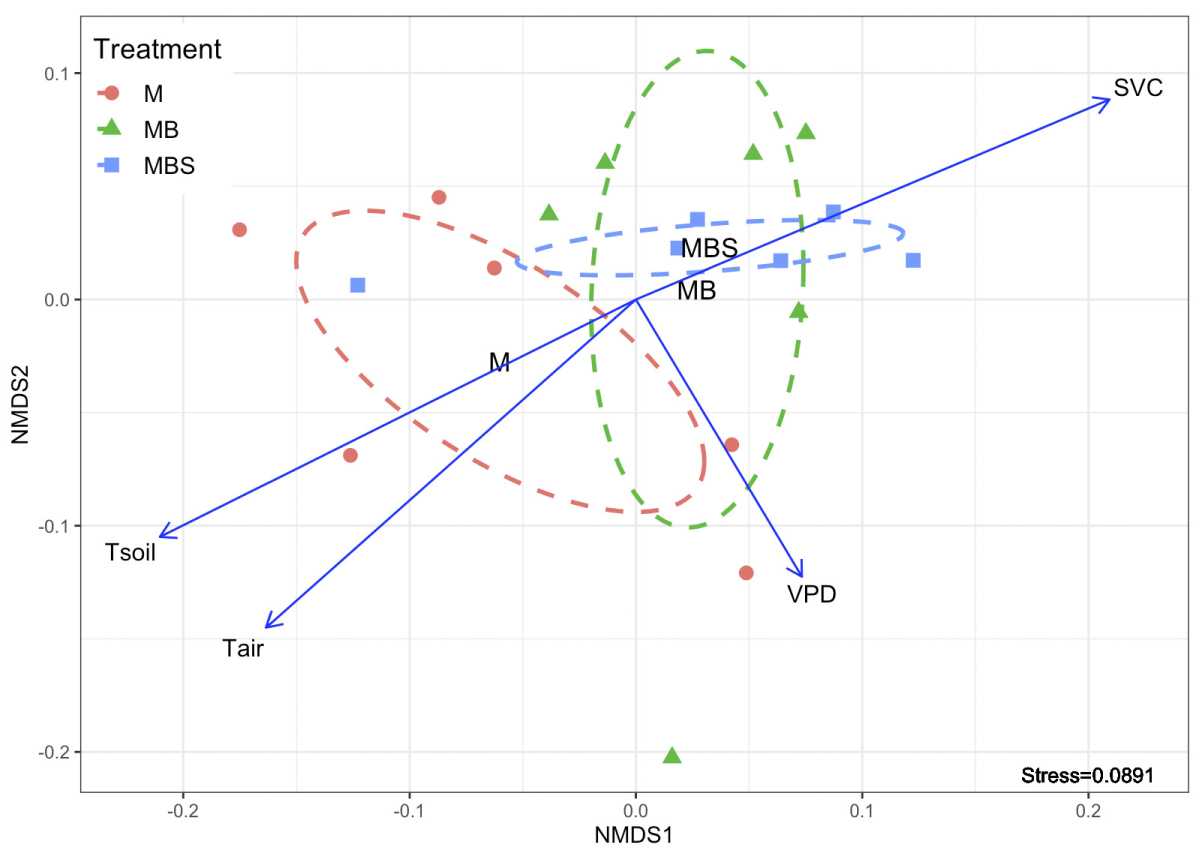
Figure 7 Non-metric multidimensional scale analysis (NMDS) of the physiological variables measured in maize plants under three treatments (M.- maize monoculture, MB.- maize-bean intercropping, MBS.- maize-bean-squash intercropping), and their relationship with the microclimatic parameters characterized: Tair.- air temperature; Tsoil.- soil temperature; SVWC.- soil volumetric water content; VPD.-vapor pressure deficit. Dotted lines indicate the degree of dispersion of the data for each treatment, constructed from a covariance matrix of the NMDS data output.
Discussion
The results suggest that maize grown under a polyculture management system benefits the physiological development of the plant, as a result of more favorable microenvironmental conditions than under a monoculture system. Based on our results, the maize-bean-squash combination maintains a soil volumetric water content close to saturation throughout the day (Onset 2018). As the squash leaves cover the ground, they reduce water loss by evaporation; this is reflected in a SVWC up to 42 % higher in the MBS treatment compared to the M treatment. Similar results are reported by Ghanbari et al. (2010), who report a soil water content up to 58 % higher at day 95 after maize sowing when combined with Vigna unguiculata L., compared to a monoculture system.
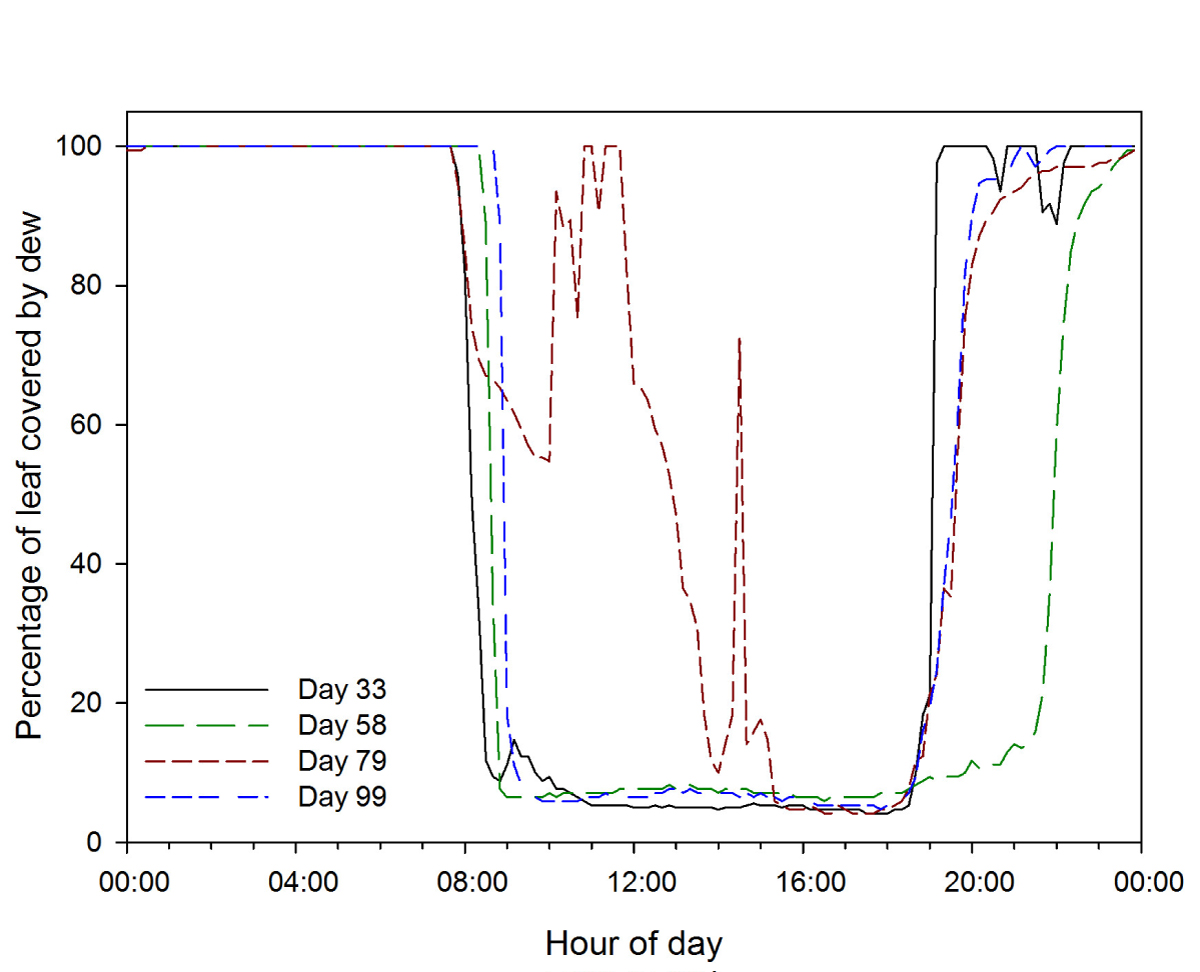
During our experiment between December 2016 and April 2017 in rainfed agriculture, accumulated rainfall of only 135.1 mm was recorded (CONAGUA 2020). However, the high relative humidity in the region of more than 80 % for more than 11 hours per day (Appendix 2) contributed to water condensation over the leaves for an average period of 12.6 ± 0.7 h (Appendix 3). This water dripped from leaves and moistened the soil to the reported levels, highlighting the importance of ground cover to retain humidity in the soil (as the cover provided by squash plants in the milpa system), especially when the amount of rainfall is below average, as well as in low precipitation environments in general.
It has been reported that the presence of weed species associated with maize plants can reduce the air temperature by up to 3.6 ºC (Pino et al. 2000). In our experiment, we found that the maize-bean and maize-bean-squash combinations have the capacity to reduce maximum air temperature by up to 1.7 °C, and maximum soil temperature by up to 5 °C, compared to monoculture. This is in agreement with the findings of Ghanbari et al. (2010), who reported that the soil temperature 95 days after maize sowing in combination with V. unguiculata was up to 7 ºC lower compared to a maize monoculture system. The result of our experiment, coinciding with the findings of the cited authors, is due to the increased ground cover (shade) by the combination of maize, bean and squash plants, which reduces the soil temperature compared to the soil under a maize monoculture system.
Both air and soil temperatures are factors that directly influence the photosynthetic performance of plants. For example, it has been reported that for greenhouse-sown maize plants, the optimal air temperature for photosynthesis is 34 ºC; temperatures above 38 °C cause a drastic decrease in photosynthetic rates due to stomatal closure (Crafts-Brandner & Salvucci 2002, Kim et al. 2007). These reports agree with our results, although at 99 days after maize sowing maximum recorded air temperatures were above 36 ºC across all treatments, the M plants obtaining the lowest photosynthetic rates associated with the highest air temperature (Figure 1A). More importantly, the maximum soil temperature was also up to 14 % higher in the M treatment than in the other treatments (Figure 1B).
Based on the above, in the MB and MBS treatments, where the highest soil volumetric water content was also recorded, the maize plants presented the highest photosynthetic and transpiration rates. This may be related to stomatal closure in maize plants under the monoculture treatment (Figure 4D) in response to the low availability of water compared to the other two treatments. In this way, the MB and MBS maize plants are able to fix greater amounts of CO2 than the monoculture system plants while maintaining a similar water use efficiency.
Although a linear relationship has been reported in maize between transpiration rate and air temperature (Yang et al. 2012), we found that the transpiration rate in the maize monoculture was lower in comparison to the maize-bean and milpa (maize-bean-squash intercropping) at day 99 (Table 1). As mentioned earlier, this is because during most of the day, stomatal conductance of the maize plants under monoculture during the last reading was lower than in the other two treatments (Figure 4D). This may have been caused not only by the low availability of water, but also by the higher temperature and VPD recorded during the day in this treatment compared to the other two treatments (Figure 2; Taiz & Zeiger 2002).
According to Gleason et al. (2017), an increase in the transpiration rate in greenhouse-grown maize represents a decrease in water potential, which agrees with our results towards the end of the experiment, when the MB and MBS maize plants obtained the most negative water potential (-1.79 ± 0.12 MPa and -1.72 ± 0.14 MPa, respectively; Table 1). This is related to higher total daily average transpiration rates in MB and MBS plants (22.69 ± 0.04 and 23.00 ± 0.03 mol H2O m-2 d-1, respectively; Figure 3D and Table 1), compared to the monoculture plants. The greater amount of water in the soil under these two treatments could explain the high transpiration rate and stomatal conductance presented by the MB and MBS plants compared to the monoculture plants. Similar results were found by Hayat et al. (2020) who reported a direct relationship in maize plants between the rate of transpiration, stomatal conductance and the availability of water in the soil.
Crafts-Brandner & Salvucci (2002) found that NPQ values in maize plants are negatively affected when the air temperature rises to 37.5 °C in greenhouse-grown plants, while the ΦPSII is not sensitive to temperature changes. Gleason et al. (2017) found that the electron transport rate did not vary in response to water stress. In the experiment reported here, no significant differences were found between treatments in regard to ΦPSII and ETR during the hours of greatest light incidence at 99 days after sowing (Figure 6A, B), despite the microclimatic differences found. However, we found that the MB maize plants were more efficient at dissipating energy in the form of heat (NPQ). In general, our data from the three chlorophyll fluorescence variables presented high dispersion, and the number of samples was not sufficient to confirm statistical differences of ΦPSII and ETR between treatments.
Previous studies have reported a decrease in chlorophyll content in response to increased water stress (Bawa et al. 2015). We could not confirm that this occurred in our experiment, although there was up to 25 % less chlorophyll content in maize plants under MBS treatment compared with plants in the MB treatment. This may be related to the fact that, although the volumetric water content was significantly lower in the M treatment towards the end of the readings, no significant differences were recorded in foliar water potential between plants under the different treatments (Table 1). This indicates that plants may use different physiological strategies in each treatment to compensate for the lack of water in the soil (Figure 7). An example is a strong stomatal control that regulates transpiration, primarily in the M plants, where water availability in the soil was lower compared to the other two treatments.
In conclusion, this study provides quantitative evidence of how differences in the agricultural management of maize affect microclimatic conditions in the crop area, and the influence of such variation on plant physiology. Compared to monoculture, the maize-bean-squash combination (milpa system) significantly decreases air and soil temperatures and moisture retention within the crop area. This allows for a higher photosynthetic rate and non-photochemical quenching in maize plants when the intercropped plants are fully developed, compared to monoculture maize plants. Despite also presenting a high transpiration rate, the maize plants in the MBS combination maintain a water use efficiency similar to the plants in the other two treatments, as a result of high soil humidity. Therefore, practices such as the milpa system contribute to improving microenvironmental conditions for the maize crop. In addition, given the potential adverse environmental conditions predicted by several climate change models, agricultural practices like those mentioned here have the potential to reduce the adverse effects of climate change on traditional maize cultivation by maximizing water retention in the soil.
The combination of maize plants with bean and squash plants (milpa) is a practice that is being lost among farmers in different parts of Mexico. Given the microclimatic advantages that the intercropping of maize in the milpa provides, it is necessary to rescue and promote this practice within traditional Mesoamerican agriculture to contribute to the food security of small farmers in the context of a changing climate.