


 nueva página del texto (beta)
 Inglés (pdf)
 Artículo en XML
 Referencias del artículo
 Enviar artículo por email
 Citado por SciELO
  Similares en
SciELO
Similares en
SciELO 
 Permalink
From an ecological point of view, a weed is a plant that thrives and forms self-sustaining populations in anthropogenic environments (Baker 1965). However, these environments are heterogeneous, often forming mosaics with different types, intensities, frequencies and predictability of disturbance (Šilc 2010). Therefore, if species or populations live in habitats with different levels of disturbance, they may exhibit different degrees of weediness or synanthropy (= with humans) (Baker 1967).
The traits that make a species successful as a weed are still controversial. They are relevant for understanding recent plant evolution, as part of a holistic approach to implement sustainable weed management strategies (Gaba et al. 2017), or for finding a model that would help to deepen understanding of weed biology (Chao et al. 2005).
A number of studies comparing pairs of congener weeds and non-weeds observationally or experimentally (Baker 1965, 1967, Radford & Cousens 2000) and the analysis of large databases (Daehler 1998, Sutherland 2004, Kuester et al. 2014) appear to show that, among other traits, weeds are fast-growing and early, prolific and sustained reproducers. These traits, along with a few others (Baker 1965), have been widely accepted as those of the "ideal weed". The characteristics, in theory, correspond to a successful strategy in environments characterized by recurrent disturbance (Grime 1977, Karlsson & Méndez 2005).
However, analytical and experimental support is scarce and contradictory (Keeler 1989, Williamson 1993, MacKinnon et al. 2014, Radford & Cousens 2000), and some authors disqualify the ideal weed attributes (Perrins et al. 1993). On average, 86 % of the traits of the "ideal weed" were present in the 17 most aggressive weeds worldwide. This percentage decreases only a little if we consider a sample of weeds in general (81 %). However, of non-weedy species taken from a random sample of English flora, which included perennials, 59 % still have these characteristics (Keeler 1989). Experimental comparisons do not always support these traits (e.g., MacKinnon et al. 2014).
Plant growth rates and biomass allocation patterns are fundamental plant life history components. These characteristics are both heritable and variable, so natural selection operates (Arendt 1997), shaping adaptive strategies (Grime 1977). Such characteristics tend to have ontogenetic and environmental controls, in addition to genetic ones (Harper & Ogden 1970, Evans 1972, Grime & Hunt 1975).
Plant growth and development may be quantified using various methods, and their interpretation is discussed between schools (Poorter & Lewis 1986). Relative growth rate, or the increase in total dry mass during a given time period, is a frequently used method. This measure varies during development and is often negatively correlated with seed size (Turnbull et al. 2012) and plant size (Poorter et al. 2012).
Biomass allocation (Reich 2002), i.e., the relative proportions of total biomass allocated to primary functional organs, including roots (adsorption), stem (mechanical stability), leaves (energy capture) and flowers (reproduction), and its dynamics may be explained as allometric adjustments related to the size of the plant (Metabolic scaling theory, Reich 2002), adjustments to environmental stresses or constraints (Optimality theory, Reich 2002) or as a result of a genetically determined "development plan" shaped by past environmental conditions during the evolution of the species (Ontogenetic drift, Evans 1972, Coleman et al. 1994, Reich 2002). Of course, one explanation does not exclude the other; indeed, it is likely that all three processes play a role.
The proportions may change during development (Poorter et al. 2012). Notably, the biomass apportioned to reproduction increases with time, generally at the cost of other organs. However, studies of biomass allocation in herbs in the reproductive state are generally avoided, due to complications in the analysis (Poorter et al. 2015). But in several comparisons between congeners, weedy species had a greater reproductive output (Gadgil & Solbrig 1972, Gaines et al. 1974).
In this study, we explore whether rapid growth, flowering precocity, and allocation (biomass distribution) to reproduction are positively related to weediness; we also analyzed some data on germination velocity documented during the production of seedlings. In a common garden experiment, we used four species of Melampodium L. (M. americanum L., M. divaricatum (Rich.) DC., M. microcephalum Less., and M. tepicense B.L. Rob.) as models. The relative weediness of these species, expressed as a synanthropy index, had been established previously, based on their habitat preferences according to herbarium and field data (Hanan-A et al. 2016). M. divaricatum was the weediest species with an index value of 1.76, followed by M. americanum (1.64), M. microcephalum (1.59) and M. tepicense (1.13). We expected a correlation of the traits with the index.
Materials and methods
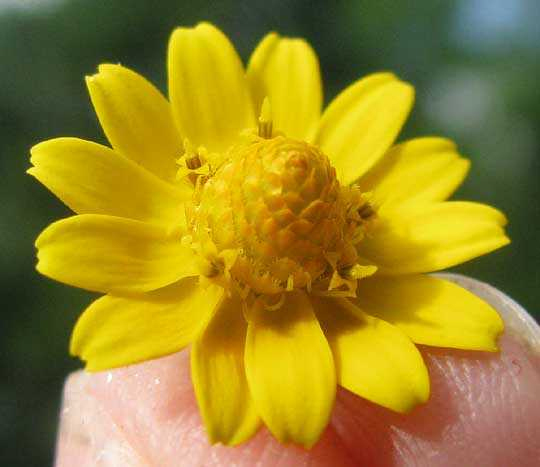
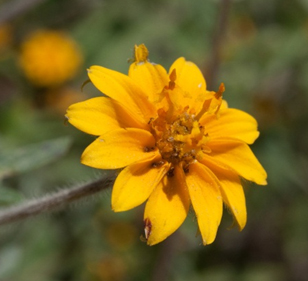
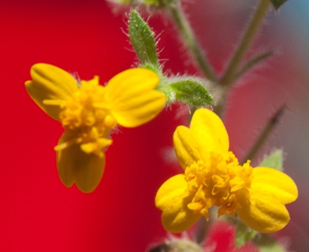
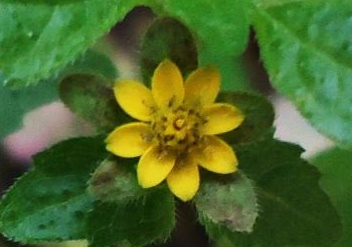
The genus. Melampodium (Asteraceae) consists of 40 species, mostly erect or decumbent annual herbs. Only the ligulate flowers (3-13) are fertile; the disc flowers have abortive ovaries and are functionally masculine. The achenes lack a pappus and are enclosed partially or completely by the inner phyllaries.
The native distribution area of Melampodium are the tropical and subtropical regions of Mexico and Central America, with some species reaching the southwestern United States or South America (Stuessy 1972, Blöch 2010). All species have been reported from primary vegetation in Mexico in herbarium specimens; however, it is not always clear if the plants were growing in the primary vegetation or in some disturbed place, such as roadsides, within the primary context. All have ruderal populations (i.e., in habitats disturbed frequently, but irregularly by humans); about one third are able to grow in cultivated fields. Several of the weedy species are now distributed in a much wider area and may be invasive; some are cultivated as ornamentals.
The taxonomy and phylogeny of the genus are well studied; the karyotypes and various events of species formation through allopolypoidy are documented (Stuessy 1971, 1972, Stuessy et al. 2004, Blöch 2010). The genus has been widely collected in Mexico, and specialists have reviewed the specimens at the major herbaria (T. Stuessy; in Mexico: J. L. Villaseñor). This makes the group particularly well-suited for the study of weed characteristics.
Species selection and weediness categories. We selected four species (M. americanum, M. divaricatum, M. microcephalum, and M. tepicense) with different levels of weediness (Hanan-A et al. 2016) and whose seeds were available. They represent four of the six sections of the genus (Blöch 2010, Stuessy et al. 2011) and are diploid annual herbs; M. americanum may have a perennial habit, though in the study area it tends to be annual (Stuessy 1972). The relationship between these species is (M. americanum (M. microcephalum (M. divaricatum M. tepicense))), as documented by the phylogeny of the genus (Blöch et al. 2009).
Previous fieldwork, consisting of a systematic search for Melampodium populations, as well as data from herbarium specimens, yielded a relative quantification for the degree of weediness of the studied species (synanthropy index; see Table 1 for the values). The index was based on the proportion of populations found in primary, ruderal or agrestal habitats (Nuorteva 1963, Hanan-A et al. 2016).
Table 1 The Melampodium species selected for this study, in descending order according to their degree of weediness or synanthropy. The following data are shown: synanthropy index (Hanan-A et al. 2016), habitat, general distribution, altitude, flowering period (Robinson 1901, Stuessy 1972), and the localities where the seed was obtained.
|
|
|
|
|
|
|
|
21° 03’ 51.8”/ 104° 13’ 17.6” |
|
|
|
|
|
|
The biological material was obtained in the Mexican federal state of Nayarit. Fourteen Melampodium species are reported from this state (Stuessy 1972, Ortiz et al. 1998), including one of the most geographically restricted species, Melampodium tepicense. It has 60 % of its distribution area here.
The open-air common-garden experiment was conducted at the Agricultural Academic Unit of the Autonomous University of Nayarit, municipality of Xalisco, which belongs to the province of the Neovolcanic Transversal Belt. The site (21° 25’ 43” N and 104° 53’ 29” W) is located at 977 m elevation, in a relatively tropical subhumid climate [(A) C (w2)(w); García 1983]; the modelled distribution of all four species overlapped there (Hanan-A et al. 2016).
Germination and growing conditions. The seeds of the four species were collected in the field in October and November 2011; for locations, see Table 1. They were obtained from about 10 individuals of each population, in three locations for each species; only M. americanum was collected at a single site as we did not find other fertile populations. The seeds were kept at room temperature for six months, and then refrigerated in paper bags and hermetic plastic containers until they were used in September of 2013.
The seeds used in the experiment were taken randomly from the collections. Seed weight was not recorded, as the cypselae are partially fused with a phyllary, which introduces much variation. After some preliminary experiments, 150 seeds of each species (only 100 for M. americanum) were germinated in Petri dishes on moist cotton and filter paper, at room temperature and with natural light, for two weeks, initiating on September 28, 2013. Average daily temperatures were not available for the Tepic weather station for that time, but daily minimum/maximum/average temperatures are about 17/29/22-24 °C in the germination period, with day lengths of a few minutes less than 12 hours (Servicio Meteorológico Nacional 2020).
Five days after radicle emergence of the first seeds, October 3rd, the germinated seeds were transplanted into germination trays with a sphagnum peat moss substrate. This substrate was chosen because it is controllable, without weed seeds and unexpected chemicals, and suitable for this kind of experiment (Cabrera 1999, Juárez-Rosete et al. 2020). They were irrigated daily for 37 days. Then, 60 plants of each species, chosen for similar size, were transplanted into 4 L plastic bags for hydroponic cultivation, with a growing medium consisting of a mix of sphagnum peat moss and perlite in a ratio 50:50. They were irrigated daily with a 20 % Steiner nutrient solution (in pilot experiments with 80, 60 and 40 % solutions, the plants showed symptoms of toxicity caused by the nutrients).
Each species was grown under two treatments: 30 plants in full sun and 30 plants under a 50 % shade net. The reason for these two conditions was that in nature, one of the species, M. tepicense, grows mostly in the shade. The plants were kept in blocks by species and treatment. The experiment was established on 9 November 2013 and was terminated when the roots of the largest species started coiling on the wall of the plastic bags (18 January 2014), so the effects of root space restriction would not influence the results (McConnaughay & Bazzaz 1991, NeSmith & Duval 1998). All individuals were flowering at this time. Daily minimum/maximum/average temperatures are about 17/30/21 °C in November, 13/29/19 °C in December and 10/27/18 °C in January (Servicio Meteorológico Nacional 2020).
Recorded data. After introducing the seeds into their germination environment, germinated seeds with a visible radicle were counted every day for the first five days. From these data, the germination rate and percentage were calculated (Maguire 1962). Plant age in this paper is always given from the day of placing the seeds into the Petri dishes on September 28, 2013 (referred to as "planting" or "seed planting" hereafter).
To study growth rates and biomass allocation, five randomly selected individuals of each species were destructively harvested at 57 (t1), 72 (t2), 86 (t3), 97 (t4) and 112 (t5) days after planting. Each plant was carefully extracted from its bag, submerged in water and gently shaken, to eliminate the substrate without damaging fine roots. The plants were separated into leaves, stem and peduncles, roots, and inflorescences (without peduncles), and dried in paper bags at 70 °C for 72 h. The dry mass was then measured with an analytical balance (sensitivity: 1/1000 g). The masses of these individual parts were summed to obtain the total dry mass (TDM).
The relative growth rate (RGR) was calculated from the first and last harvest, and for each interval between harvests (between first and second: I, second and third: II, third and fourth: III and fourth and fifth: IV, periods hereafter). We employed the classic formula ([RGR = (ln TDM2 - ln TDM1) / (t 2 - t 1)], Hunt 2003). Using the method of Cain and Ormrod (Poorter & Lewis 1986), we analysed the covariance of the total dry mass transformed into its natural logarithm. Therefore, the values derived from the sum of squares of the interaction of species and time equal the RGR. To obtain the distribution or allocation of biomass, we calculated the proportions of leaves, stem, roots and inflorescences of the total dry masses for each of the five harvests (Poorter et al. 2012).
The plants were observed daily to record the first appearance of flower buds. The number of heads was counted on a random subsample of 12 plants per species at the age of 52 days after planting.
Statistical analyses. R statistical language (R Development Core Team 2012) was used for the statistical analyses. To assess the best potential statistical models for the analysis of the growth and biomass allocation, we first did a graphical data exploration (Zuur et al. 2010). For all models, the normality of the residuals and the homogeneity of variance were checked graphically (Crawley 2013). To exclude errors due to the possible loss of fine roots during cleaning, all tests were run with and without roots. We found no significant differences, so the root data were included.
The effects of species (M. divaricatum, M. americanum, M. microcephalum and M. tepicense), treatment (sun or shade) and the interaction between these factors on the natural logarithm of total dry mass were explored with an ANCOVA; the harvests were used as covariable. The ANCOVA was run for each period (four periods and total duration of experiment). Analyses outliers were searched for with box plots (Zuur et al. 2010) and excluded (Poorter 1989). When differences between the levels of a factor were found, they were explored with a posteriori contrast (gmodels library, Warnes et al. 2015).
To test for differences in total dry mass and the four mass fractions, linear mixed effects models were used (nlme library, Pinheiro et al. 2012). The species, the treatment (sun or shade) and harvests (five) were used as fixed factors, and all two-way interactions between these factors were included. The individual plants nested to species were part of the random component of the models, given that individual species were placed into blocks. Therefore, we could explain some of the total variation in the response variables by differences between blocks and thus reduce the residual variation. The models were adjusted by restricted maximum likelihood (LME). The differences between the levels of a factor (i.e., species, harvests or their interactions) were explored with a posteriori contrast (gmodels library, Warnes et al. 2015).
A Spearman correlation was used to examine the relationship between the relative growth rate, total dry mass and the mass fractions with the synanthropy index. Correlations were calculated for the medians of each variable and the synanthropy index of each species, and separately for: 1) the relative growth rate, 2) the duration of the experiment, 3) each interval, and 4) each dry mass fraction at each harvest.
Results
Germination. The seeds of the four species selected for this study started germinating on the first or second day. All seeds with an emerged radicle grew into seedlings that survived to 37 days.
The proportion of germinated seeds varied between 100 % for the weediest species (M. divaricatum) and about half for M. microcephalum (Figure 1). The differences between the proportions of germinated seeds were statistically significant, both for germination per day and for total germination (χ2 test of independence; χ2 = 292.46 > χ2 0.05,12 = 21.03; χ2 = 161.24 > χ2 0.05,3 = 7.81).
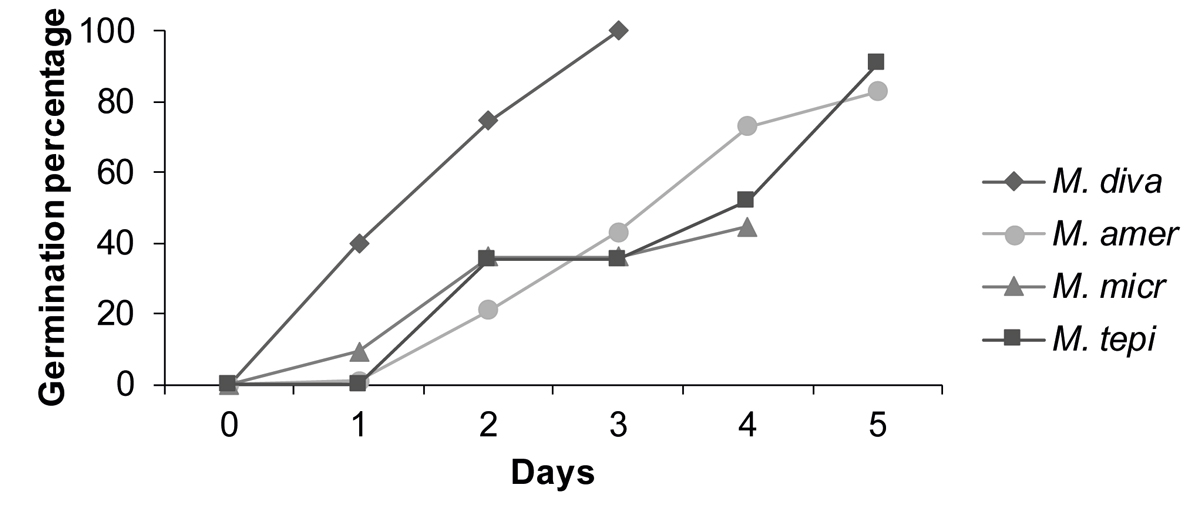
Figure 1 Germination percentage and rate of the four species of Melampodium, as indicated by radicle emission. The figure shows the proportion of seeds germinating in the five days after placing them in petri dishes to germinate. M. diva: Melampodium divaricatum; M. amer: M. americanum; M. micr: M. microcephalum; M. tepi: M. tepicense. Species are ordered from most to least synanthropic (M. divaricatum - M. tepicense, respectively).
All Melampodium divaricatum seeds germinated within three days (GP = 100 %); its germination rate (GR = 65.8) was twice that of the other species (Figure 1) (M. americanum GP = 83 %, GR = 27.8; M. microcephalum GP = 45 %, GR = 24.8; M. tepicense GP = 91 %, GR = 29.6). No seeds germinated after the fifth day. More than half of the five-day-old seedlings of M. divaricatum had branched roots; half of the M. microcephalum seedlings reached this mark at eight days. The first leaves were observed seven days after planting in all four species.
Growth rates. We found differences in the relative growth rate (interaction of species and time equal the RGR) only for the second growth period (of four, Supplementary Material Table S1). There were no growth rate differences between individuals growing in full sun compared to those grown in 50 % shade (Supplementary Material Table S1).
M. tepicense, the least weedy species, had the highest relative growth rate for the entire experiment of 55 days (Figure 2A). M. divaricatum and M. microcephalum had a significantly lower rate, and M. americanum was intermediate (Figure 2A). M. microcephalum grew significantly less during the second period, when all other species had stronger growth (Figure 2B).
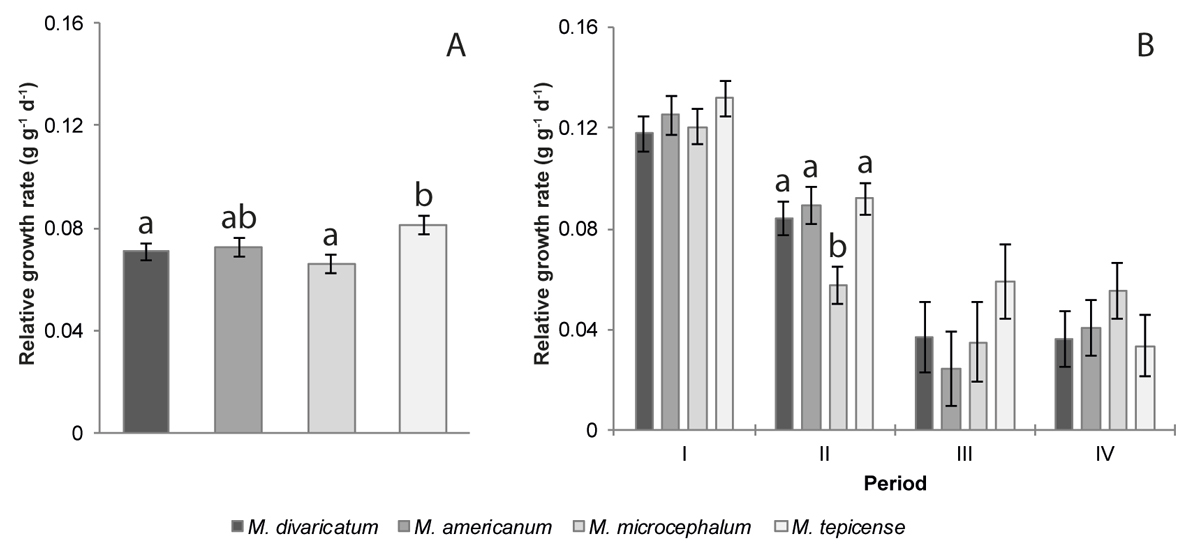
Figure 2 Relative growth rates for the four species of the genus Melampodium, calculated (A) for the duration of the experiment (57- to 112-day-old plants) and (B) for each period. I: 57 to 72 days old, II: 72 to 86 days old, III: 86 to 97 days old, IV: 97 to 112 days old. Means ± standard errors are given without data transformation, different letters indicate significant differences in species growth rate, only for those periods for which significant differences were found. Species are ordered from the most to the least synanthropic (M. divaricatum - M. tepicense, respectively).
The highest growth rate for all species occurred during the first period (I, Figure 2B). In the periods II and III the growth rate declined and then stabilized (M. tepicense and M. divaricatum) or increased in the last period (IV) (M. americanum and M. microcephalum).
However, when comparing relative growth rate of each species with total dry mass (or size of the plants) instead of their age, the tendencies differed substantially (Figure 3; for the same data, but vs. time, Supplementary Material Figure S1). Here, the decline in growth rate was steadier, but M. divaricatum and M. microcephalum had a lower rate of decline and a higher growth rate at equivalent sizes.
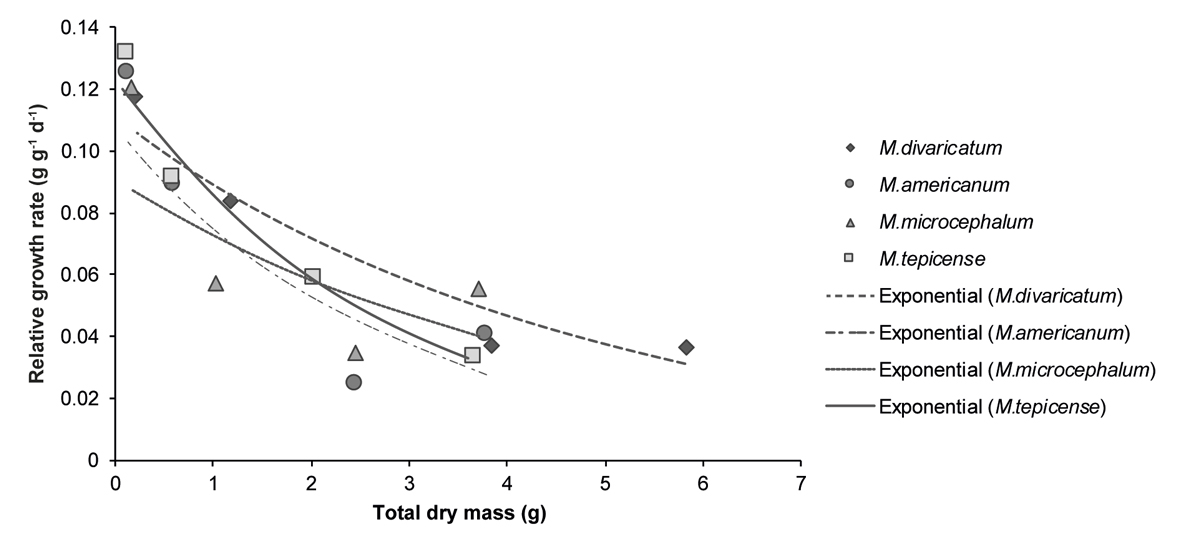
Figure 3 Relative growth rates for each of the four time periods between the five successive harvests vs. total dry mass (average values measured from the first to the fourth harvest) of the four species of the genus Melampodium. In the legend the species are presented from the most to the least synanthropic (M. divaricatum - M. tepicense, respectively).
Flowering. The species differed in flowering precocity. The first floral buds were observed 33 days after planting in M. microcephalum, at 42, 46 and 48 days in M. divaricatum, M. tepicense and M. americanum respectively. Two weeks after transplant, that is, 52 days after planting, all M. microcephalum individuals had flowers, most with three heads, and 42 % of the individuals had immature fruit. At the same time, the other species did not yet have fruit, had a maximum of two heads, and some individuals did not yet have any (Figure 4). The χ2 independence test (χ2 = 41.29 > χ2 0.05,9 = 21.03) suggests that the differences were significant.
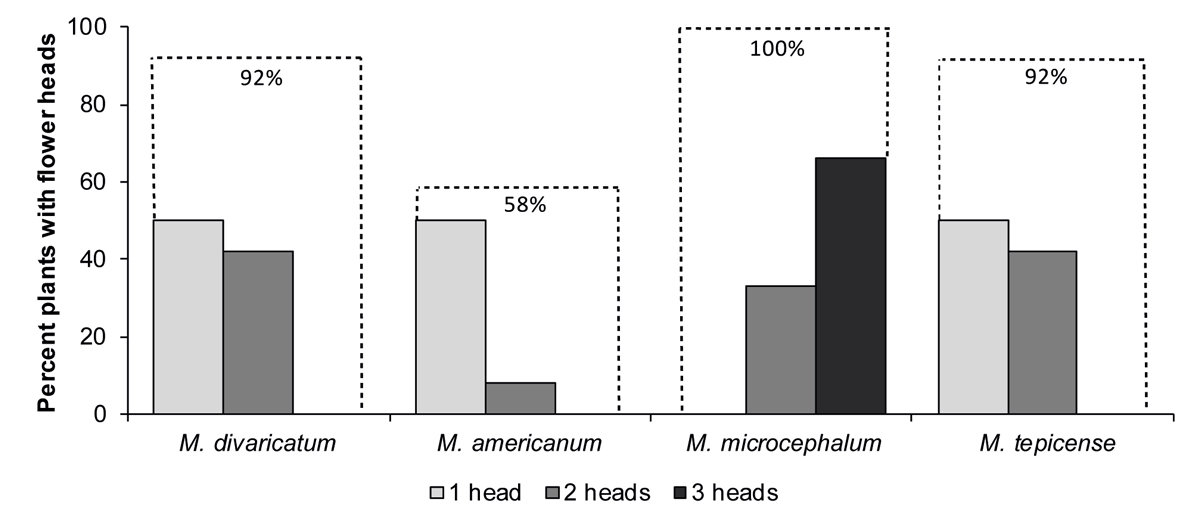
Figure 4 Percentage of plants with 1-3 flowering heads two weeks after transplant (52 days after seed planting). The dotted line indicates the accumulated percentage. M. diva: Melampodium divaricatum; M. amer: M. americanum; M. micr: M. microcephalum; M. tepi: M. tepicense. Species are ordered from most to least synanthropic (M. divaricatum - M. tepicense, respectively).
Resource distribution. Total dry mass production differed significantly between harvests, species, treatments and the interaction species-time (Table 2). M. divaricatum produced significantly more biomass than the other three species (Figures 5A and 6). Additionally, there was an interaction between the covariable (TDM) and time. The four mass fractions (leaf, stem, root and flowers) also differed between species (Table 2). M. americanum and M. tepicense had the highest proportion of leaf mass; M. divaricatum and M. microcephalum produced relatively more stem, M. tepicense more roots and M. microcephalum more flowers (Figure 5 B). The relative proportion of stems increased and that of leaves declined over time, whereas the proportion of flowers, as expected, increased. The root fraction was relatively stable in the five harvests (Figure 5 D). Plants growing in the shade allocated slightly more resources to leaves and less to roots compared to plants growing in sun (Figure 5 C).
Table 2 Statistical summary of the linear mixed-effect models for the four species of the genus Melampodium and two treatments (sun and shade), five harvests (time), and the double interactions. TDM: total dry mass; LMF: leaf mass fraction; SMF: stem mass fraction; RMF: root mass fraction; FMF: flower mass fraction; df: degrees of freedom; F- *: P < 0.05; **: P < 0.01; ***: P < 0.001.
| Source of variation | TDM (g) | LMF (g g-1) | SMF (g g-1) | RMF (g g-1) | FMF (g g-1) | ||
|---|---|---|---|---|---|---|---|
| df | F | F | F | F | df | F | |
| TDM | 1,156 | 9.87** | 881.85*** | 378.89*** | 9.87** | 1,133 | 179.08*** |
| Time | 4,156 | 2.79* | 16.6*** | 5.25** | 2.79* | 4, 133 | 6.77*** |
| Species | 3,156 | 133.32*** | 43.20*** | 124.47*** | 133.32*** | 3, 133 | 33.32*** |
| Treatment | 1,156 | 14.67*** | 4.57* | 0.65 | 14.69** | 1, 133 | 0.27 |
| TDM:Time | 4,156 | 9.21*** | 2.73* | 4.44** | 9.21*** | 4, 133 | 2.02 |
| TDM:Species | 3,156 | 0.48 | 5.40** | 6.15** | 0.48 | 3, 133 | 0.27 |
| TDM:Treatment | 1,156 | 1.36 | 0.19 | 0 | 1.36 | 1, 133 | 0.82 |
| Time:Species | 12,156 | 2.42** | 1.7 | 2.51** | 2.42** | 12, 133 | 1.44 |
| Time:Treatment | 4,156 | 0.99 | 0.89 | 0.17 | 0.99 | 4, 133 | 1.09 |
| Species:Treatment | 3,156 | 0.44 | 0.67 | 0.57 | 0.44 | 3, 133 | 1.01 |
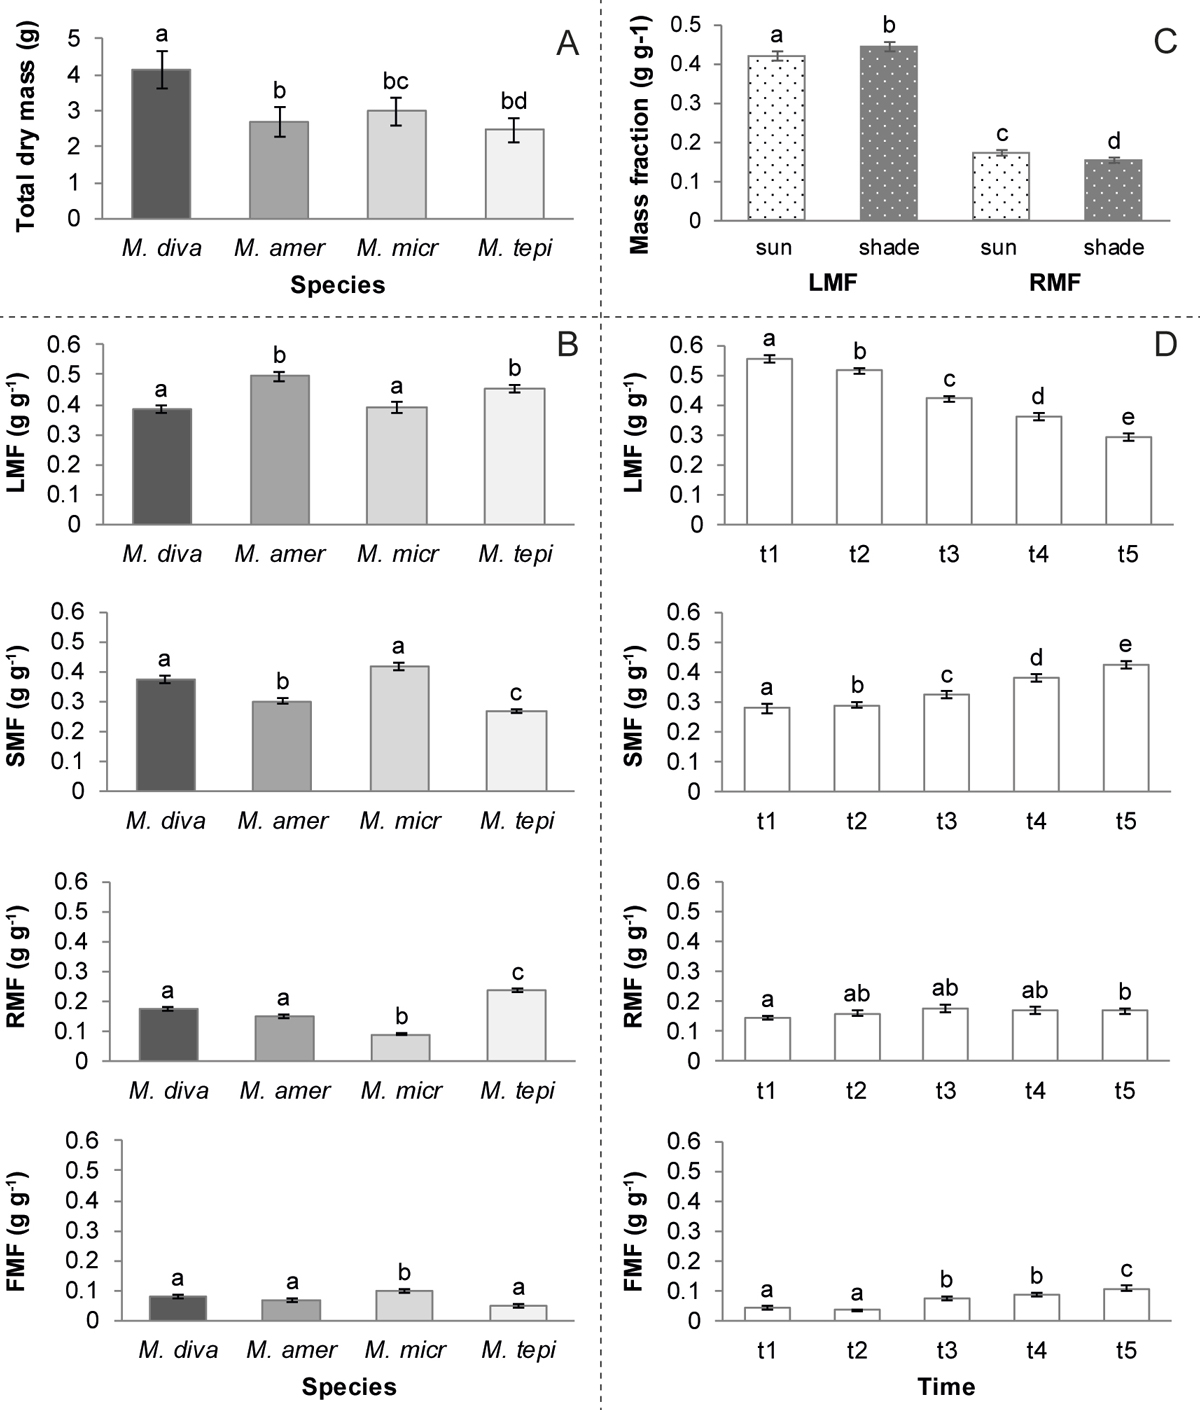
Figure 5 Biomass production and allocation of the four Melampodium species during the 112 days (16 weeks) of the experiment. (A) total dry mass per species, (B) fractions of dry mass per species, (C) by treatment and (D) in each of the five harvests. TDM: total dry mass; LMF: Leaf mass fraction; SMF: stem mass fraction; RMF: root mass fraction; FMF: flower mass fraction; M. diva: Melampodium divaricatum; M. amer: M. americanum; M. micr: M. microcephalum; M. tepi: M. tepicense. Means ± standard error, different letters indicate significant differences between species or time to harvest. Species are presented in order from the most to the least synanthropic (M. divaricatum - M. tepicense, respectively).
Only stems, roots and total dry mass differed in the allocation for the interaction species-time. There were no significant differences for the other interactions (species-treatment and time-treatment, Table 2). The lowest relative root mass was found in M. microcephalum in all harvests (Figure 6).
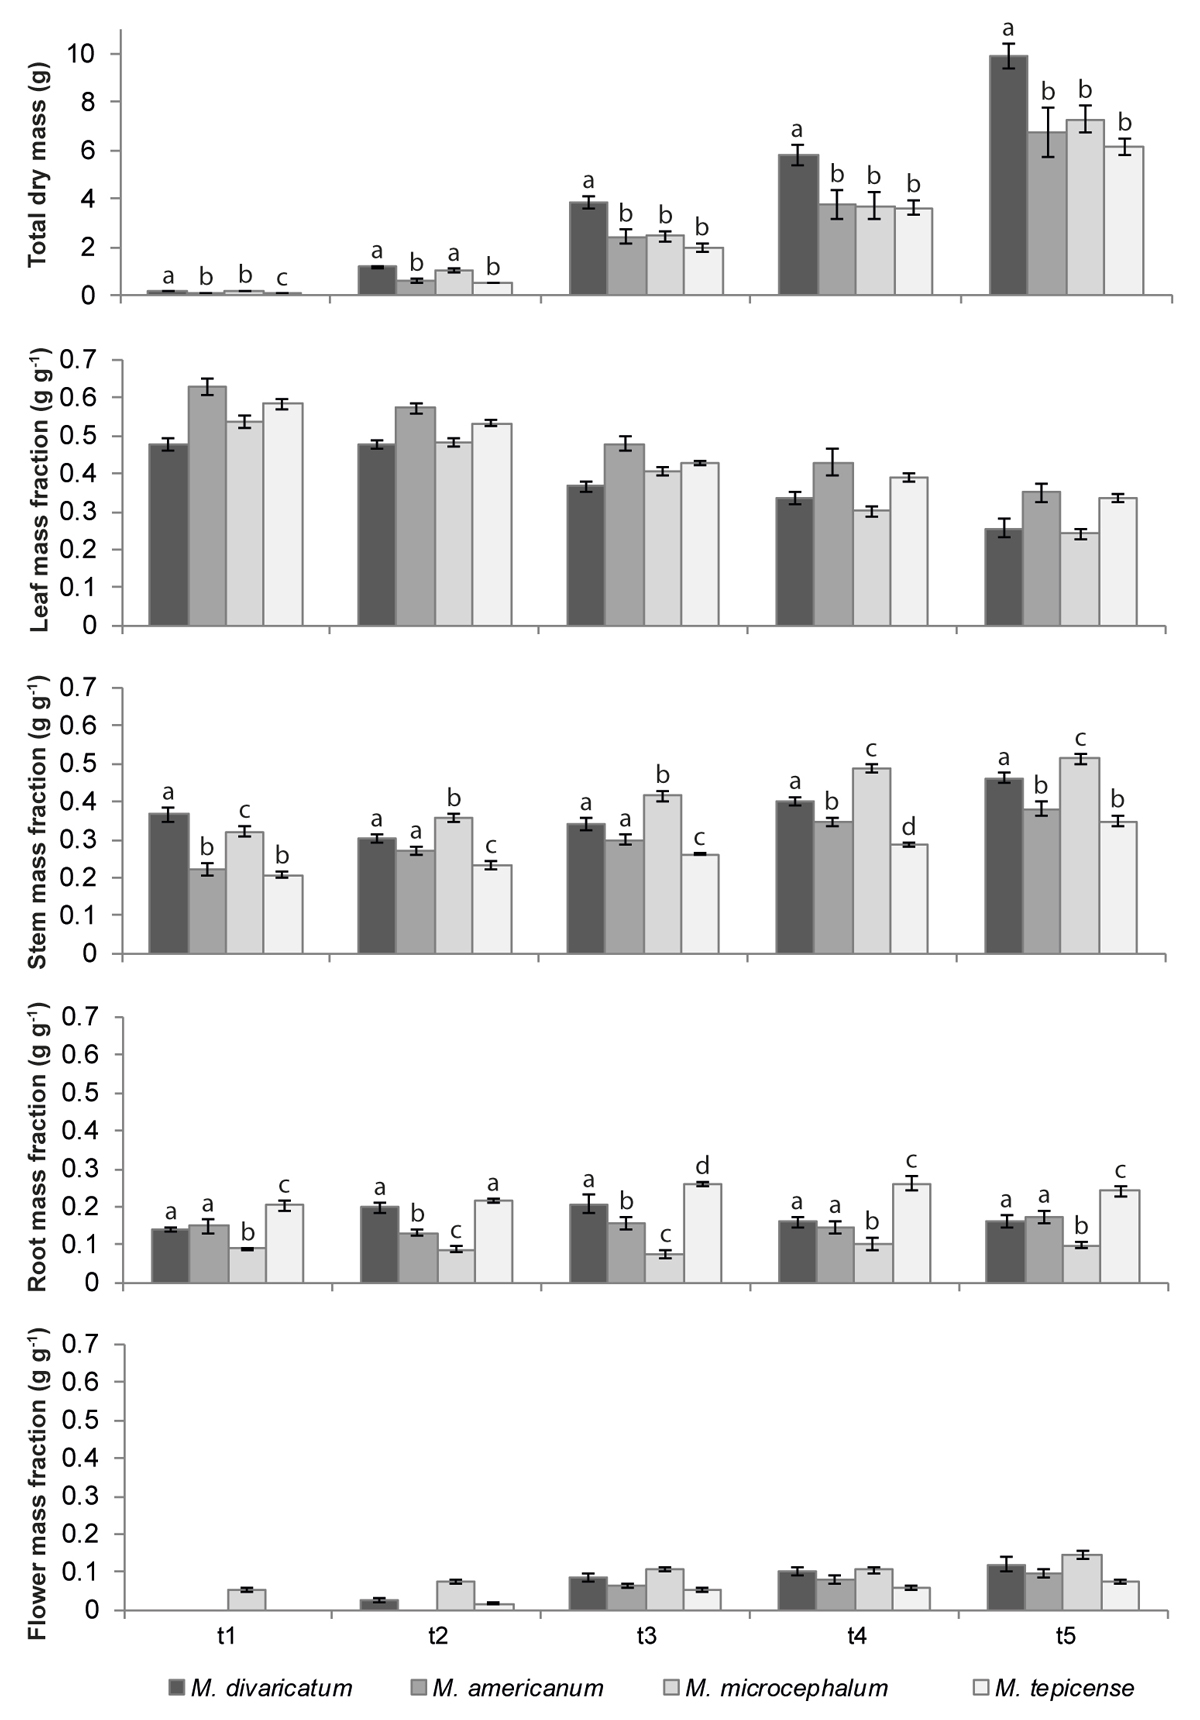
Figure 6 Total dry mass and mass fractions of leaves, stems, roots and flowers of four Melampodium species, measured at five harvests. t1: 57 days after planting; t2: 72 days; t3: 86 days; t4: 97 days; t5: 112 days. Different letters indicate significant differences in total dry mass and stem or root fractions between species at each point in time; absence of letters indicates that there were no significant differences in the species-time interaction. Means ± standard are presented. Species are ordered from the most to the least synanthropic (M. divaricatum - M. tepicense, respectively).
Around the time of the third harvest, the stem fraction overtook the leaf fraction in both M. divaricatum and M. microcephalum (Figure 6). This same tendency is noticeable in all four species if we relate the mass fractions of each organ to the total dry mass, that is, when we compare them by size instead of age (see the comparison in the Figure S2 in the Supplementary material).
Correlations with weediness (synanthropy index). The correlation analysis (Table 3) showed no correlation between weediness (measured by their synanthropy index, Table 1) and their relative growth rate, total dry mass or the fractions (leaf, stem, root, flower) - not for the duration of the experiment nor for one of the periods.
Table 3 Relationship between weediness (synanthropy index) and the median of growth and biomass allocation parameters. The correlation was tested for their association with Spearman's correlation coefficient, for the whole growth period, for periods and for harvests in the four species of the genus Melampodium growing in the sun and shade. RGR: relative growth rate; TDM: total dry mass; LMF: leaf mass fraction; SMF: stem mass fraction; RMF: root mass fraction; FMF: flower mass fraction; rho: I: 57 -72-days after planting; II: 72-86; III: 86-97; IV: 97-112; t: whole time of the experiment; 1-5: time to harvest (57, 72, 86, 97, 112 days respectively).
| Synanthropy index | vs | RGR | RGR | RGR | RGR | RGR | LMF | LMF | LMF | LMF | LMF | SMF | SMF | SMF |
| I | II | III | IV | t | 1 | 2 | 3 | 4 | 5 | 1 | 2 | 3 | ||
| S | 18 | 14 | 14 | 8 | 14 | 14 | 14 | 14 | 10 | 10 | 2 | 6 | 6 | |
| rho | -0.8 | -0.4 | -0.4 | 0.2 | -0.4 | -0.4 | -0.4 | -0.4 | 0 | 0 | 0.8 | 0.4 | 0.4 | |
| P | 0.17 | 0.38 | 0.38 | 0.63 | 0.38 | 0.75 | 0.75 | 0.75 | 1.00 | 1.00 | 0.33 | 0.75 | 0.75 | |
| Synanthropy index | vs | SMF | SMF | RMF | RMF | RMF | RMF | RMF | FMF | FMF | FMF | FMF | FMF | TDM |
| 4 | 5 | 1 | 2 | 3 | 4 | 5 | 1 | 2 | 3 | 4 | 5 | |||
| S | 6 | 6 | 14 | 12 | 12 | 12 | 14 | 10 | 8 | 6 | 6 | 6 | 2 | |
| rho | 0.4 | 0.4 | -0.4 | -0.2 | -0.2 | -0.2 | -0.4 | 0 | 0.2 | 0.4 | 0.4 | 0.4 | 0.8 | |
| P | 0.75 | 0.75 | 0.75 | 0.92 | 0.92 | 0.92 | 0.75 | 1.00 | 0.92 | 0.75 | 0.75 | 0.75 | 0.33 |
Discussion
Germination. This experiment was not primarily directed at studying germination of the species. The data are reported as additional information. They show that the weediest species germinated most rapidly, as expected; however, there was no correlation with the synanthropy index.
Growth rate. Unexpectedly, weediness, as measured by the synanthropy index, was not correlated with relative growth rate in our comparative study of four Melampodium species with different degrees of weediness (Hanan-A et al. 2016). The smallest and least weedy species (M. tepicense) had the highest growth rate, which was significantly distinct from the other three species. For all species, the rate was also higher earlier in the experiment when the plants were smaller, as has been observed previously in other weed species (Hegazy et al. 2005). One possible explanation is that this reflects the differences in size, as the relative growth rate tends to be associated negatively with seed and plant size (Turnbull et al. 2012). Decline of the growth rate was species-specific when it was compared with size (Poorter & Sack 2012), although it was statistically significant only in some of the periods.
Notably, the weediest species maintained higher growth rates for a longer time, thus ending up with a 40 % higher biomass than the other species. Cohen (1976) has noted previously that the organs of weed species produced more biomass and/or their tissues required less maintenance (Cohen 1976) compared with other species. Additionally, the weeds may have adaptations that maintain superior growth levels, apart from those related to seed or plant size, as has been proposed for colonizing species of open habitats (Turnbull et al. 2012).
Time to flowering. We did not find correlation between early flowering and weediness. This is a notable result, as a number of previous studies have found an association of early flowering with weeds, as this assures survival in unpredictable habitats (Sans & Masalles 1995, Hegazy et al. 2005). Interestingly, flowering phenology of invasive plants is influenced strongly - and in contrasting ways - by the climate type in the region of origin (Godoy et al. 2009).
Allocation to reproduction. Our study of biomass distribution was centred on the reproductive stage; all species started flowering before the first harvest. Despite this fact, they still showed the same behaviour as Poorter et al. (2012) found in a meta-analysis of five thousand plant species: an ontogenetic tendency of vegetative herbaceous plants to reduce the leaf mass fraction and increase the stem and root mass fraction; at a certain point stability requires more investment than energy capture.
Each species displayed its own idiosyncratic behaviour (Figures S1 and S2 in the Supplementary material). For example, the least weedy species, M. tepicense, used a relatively large part of its biomass for roots. This may be a consequence of the relatively nitrogen-poor substrate of the experiment, compared with its natural habitat (unpublished data), or of a habit that invests little in stems - the species has short internodes and peduncles.
An interesting feature is the point where the decreasing leaf mass fraction intersects the growing stem mass fraction. This occurs at different ages and sizes in each species (see the comparison in the Figure S2 of the Supplementary material) and could signal a change in the stage of development (Hegazy et al. 2005). It could be associated with reproduction; the species with the earliest flowering (M. microcephalum) is also the earliest to shift its biomass distribution.
We did not study other reproductive factors, such as seed production, germination, dormancy, emergency flows and cohort effects (Radford & Cousens 2000, Li et al. 2015, Lu et al. 2016). These factors should be addressed separately and would require a different experimental design.
General comments. The following table 4 summarizes the results of our study. Contrary to expectations (Baker 1965, 1967, Gadgil & Solbrig 1972, Gaines et al. 1974, Daehler 1998, Sutherland 2004, Kuester et al. 2014), neither relative growth rate, resource allocation to reproduction nor flowering precocity correlated with the degree to which the plants grow in anthropogenic habitats. The observed germination rate followed the same pattern.
Table 4 Hypotheses tested and results.
| Hypothesis tested | Applies to the weediest species (Melampodium divaricatum) | Applies to all species proportionally to their weediness |
|---|---|---|
| Weedier species germinate faster | Yes | No |
| Weedier species have a higher growth rate | No. But M. divaricatum sustains its growth rate for a longer time | No |
| Weedier species flower earlier | No | No |
| Weedier species allocate a higher proportion of resources to reproductive organs | No | No |
Only if we consider the extremes - M. divaricatum as the weediest species, and M. tepicense as the least weedy - we did find some differences. Here, total production of biomass, allocation to stems and flowering precocity are associated with weediness, as well as the observed germination rate. These traits coincide with some of the characteristics of the "ideal weed" of Baker (1965). However, the strong differences observed in the extremes become more complicated when we consider the intermediate species. While M. divaricatum produced flowers four days earlier than M. tepicense, M. microcephalum, the species in third place of weediness, flowered even earlier (9 days before M. divaricatum). Also, it invested more in flowers, a strategy possibly related to its relatively low germination rate, and a shorter flowering and life period (own observations), which is about half as long as that of M. divaricatum. We suggest that this is an adaptation to its habitat in seasonal climates with a long dry period (Matthews & Mazer 2016; however, see the opposite effect in native and invasive populations of Brassica tournefortii, Alfaro & Marshall 2019). It supports a hypothesis derived from life history theory that a shorter life correlates with a higher investment in reproduction (Karlsson & Méndez 2005) and with models that propose that the transition from vegetative to reproductive growth in annuals is abrupt and positively related to the length of the growing season (Cohen 1971). However, it does not explain why M. microcephalum is not more synanthropic than it was found to be, as a short growth period is generally considered a preadaptation to weediness.
In general, our comparison of the four species paints a complex picture in which the species use different strategies and adaptations to survive in their habitat and to adapt to human-caused disturbance. We suggest that the fast germination and sustained growth rate - though not very high at the beginning - shown by the weediest species, M. divaricatum, may be key to the success of this species. Exploring the mechanism for this sustained growth would be informative.
This work adds to other studies that also did not demonstrate expected relationships or found that optimal partitioning may be restrained by life history (McConnaughay & Coleman 1999); the same phenomenon has been found in invasive species (Godoy et al. 2009). As stated by Radford & Cousens (2000): weediness may be essentially unpredictable, “due to habitat/plant specific interactions”. The traditional separation of weeds and non-weeds may be an unhelpful simplification; perhaps weeds should be classified into more categories, depending on the main disturbance of the site (agrestal, ruderal, plantation, etc.). We suggest that in weed evolution, we see both a complex interaction of evolutionary pressures to adapt to different types of disturbance, and the effects of the ecological origins of the species, that is, ontogenetic constraints.

