


 nova página do texto(beta)
 Inglês (pdf)
 Artigo em XML
 Referências do artigo
 Enviar este artigo por email
 Citado por SciELO
  Similares em
SciELO
Similares em
SciELO 
 Permalink
Throughout the Pleistocene (≈ 2.5 Ma), extended blankets of glacial ice covered the highest latitudinal zones of the planet, giving rise to glacial periods, which alternated with interglacial periods, when these areas were partially free of ice (Svensson et al. 2005). The glaciation period had a greater impact on the northern hemisphere biota than on the southern hemisphere given that the large land masses very close to the Arctic could channel the glaciers toward the south, whereas an ocean separated the Antarctic from the southern continents (Svensson et al. 2005). The glacial periods of the Pleistocene also greatly influenced the geographic distribution, the genetic structure and demography of tropical species (Stewart et al. 2010, Ramírez-Barahona & Eguiarte 2013). Some the mountain regions located in the tropics acted as areas of refugium during the cold, dry periods of the Pleistocene for several temperate forest taxa, which recolonized the humid areas farther north during the interglacial periods (Ramírez-Barahona & Eguiarte 2013). These Neotropical refugia might have remained continuously humid, while the savannahs and dry tropical forests expanded, leaving populations featuring high genetic structure in different areas of refugium (Haffer 1969, Graham 1973, Toledo 1982, Myers1982, Pennington et al. 2000). The Holocene was also a period of climatic fluctuations. The Holocene Climate Optimum (9-5 Ka) was a warm period; the global climate was most likely between 0.5-3 °C warmer than it is today. Then the temperatures decreased progressively with cyclic heating/cooling periods until now (Walker et al. 2012).
Tropical forests and their biota have a complex evolutionary history (Ornelas et al. 2013); for example, Dioon edule (Zamiaceae) (González-Astorga et al. 2003) and Zamia paucijuga (Zamiaceae) (Nolasco-Soto et al. 2015) experienced demography changes in their populations influenced by the Pleistocene glaciations. Historic demography changes in plant species could be consistent with either the Glacial Refugium Hypothesis (GRH), which propose that populations contracted to one or more southerly refugia during the cold-dry glacial and expanded out from them in warm-humidity interglacials. This hypothesis is widely accepted for temperate species such as subtropical columnar cacti in the mid latitudes of the Northern Hemisphere (Soltis et al. 2006). In contrast, the Interglacial Refugium Hypothesis (IRH) suggests that in the intertropical open dry vegetation of South America (Caatinga, Cerrado and Chaco biomes), populations of some species contracted to warm and humid refugia during the interglacials and expanded outward under the cold/dry climate of the Ultimate Glacial Maximum (LGM) (≈ 80 Ka) (Cornejo-Romero et al. 2017). Several authors have proposed a refugium theory as the underlying model for glacial and postglacial population dynamics of tropical species during the LGM (Farrera et al. 1999, Ramírez-Barahona & Eguiarte 2013, Cornejo-Romero et al. 2017).
The degree of aridity in the tropics generated by the reduced precipitation during the LGM and its influence on the distribution of the Neotropical forests have been controversial topics (Ramírez-Barahona & Eguiarte 2013). In one of the pioneer publications on the impact of the glaciations of the Pleistocene in the Neotropics, Van der Hammen (1961) postulated two opposing hypotheses: (1) During the glaciations, the lower temperatures generated a reduction in precipitation and, consequently, an increase in aridity in the Neotropics. (2) The cold phases of the glaciations were accompanied by an increase in precipitation, and the warm phases were much drier; therefore, the glaciations did not lead to a reduction in the precipitation and did not significantly affect the continuous and stable distribution of the tropical rainforests (Farrera et al. 1999). However, the information available to date has been based largely on limited and conflicting paleoecological data (Ramírez-Barahona & Eguiarte 2013). In general, the existing records indicate greater tropical aridity, with low lake levels in regions such as tropical Africa (Caballero et al. 1999). These records have been interpreted as an indication that, during the LMG, climates were drier (Kutzbach et al. 1993). In the Trans-Mexican Volcanic Belt, several records of the internal basins suggest greater aridity (Lozano-García et al. 2005, Caballero et al. 2010), while west-central Mexico have been proposed to have had relatively humid conditions (Bush et al. 2009, Bradbury 2000).
During the Last Interglacial periods (120 Ka), the climate of the YPBP became warmer and more humid (Metcalfe et al. 2000). During most of the LGM, the climate of the YPBP was dry, and the temperature was approximately 6 ºC colder than at present. Savannahs and scrublands covered most of the region up to the Early Holocene (10 Ka) (Orellana et al. 2003). In an analysis of Holocene fossil pollen samples from the YPBP, to reconstruct the vegetation and to develop a precipitation record for the last 7,900 years, a gradual increase in precipitation and expansion of the tropical forest during the Middle Holocene was shown (Vela-Pelaez et al. 2018).
Zamia prasina W. Bull. (Zamiaceae), distributed in the tropical rainforests of the central and southeast areas of the YPBP, is the only cycad native to this region. According to the International Union for the Conservation of Nature (IUCN), it is severely threatened (Vovides & Nicolalde-Morejón 2010). The populations of Z. prasina almost certainly were affected by the climate changes of the Pleistocene, which have been proposed as the driving force of the diversification in cycads (Nagalingum et al. 2011). The cycads are a species group with a long evolutionary history originating in the late Permian (Rull 2012). However, molecular data indicate that current species had a more recent origin (Late Miocene, ≈10-5 Ma) (Nagalingum et al. 2011). The almost simultaneous initiation of the diversification of six of the living genera of the cycads (in Australia, Africa, South-east Asia and tropical South America) suggests a single promotor may have been responsible for their diversification and that event may have been global climate change (Nagalingum et al. 2011). The climate fluctuations during the Pleistocene significantly influenced the current distribution of the cycads (González & Vovides 2002) and that, for the cycads of Mexico, the refugium areas of the LGM were fundamental in the definition of their phylogeographic dynamics (Contreras-Medina & Luna-Vega 2002). Consequently, we sought to determine whether the Late Pleistocene-Holocene (80-10 Ka) climate changes affected the historical demography of Zamia prasina and whether the historical distribution of Zamia prasina fits with the scenario proposed by the glacial refugium hypothesis. Thus, if this species underwent a contraction during the glaciations (LGM), then we would expect a reduction in the environmentally suitable area and in the effective size of the population during the LGM. Conversely, the effective size of the population and suitable area would increase during an interglacial period. To answer these questions, we used a phylogeographic approach, Bayesian analysis, and niche model. This study represents one of the first phylogeographic studies in the YPBP. We addressed the following objectives: (1) to determine the genetic diversity and phylogeographic structure of Z. prasina, (2) to evaluate the influence of the climate changes during the Late Pleistocene-Holocene on the historical demography of Z. prasina and (3) to determine whether the climate changes of the Late Pleistocene-Holocene modified the potential distribution range of Z. prasina.
Materials and Methods
Study area, populations and samples. This study was conducted in the Yucatan Peninsula Biotic Province (YPBP), which includes the Mexican states of Campeche, Quintana Roo, Yucatan and part of the states of Tabasco and Chiapas, northern districts of Belize (Orange Walk, Corozal, and Belize) and the department of Peten in Guatemala (Carnevali et al. 2010). The selection of populations sampled was based on information obtained from Herbarium CICY and from previous studies, Velasco (2015). Herbarium vouchers for each population were deposited at Herbarium CICY. We collected samples from 21 natural populations of Z. prasina in the Mexican part of the YPBP and five samples from two populations in Belize (two in Cayo District and three in Belize District) that were donated by Michael Calonje (Montgomery Botanical Center) (Figure 1, Table 1). It was not possible to obtain samples of Z. prasina from Guatemala; therefore, any reference to the YPBP here does not include Guatemala.

Figure 1 Location of the 23 populations of Zamia prasina sampled in the Yucatan Peninsula Biotic Province (YPBP). Biotic Province (YPBP). 1: Valladolid, 2: Peto, 3: Becanchén, 4: Rancho Duarte, 5: Kaxil Kiuic, 6: Champotón, 7: Calakmul, 8: Escárcega, 9: Hormiguero, 10: Virgensita, 11: Tenosique, 12: Palenque, 13: Puerto Morelos, 14: Cobá, 15: Carrillo Puerto, 16: Xhazil, 17: José María Morelos, 18: Pedro A Santos, 19: Bacalar, 20: Pantoha, 21: Nachicocom, 22: Belize-Belize 23: Belize-Cayo.
Table 1 Population, Number of individuals for population (N), latitude, longitude and respective haplotypes for populations of Zamia prasina studied.
| Population | N | N. Latitude | W. Longitude | Haplotype atpF-atpH | Haplotype ITS2 | |
|---|---|---|---|---|---|---|
| 1 | Valladolid | 5 | 20.633342 | -88.343722 | A1 | H1, H2 |
| 2 | Peto | 4 | 20.125567 | -88.980083 | A1, A2 | H1 |
| 3 | Becanchén | 5 | 20.065992 | -89.104694 | A1, A2 | H1, H3, H4, H5 |
| 4 | Rancho Duarte | 4 | 20.028056 | -89.169531 | A1, A2 | H1, H3 |
| 5 | Kaxil Kiuic | 3 | 20.086944 | -89.551528 | A3 | H1, H6 |
| 6 | Champotón | 5 | 19.04675 | -90.405556 | A1 | H1, H3 |
| 7 | Calakmul | 5 | 18.409306 | -89.899444 | A1 | H1, H10 |
| 8 | Escárcega | 5 | 18.617028 | -90.850889 | A1 | H1, H3, H7 |
| 9 | Hormiguero | 3 | 18.359667 | -89.491722 | A1, A3, A7 | H8 |
| 10 | Virgensita | 5 | 18.266389 | -91.554 | A3, A4, A5, A6 | H6 |
| 11 | Tenosique | 5 | 17.591472 | -91.554 | A1 | H1, H3, H9 |
| 12 | Palenque | 5 | 17.539278 | -91.959889 | A1 | H1, H3, H7 |
| 13 | Puerto Morelos | 5 | 20.862083 | -87.035139 | A3 | H1, H3 |
| 14 | Cobá | 5 | 20.499972 | -87.711806 | A1, A3 | H1, H3 |
| 15 | Carrillo Puerto | 4 | 19.501583 | -88.034056 | A1, A3 | H3, H12, H13, H14 |
| 16 | Xhazil | 5 | 19.400417 | -88.092278 | A1, A3 | H3, H8 |
| 17 | José María Morelos | 5 | 19.140333 | -88.594694 | A1, A3 | H3, H8, H15, H16, H17 |
| 18 | Pedro A.Santos | 5 | 18.950778 | -88.178833 | A3, A8 | H3, H8 |
| 19 | Bacalar | 5 | 18.913278 | -88.2325 | A3 | ----- |
| 20 | Panto-Ha | 5 | 18.578861 | -88.454167 | A1, A3 | H8, H11, H12 |
| 21 | Nachicocom | 4 | 18.481778 | -88.787833 | A1, A3 | H8, H12 |
| 22 | Belize-Belize | 2 | 16.998917 | -89.071533 | A1, A3 | H12, H18 |
| 23 | Belice-Cayo | 3 | 17.302667 | -88.488167 | A1, A9 | H12 |
DNA extraction, amplification and sequencing. DNA was extracted from individuals from each population, using the CTAB protocol (Doyle et al. 1987). We amplified the chloroplast intergenic region atpF-atpH and nuclear region ITS2 selected by Nicolalde-Morejón et al. (2011) using the methods of Lahaye et al. (2008) and Baldwin (1992), respectively. These markers were previously used in genetic studies of the genus Zamia. The amplified products were visualized in 1 % agarose, and 110 samples for chloroplast and nuclear regions were sent to in Macrogen 2018 for unidirectional sequencing using the forward primer and Sanger sequencing. The sequences were edited in Sequencher v. 5 (Gene Codes Corp., Ann Arbor, MI, USA) and aligned in the software PhyDE® (Müller et al. 2010) with the multiple alignment tool Muscle, then they were examined manually. For our ITS2 data set, we confirmed that multiple copies were not present for the following reasons: (1) all sequences had a GC content > 65 %, (2) all BLAST results coincided with the number of base pairs for ITS2 sequences for Zamia in GenBank, (3) conserved regions were homologous to ITS2 sequences from Zamia in GenBank, and (4) a few nucleotides differed between our sequences and those in GenBank.
Genetic diversity and phylogeographic structure. The number of haplotypes (k) and nucleotide and haplotype diversities (π and h, respectively) were determined using the DnaSP v.5.10 (Librado & Rozas 2009); indels were not considered. The genetic diversity was determined for each DNA region, population, population groups (based on genetic differences) and specie (all populations). The genetic structure was determined by means of a non-hierarchical molecular analysis of variance (AMOVA) with 1,000 permutations, using paired genetic differences with the program Arlequin 3.5 (Excoffier et al. 2005). To infer the phylogeographic structure, the relationship of N ST/G ST was calculated. Both are estimators of genetic structure; N ST considers the nucleotide differences among the haplotypes, whereas G ST is based on the number of haplotypes and their frequency. The statistical analysis was performed in the PERMUT 2.0 program (Pons & Petit 1996) with 1,000 permutations where, if 5 % of the permuted values are lower than the N ST observed, then N ST > G ST, thereby indicating phylogeographic structure. The relationships among the haplotypes were determined through haplotype networks using the TCS network algorithm in the PopArt 1.7 program (Clement et al. 2002). This network shows the relationship among the haplotypes and the number of mutational steps separating them. In addition, the geographic distribution of the haplotypes was represented on a map to graphically record the aggregation of the haplotypes.
To confirm the existence of population groups genetically differentiated, an analysis was conducted to detect the geographical location of genetic discontinuities among the populations using Monmonier’s maximum difference algorithm implemented in the program BARRIER (Manni et al. 2004). From the pairwise genetic distances obtained in Arlequin 3.5 (Excoffier et al. 2005), BARRIER identifies the edges where there are greater genetic distances. For obtaining confidence levels for the barriers, 100 replicas of the genetic distance matrix were calculated using Program R ver 4.3.2.
To explore the influence of climatic variables on the genetic structure, a principal component analysis (PCA) was carried out using data for 19 environmental variables, derived from temperature and precipitation, obtained from WorldClim Global Climate Data V. 1.4 (http://www.worldclim.org/version1) (Hijmans et al. 2005) with a resolution of 1 km2. Any enviromental variables with a Spearman’s rank correlation higher than 0.8 between them were not used. A final set of 11 environmental varibles was extracted for the 23 populations of our study (Appendix 1): Mean Diurnal Range (Mean of monthly (max temp - min temp)) (BIO2), Isothermality (BIO3), Temperature Seasonality (BIO4), Max Temperature of Warmest Month (BIO5), Temperature Annual Range (BIO7), Mean Temperature of Coldest Quarter (BIO11), Annual Precipitation (BIO12), Precipitation Seasonality (BIO15), Precipitation of Driest Quarter (BIO17), Precipitation of Warmest Quarter (BIO18) and Precipitation of Coldest Querter (BIO19). Past software version 3 was used (Hammer et al. 2001).
Estimate of divergence times. The time of divergence for intraspecific diversification of Zamia prasina and a possible relationship with pre-Pleistocene and Pleistocene events was estimated using Bayesian inference (BI) implemented by the program BEAST 2 (Bouckaert et al. 2014). The model of sequence evolution HKY+G was employed for both regions according to the results of the AIC model selection from jMODELTEST (Posada 2008). An uncorrelated relaxed clock Log Normal model (UCLD) and a coalescent model assuming constant size were used to model the tree prior. The tree was calibrated using the 95 % highest posterior density (HPD) age reported by Calonje et al. (2019). Prior distributions for all calibrated nodes were conservatively set to uniform using the minimum and maximum age bounds outlined below.
The age intervals for divergence between Microcycas calocoma and Zamia genus was used for the tree root node (33 to 84.5 Ma) (I), the crown node of Zamia (9 to 22.1 Ma) (II). Divergence between Zamia prasina and Zamia variegata Warsz. (0 to 0.82 Ma) (III) and the divergence between the clades formed by Z. prasina plus Z. variegata and the clade Z. spartea Ac.DC. plus Z. furfuracea Aiton plus Z. loddiguesii Miq. (0.51 to 1.53 Ma) (III). Twelve species (i.e., Microcycas calocoma, Zamia variegata, Z. furfuracea, Z. paucijuga, Z. loddigesii, Z. spartea, Z. lacandona, Z. pseudoparasitica, Z. manicata, Z. inermis, Z. soconuscensis, Z. fischeri, were chosen as outgroups.
For divergence time estimations, Markov chain Monte Carlo (MCMC) were run for three independent 50 million generations, sampling every 5,000 generations. BI analyses were run using the CIPRES Science Gateway (Miller et al. 2010). We combined the log and trees files from each independent run using LOGCOMBINER 1.8.0 (Drummond & Rambaut 2007), then viewed the combined log file in TRACER 1.6 to ensure that effective sample sizes for all priors and the posterior distribution were > 200, making sure that parameter values were fluctuating at stable levels. Based on these results, the first 5,000 trees were discarded as burn-in, and the remaining samples were summarized as a maximum clade credibility tree with mean divergence times and 95 % highest posterior density (HPD) intervals of age estimates in TREEANNOTATOR. Finally, these results were summarized in a single tree visualized in FIGTREE ver 1.3.1 (Rambaut 2009).
Historical demography. The demography processes were analyzed at two levels: (1) species and (2) population groups. Three types of analyses were carried out. (1) Tajima’s D (Tajima 1989) and Fu’s F S (Fu 1997): neutrality tests were used to detect departures from a constant population size under the neutral model. Population growth was indicated by significant negative values (p < 0.05) using Arlequin with 10,000 permutations. (2) Mismatch distribution of pairwise nucleotide differences (Rogers & Harpending 1992) was calculated and compared with expected values for an expanding population using the Ramos-Onsins & Rozas (2010)R 2 statistic. This statistic considers the sample size, the number of singleton mutations in a sequence, the average number of nucleotide differences between two sequences, and the total number of segregating sites. Lower values of R 2 (< 0.05) are expected under a recent population growth event (Ramos-Onsins & Rozas 2010). A unimodal type graph shifted to the left indicates many comparisons where the differences between pairs of sequences are small, suggesting a recent expansion in the populations this was carried out in the program program DnaSP 5.10 (Librado & Rozas 2009) with 10,000 permutations. (3) Bayesian skyline plot (Drummond & Rambaut 2007) to infer the changes of the effective population size over time, allowing the use of mutation models and independent replacement rates for each region of DNA. The model HKY+G was used for both DNA regions, with a strict molecular clock model and coalescent model. This analysis was performed at three levels: 1) each DNA region, 2) species and, 3) populations groups. The number of substitutions per site per year (s/s/y) for atpF-atpH was 0.00056 and 0.00181 for ITS2 and were used to date the crown radiation of Zamia paucijuga (Nolasco-Soto et al. 2015), also published by Nagalingum et al. (2011) for the crown-age of Zamia spp. Thirty million permutations (MCMC) were carried out, and trees were collected every 3,000 generations, using the program BEAST ver 1.8.0. Outputs were visualized with TRACER ver 1.6 to assess stationarity of the MCMC (effective sample sizes > 200).
Potential distribution. The ecological niche of Zamia prasina was modelated based on 80 occurrences obtained from the Global Biodiversity Information Facility (GBIF, http://data.gbif.org/species/browse/taxon/) and 103 occurrences compiled from fieldwork. Duplicates ocurrences and ocurrences with a distance < 20 km among them were removed using the package spThin (Lammens et al. 2015) to reduce overfitting promoted by spatial aggregation of the occurrence. A total of 43 records were used. The same 11 environmental variables that were used for the PCA were used for the Ecological Niche Modelling (ENM). The 11 bioclimatic variables were masked to extend of ecoregions (WWF 2006) were Z. prasina occurrence exist as hypothesis of the accessible area (M).
The niche of Z. prasina was modeled using the maximum entrophy algorithm in MAXENT v. 3.3.3 (Phillips et al. 2006) with 100 replicates using bootstrapping as a resampling method with no extrapolation and no clamping. For model evaluation 20 % of the total records were used. Logistic output was selected to obtain maps with suitability values. The ENM was projected in the YPBP and Central America, a center of diveristy for the genera Zamia. The minimum training presence was used as threshold to obtain a binary map of presence-absence. Finally, the ENM obtained was transferred into three past climatic scenarios: the Last Interglacial (LIG ≈ 120 ka), the Last Glacial Maximum (LGM ≈ 21 ka) and the Middle Holocene (MH ≈ 6 ka). Two general models of global circulation (GCM, http://www.worldclim.org/paleo-climate1) were employed to transfer the ENM into the LGM and MH scenarios: the Community Climate System Model (CCSM, Collins 2004) and the Model of Interdisciplinary Research on Climate (MIROC, Hasumi & Emori 2004). Both models simulate the climatic conditions in the LGM and MH, with a stronger reduction in the temperature assumed in the CCSM model in comparison with the MIROC model (Otto-Bliesner et al. 2007).
Results
We analyzed 102 sequences of the atpF-atpH region, with a length of 462 bp and 90 sequences of the ITS2 region, with a length of 301 bp. For atpF-atpH, 23 populations were analyzed. For ITS2 one population was excluded because its sequences coincided with an endophytic fungus.
Genetic diversity. The genealogical relationships indicated that, for atpF-atpH, the most frequent haplotypes were A1 and A3, which are thus candidates as ancestral haplotypes given their internal position in the network and their higher number of connections with the other less-frequent haplotypes. Most haplotypes were differentiated in a single mutational step, except for A6 and A7 (Figure 2-A). For ITS2, haplotypes H1, H3 and H8 were the most frequent and thus possible ancestral haplotypes, given their internal position in the network. Most haplotypes were differentiated in only one mutational step. The exceptions were H13, H14, H16 and H17 (Figure 3-A). For atpF-atpH, nine haplotypes were obtained (Table 1). The overall haplotype diversity (h) was moderate, with a mean value of h = 0.564; the nucleotide diversity (π) was low, with a mean value of π = 0.00186. The populations of Valladolid, Kaxil Kiuic, Champotón, Escarcega, Calakmul, Palenque, Tenosique, Puerto Morelos y Bacalar had only one haplotype; so, h and π were equal to zero (Appendix 2). Four populations had exclusive haplotypes: Virgencita (A4, A5 and A6), Hormiguero (A7), Belize-Cayo (A9) and Pedro A. Santos (A8) (Figure 2-B). For ITS2, 18 haplotypes were obtained (Table 1). Haplotype diversity (h = 0.827) and nucleotide (π = 0.00852) values were higher than those obtained for atpF-atpH. The populations of Peto, Virgencita, Hormiguero and Belize-Cayo presented only one haplotype; therefore, h and π were equal to zero (Appendix 3). Five populations had exclusive haplotypes: Becanchén (H4 and H5), Calakmul (H10), Carrillo Puerto (H13 and H14) and José María Morelos (H15 and H16) (Figure 3-B). List of GenBank accession for haplotypes are in Appendix 4.
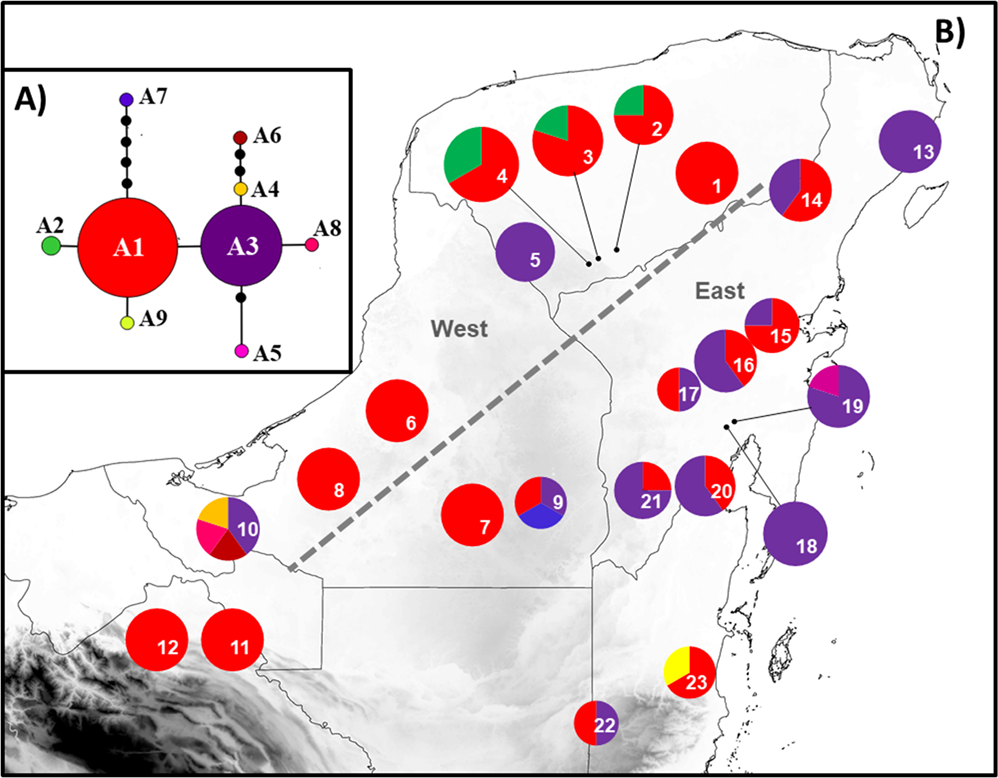
Figure 2 (A) Haplotype network obtained with chloroplast sequence atpF-atpH. Circle size is proportional to the frequency of each haplotype; lines between the haplotypes represent the mutational steps. (B) Geographic distribution of haplotypes in the 23 populations of Zamia prasina sampled in the YPBP. Pie charts represent the haplotypes found for each population; section size is proportional to the number of individuals with that haplotype. Gray dotted lines represent the location of the most probable barriers obtained with BARRIER. Numbers in the pie are population codes (see Figure 1 for locations).

Figure 3 (A) Haplotype network obtained with nuclear sequence ITS2. Circle size is proportional to the frequency of each haplotype; lines between the haplotypes represent the mutational steps. (B) Geographic distribution of haplotypes in 22 populations of Zamia prasina in YPBP. Pie charts represent the haplotypes found for each population; section size is proportional to the number of individuals with that haplotype. Gray dotted lines represent the location of the most probable barriers obtained with BARRIER. Numbers in the pie are populations codes (see Figure 1 for locations).
Phylogeographic structure. The non-hierarchical AMOVA showed similar results for atpF-atpH and ITS2 regions: 33.85 and 37.23 %, respectively, of the total variation found among populations. For chloroplast and nuclear regions, the values of F ST were statistically significant (F ST = 0.338, p < 0.001; F ST = 0.372, p < 0.001; respectively), indicating genetic differentiation among the populations studied (Table 2). For both regions, the greatest diversity is found within the populations, 66.15 % for atpF-atpH and 62.77 % for ITS2. For atpF-atpH, the N ST value observed was statistically higher in comparison with the value of GST (0.433 and 0.370, respectively; 96.1 % of permuted values of N ST were lower than observed N ST). For ITS2, the observed value of N ST was significantly higher than the value of G ST (0.362 and 0.257, respectively; 86.8 % of permuted values of N ST were less than the observed N ST). Both results indicate signatures of phylogeographic structure.
Table 2 Non-hierarchical Molecular variance analysis (AMOVA) of 23 populations of Zamia prasina using the chloroplast region atpF-atpH and the nuclear region ITS2.
| atfF-atpH | ITS2 | |||||||
|---|---|---|---|---|---|---|---|---|
| Source of variation | Sum of squares | Variance components | Percent variation | Fixation index | Sum of squares | Variance components | Percent variation | Fixation index |
| Among populations | 23.989 | 0.17088 | 33.85 | F ST = 0.338* | 64.778 | 0.53492 | 37.23 | F ST = 0.372** |
| Within populations | 26.383 | 0.33397 | 66.15 | 61.333 | 0.90196 | 62.77 | ||
| Total | 50.373 | 0.50484 | 126.111 | 1.43688 | ||||
The chloroplast and nuclear regions of DNA analyzed, the geographical distribution of the haplotypes suggested the existence of two groups, one in the eastern part of YPBP and the other in the western part (Figures 2-B and 3-B). For atpF-atpH, haplotype A1 was the most represented in the western region of the YPBP. On the other hand, haplotype A3 was more abundant in the populations of the eastern section of the YPBP. For ITS2, the haplotype H1 was the most represented in the populations of western YPBP, and haplotypes H3, H8 were much more frequent in eastern YPBP. BARRIER analysis showed, for both regions (atpF-atpH and ITS2), that the most probable genetic discontinuities among populations correspond to the east and west regions of the PBYP: the group in the east includes Puerto Morelos, Carrillo Puerto, Bacalar, José María Morelos, Cobá, Panto-Ha, X-Hazil, Pedro A. Santos, Nachi Cocom, Calakmul, Hormiguero and Virgencita; the group in the west includes Valladolid, Peto, Becanchén, Rancho Duarte, Kaxil Kiuic, Escarcega, Champotón, Palenque and Tenosique (Figures 2-B and 3-B). This analysis supported the geographic distribution of haplotypes mentioned before.
Considering the evidence obtained regarding the population groups in the eastern and western YPBP, we then determined their genetic diversity (Table 3). For atpF-atpH, the mean haplotype diversity (h) and nucleotide diversity (π) were low for both groups: h = 0.373 and π = 0.00080 for the group in the east; h = 0.406 and π = 0.00210 for the group in the west. For ITS2 in both groups, diversity values were moderate than for atpF-atpH (h = 0.566 and π = 0.00701 for the group in the east; h = 0.600 and π = 0.00281 for the group in the west.
Table 3 Average genetic diversity in the eastern and western groups using the chloroplast region atpF-atpH and nuclear region ITS2.
| Statistic | atpF-atpH | |
| Eastern group | Western group | |
| h | 0.373 ± 0.0075 | 0.406 ± 0.1290 (p = 0.002)) |
| π | 0.0008 ± 0.0001 | 0.0021 ± 0.0010 (p < 0.0001) |
| ITS2 | ||
| h | 0.566 ± 0.100 | 0.600 ± 0.106 (p = 0.822) |
| π | 0.007 ± 0.0039 | 0.002 ± 0.0005 (p < 0.0001) |
The principal component analysis (PCA) shows two groups of populations, where the populations in the east of the YPBP are located and another group where most of the western populations of the YPBP are found (Appendix 5). Most of the variation was obtained in two components: PCA1 contributed 55.03 % of the variation and PCA2 contributed 21.22 % explaining in total 76.25 % of the variation. For PCA1, six variables were associated, with two temperature variables (BIO2 and BIO7) contributing the most; however, four of the variables in this component corresponded to variables related to precipitation (BIO15, BIO17, BIO18 and BIO19). Two variables were associated with PCA2, one related to temperature (BIO3) and another to precipitation (BIO12), which contributed the most to the component.
Divergence time. The comparison of all the coalescence analyses revealed high convergence between the inferred parameters, and the effective sample sizes were always greater than 200. The trees obtained for atpF-atpH and ITS2 (Figures 4 and 5, respectively) were congruent in the principal nodes and with the phylogeny of Zamia (Calonje et al. 2019): Microcycas A. DC. as sister group of Zamia; the clade formed by Z. furfuracea, Z paucijuga Wieland, Z. loddigesii and Z. spartea as a sister group of the clade formed by Z. variegata and Z. prasina; and Z. variegata as sister species of Z. prasina. The genealogy for atpF-atpH showed that the haplotypes of Z. prasina grouped into two clades: (1) haplotypes A1, A2, A7 and A9 and (2) A3, A4, A5, A6 and A8. The greatest divergence age between these two haplotypes groups was 1.37 (95 % HPD, 2.3-0.46 Ma), and the ancestral haplotype is A7 (Figure 4, Appendix 6), which was found exclusively in the Hormiguero population (Campeche) (Table 1).

Figure 4 (A) Plant of Zamia prasina in its natural habit. (B) Bayesian chronogram for chloroplast sequence atpF-atpH. The divergence time of Zamia prasina haplotypes in the YPBP and other cycad species is shown. The 95 % confidence intervals are shown with purple bars; the numbers at the nodes indicate the estimated age, the numbers below the branches indicate the posterior probability (Appendix 6). (C) Extract from the complete chronogram corresponding to the Zamia prasina haplotypes (marked with the red line), the colors of the squares correspond to the haplotypes shown in Figure 2-A.

Figure 5 (A) Bayesian chronogram for nuclear sequence ITS2. The divergence time of Zamia prasina haplotypes in the YPBP and other cycad species is shown. The 95 % confidence intervals are shown with purple bars; the numbers at the nodes indicate the estimated age, the numbers below the branches indicate the posterior probability (Appendix 7). (B) Female cone of Zamia prasina. (C) Extract from the complete chronogram corresponding to the Zamia prasina haplotypes (marked with the red line), the colors of the squares correspond to the haplotypes shown in Figure 3-A.
The topology obtained with ITS2 had several clades with short branches, indicating low differentiation between the haplotypes and that, based on molecular clock theory, the times of divergence must be recent. The haplotypes of Z. prasina grouped into six clades: (1) haplotypes H13, H14 and H16; (2) H17, 2, 6, 4, 1 and H10; (3) H3, H5, H7; (4) H18; (5) H8 and H9; and (6) H15, H11, H12. The greatest divergence age among group of haplotypes was 1.36 (95 % HPD, 2.23-0.48 Ma). The ancestral haplotype was H12 with a divergence time of 69,000 years (Figure 5, Appendix 7). This haplotype was present in individuals from Panto-Ha, Nachi Cocom, Carrillo Puerto and was the only haplotype present in the population Belize-Cayo (Table 1).
Historical demography. Tajima’s D and Fu’s F S were negative values at the species and population levels; however, these values were not significant (p > 0.05). This result was similar for atpF-atpH and for ITS2 (Table 4). The mismatch distribution analysis showed a distinctive unimodal pattern, indicating recent demography expansion (R 2= 0.0477 and R 2= 0.0455 for atpF-atpH and ITS2 respectively). The skyline plot for the species level indicated that the effective size of the population decreased, and much more so for ITS2, then increased recently, in the last 10,000 years approximately, which can be interpreted as population growth, which we expect would be followed by an expansion (Figures 6-A and 6-D). At the population group level, the skyline plot showed one pattern of demography expansion only for the population groups in the east for ITS2 (Figure 6-F).
Table 4 Average values of the neutrality indexes Tajima’s D and Fu’s F S , for the population groups in the eastern and western parts of the peninsula and for all populations.
| Statistic | atpF-atpH | ||
| Eastern | Western | Total | |
| Tajima’s D | 0.01856 (p = 0.68700) | -0.17476 (p = 0.83408) | -0.05336 (p = 0.80242) |
| Fu’s F S | 0.31829 (NA) | 0.09316 (NA) | 0.24214 (NA) |
| ITS2 | |||
| Tajima’s D | 0.0397 (p = 0.71136) | -0.006129 (p = 0.68373) | -0.03263 (p =0.69850) |
| Fu’s F S | -0.05500 (NA) | 0.05405 (NA) | 0.11408 (NA) |
Positive values for D and F S are indicative of mutation-drift equilibrium, typical of stable populations; negative and significant values (p < 0.05) resulting from an excess of rare haplotypes indicate that populations have experienced recent expansions, often preceded by a bottleneck.

Figure 6 Demography history of Zamia prasina in YPBP based on Bayesian skyline plot. Substitution rates reported by Nolasco-Soto et al. (2015) were used. The vertical axis corresponds to the effective size of the population (Ne), the black line indicates the trend for the median Ne over time; purple lines are the 95% confidence intervals. The horizontal axis represents time in thousands of years. Graphs on left atpF-atpH (A: All populations, B: populations of the east group of YPBP, C: populations of the west group). Graphs on right ITS2 (D: All populations, E: populations of the east group of the YPBP, F: populations of the west group).
Potential distribution. The ENM performed well (AUC= 0.907 ± 0.018) and the predicted distribution (Figure 7) matched the actual known range of Z. prasina (Vovides & Nicolalde-Morejón 2010) associated with tropical evergreen and tropical deciduos forests in the YPBP and north of Nicaragua where other Zamia species are distributed. The ENM transferred into a past climatic scenarios shows drastic range shift since the LIG from present. During the last interglacial period (LIG ≈ 140-120 ka), only the northern area of Guatemala and Chiapas were suitable for Z. prasina. The suitable area during the Last Glacial Maximum (LGM ≈ 21-18 ka) for the two GCM were highly contracted. According to the CCSM model, during the LGM the species was possibly distributed on the eastern coast of the YPBP and in some areas of Central America. The MIROC model, on the other hand, indicated that conditions were suitable in a small area in the eastern part of the YPBP and western part of the Yucatan Peninsula. During the Middle Holocene (MH) for both models, the suitable area for Z. prasina increased, and expanded more to the northwest, so that it inhabited a large part of the YPBP and the southern coast of the Gulf of Mexico.

Figure 7 Ecological niche modelling for Zamia prasina. Current potential distribution. (LIG) Predicted distribution during the interglacial period (≈140-120 ka). (LMG-CCSM) Predicted distribution during the Last Glacial Maximum, CCSM model (≈ 21-18 ka). (LMG-MIROC) Predicted distribution during the Last Glacial Maximum, MIROC model. (HM-CCSM) Predicted distribution during the Middle Holocene, CCSM model (≈ 6 ka). (HM-MIROC) Predicted distribution during the Middle Holocene, MIROC model. Green: high suitability, light brown: low suitability.
Discussion
Phylogeography. The moderate and high haplotype diversity for atpF-atpH and ITS2, respectively, and their low nucleotide diversity indicate the presence of many haplotypes at high frequency but with few nucleotide differences among them; thus, the diversification of these haplotypes is recent. Similar results have been reported by Nolasco-Soto et al. (2015) for Z. paucijuga, with h = 0.669 and π = 0.0013 for the chloroplast region psbK-psbI and h = 0.843 and π = 0.0063 for ITS2. For Dioon sonorense,Gutiérrez-Ortega et al. (2014) reported h = 0.629 and π = 0.0004 for the chloroplast region trnL-trnF. For the cycads in Mexico, there are reports of high genetic diversity in some species, with few populations and restricted habitats, as in the case of Zamia loddigesii Miq. (González-Astorga et al. 2006), Dioon caputoi De Luca, Sabato & Vázq. Torres, D. merolae De Luca, Sabato & Vázq. Torres (Cabrera-Toledo et al. 2010) and D. sonorense (De Luca, Sabato & Vázq.Torres) Chemnick, T. J. Greg. & Salas-Mor (González-Astorga et al. 2008).
Disagreements in the estimated genetic diversity values for atpF-atpH and ITS2 in Zamia prasina may be due to the differences between these two DNA types. cpDNA is inheritanced maternally in cycads (Cafasso et al. 2001) so there is no genetic recombination, whereas it is reasonable to assume that nDNA is inherited bipaternally. In plants, cpDNA markers display average evolutionary rates in the range of 10-9 substitutions/site/year, relatively slower than nDNA rates (Wolf et al. 1987); our results are consistent with this difference.
The moderately-high genetic diversity found in Z. prasina may be due to three factors. (1) Although its geographical distribution is restricted and its habitat perturbed by anthropogenic activities, this species is abundant, and there are still large extension of vegetation where the species is common (Vovides & Nicolalde-Morejón 2010). The Global Biodiversity Information Facility (GBIF, http://data.gbif.org/species/browse/taxon/) reports more than 100 records of Z. prasina. The majority of them are in Mexico and Belize, but there are still areas that have been little explored to the south of Peten in Guatemala (Districts of Izabal and Alta Verapaz), where the species can be found (M. Veliz, curator of the BIGU herbarium pers. comm). (2) The species is dioecious with a cross-mating system that is mediated by pollinators, which implies that genetic material is exchanged between individuals, thus generating greater genetic diversity (Vovides & Nicolalde-Morejón 2010). (3) Most likely, a recent population expansion increased the haplotype diversity with low values of nucleotide diversity; this pattern was reported for other zamias (i.e., Z. paucijuga) (Nolasco-Soto et al. 2015). As a population expands, it may come in contact with populations that had been isolated during the glaciation and subjected to different selection pressures. This contact between divergent populations can increase the diversity due to genetic flow between them.
The number of samples analysed also can influences the amount of genetic diversity detected. In cycads, a range of sample sizes have been used for phylogeographic studies, for example, one individual was used per population for Dioon sonorense (Zamiaceae), and moderate values of nucleotide diversity (h = 0.629) were obtained using the chloroplast region trnL-trnF (Gutiérrez-Ortega et al. 2014). For Zamia paucijuga (Zamiaceae) with 8-10 individuals per population, high haplotid diversity was found using ITS2 (h = 0.843) and moderate diversity for the chloroplast region psbK-psbI (h = 0.669) (Nolasco-Soto et al. 2015). Here we used a sample size between these two examples among these reported (five individuals per population) and still managed to detect a moderate to-high genetic diversity (atpF-atpH, h = 0.564; ITS2, h = 0.827) in agreement with the previous studies. Since we are working with non-coding regions that have low mutation rates, small sample sizes might not detected, the actual diversity.
According to our chronogram (Figures 4 and 5), the diversification within Z. prasina happened during the Pleistocene. During this period, neotropical montane forests experienced extremely complex glacial-interglacial dynamics and the effect of climatic fluctuations on the genetic structure and population history of species distributed in these habitats led to different outcomes, such as rapid radiation or local extinction (Ramírez-Barahona & Eguiarte 2013). (4) The moderate genetic diversity detected for Z. prasina might also be the result of a still unfinished process of habitat fragmentation, in which subsequent isolation has not yet affected the distribution of its molecular variants.
The greatest variation is within the populations and not between them may be because not enough time has elapsed for a significant divergence between them.The comparison of genetic diversity between the eastern and western population groups on peninsula indicates that there are no differences between these two. We found populations that stand out due to their high genetic diversity, for atpF-atpH in the Virgencita and Hormiguero populations and for ITS2 in the Jose Maria Morelos, Carrillo Puerto and Bekanche populations.
The east-west phylogeographic structure in the populations of Z. prasina (suggested by the geographic distribution of the haplotypes and BARRIER analysis) can be explained by climatic factors. The PCA supports the east - west divergence and indicates that the variables related to precipitation contributed greatly to PCA1 and PCA2; thus, the genetic differentiation between the group of populations from the eastern and western parts of the peninsula may be due to the precipitation gradient in the YPBP. There is a humid region in the southeast and a dry region in the north-northeast (Carnevali et al. 2010). The eastern part of the YPBP is humid with 1,200-1,500 mm of annual rainfall, and the basin of Laguna de Terminos in southeastern YPBP receives up to 1,400 mm, compared with 500-1,000 mm in the northwest part of the YPBP (Orellana & Espada 2009). This gradient of precipitation determines the type of vegetation; in the northeast, low-elevation deciduous forest predominates, in the middle is low-elevation deciduous forest, in the east is predominantly medium-elevation semideciduous forest, and in the southeast, high-elevation evergreen forest predominates (Carnevali et al. 2012). Thus, the geographic distribution of Zamia prasina in the YPBP could be determined by precipitation. Although no published studies have focused on the influence of precipitation, the drier northeastern strip constitutes a barrier to the distribution of this species, as indicated by the absence of historical records in this area (GBIF, http://data.gbif.org/species/browse/taxon/). The populations group in the west is found in the medium subdeciduous forest, bordering the dry northeast portion of the YPBP, while, the eastern population group is in a medium evergreen forest in a more humid area and thus more suitable for Z. prasina. Differences in geography, forest and climate may thus also contribute to the differentiation (Vovides & Nicolalde-Morejón 2010). To test this hypothesis, a more comprehensive study with a landscape genomics approach should be carried out.
Regarding the influence of the precipitation gradient of the YPBP on Zamia prasina, Vovides & Olivares (1996) analyzed the caryotypical variation in 11 individuals of Z. prasina in the Mexican part of the YPBP. They found that the plants collected in the northeastern part of this region, where habitats are drier, have higher chromosome numbers (2n = 24-27) than in plants collected in the southeastern region (2n = 17), where the habitats are more humid. Vovides & Olivares (1996) concluded that the stressful drought conditions present in the northeast generate chromosomal changes. The chromosomal changes in Zamia are attributed to chromosomal fusion or fission. The fusion occurs between two acrocentric chromosomes (chromosomes whose centromere is closer to one of the ends), giving rise to a metacentric chromosome (with the centromere in the center of the chromosome) and thus reducing the number of chromosomes. During fission, a metacentric chromosome arises by fission or rupture of a metacentric chromosome into two acrocentric chromosomes, in this case increasing the number of chromosomes. Chromosomal fissions might confer adaptive advantages to survive in dry environments. Similar results were reported for other Zamia species of the Caribbean, which live in more stable conditions than do the continental Zamia species, which are exposed to a wide range of ecological conditions, from humid to dry and semi-xeric (Balduzzi et al. 1982).
In a study of the influence of environmental conditions on phenotypic diversity of Z. prasina,Limón et al. (2016) found that in populations with low precipitation and high temperature, the plants have fewer but wider leafs; in contrast, in areas with greater precipitation, the plants have more but thinner leafs. These authors proposed that Z. prasina inhabits areas under the dense canopy of tropical rainforests and semi-deciduous forests; therefore, the leaflets may be an adaptation to facilitate evapotranspiration and light capture in the shade. According to Stevenson et al. (1996), individuals of Z. prasina in intermediate environments have intermediate morphological forms. Thus, evidence of phylogeographic structure, in karyotype and morphology indicate that the precipitation gradient in the YPBP greatly influences the populations of Z. prasina. A study on the influence of precipitation on the genetic diversity of this species is necessary.
The present study shows that the estimated time of divergence among the most ancestral haplotypes of Zamia prasina was approximately 1.37 Ma based on atpF-atpH and 1.36 Ma based on ITS2; although most of the haplotypes have a more recent origin, indicating a recent population expansion that coincides with the Pleistocene (1.8-0.10 Ma), a period of events relevant to the evolution of the cycads. During the climatic changes of the Pleistocene, the tropical forests were subjected to a complex dynamic, an aspect that favored the presentation of rapid radiations and local extinctions (Ramírez-Barahona & Eguiarte 2013), and in the case of Z. prasina, there was an increase in genetic diversification.
Based on molecular phylogeny, Nagalingum et al. (2011) pointed out that, diversification increased in the genus Zamia during the Pleistocene and that it was one of the most speciose rich genera of cycads at that time. Pleistocene speciation prevailed in the neotropics, mainly for Zamia and Cerotozamia with the glacial-interglacial cycles being the predominat environmental force. The climate during that period also became more seasonal. Nolasco-Soto et al. (2015), employing nuclear and chloroplast markers determined the origin of Z. paucijuga between 6.4-1.6 Ma. Nolasco-Soto et al. (2015) suggested that the historical factors that affected Z. paucijuga at the population level during the Late Pleistocene similar affected other Zamia species, as our results showed for Z. prasina.
The values of the Tajima’s D and the Fu’s F S were negative but not significant, indicating that there was no population expansion. Because Z. prasina is a perennial with a long generational cycle the mutation rate is very low (Loveless & Hamrick 1984), thus, the significance of these two statistics is difficult to assess. However, the present work generated several lines of evidence that suggest that populations of Z. prasina underwent a recent demography expansion. (1) In the populations sampled, haplotype diversity is high, and nucleotide diversity is low. The low genetic divergence between the haplotypes can be explained because not enough time has elapsed for a significant divergence between the haplotypes (Lavery et al. 1996). (2) The star-shaped network of haplotypes found for Z. prasina in atpF-atpH and ITS2 regions also indicate a population expansion and one or a few haplotypes were more frequent, from which many differing haplotypes were derived in one or a few mutational steps; moreover, these haplotypes are found in low frequency. (3) The skyline plot showed a recent population expantion at species level, the effective size of the populations underwent a recent increase in the late Pleistocene-Holocene. (4) The diversification of haplotypes increased in the Late Pleistocene-Holocene.
Current and palaeodistribution modelling. As mentioned earlier, the palaeoecological studies of fossil pollen in the YPBP that reconstructed past of vegetation distribution and climate (Carrillo-Bastos et al. 2010, Sánchez-Sánchez & Islebe 2002) showed that the distribution in the YPBP was governed mainly by precipitation levels. A clear example is given by the certain ones semi-evergreen forest species, which grow in areas with a precipitation between 1,000 and 1,500 mm/year (Sánchez-Sánchez & Islebe 2002). The mosaic of current vegetation formed during the early Holocene, which implies that the modern pattern of isohyets was also established then (Leyden 2002). In the present, the climate is more seasonal, with rainier summers and less-intense winters, which encourages the regeneration and survival of seedlings. Z. prasina is actually more widely distributed in the YPBP, in ecosystems with seasonal climates (evergreen, deciduous and subdeciduous tropical forest).
In a geospatial analysis study of pollen records from the YPBP, Carrillo-Bastos et al. (2012) found that changes in vegetation during the Holocene in the peninsula were caused by changes in climate. In addition to climate influences during the Classic period (2,500-1,200 BC), the activities carried out by the Mayan people placed pressure on the forest coverage. In spite of this pressure, the vegetation coverage was not severely diminished; thus, the use of forest resources did not result in total deforestation. Eventually, vegetation recovered in relation to an increase of precipitation that coincided with the Medieval warm period during the Holocene. The highest pollen percentages taxa of semi-evergreen forests (85-92 %) were predicted to be in the southern and central parts of the peninsula and the lowest in the northern part. This distribution is similar to the modern distribution according to the isohyets, with precipitation increasing toward the eastern coast (Carrillo-Bastos et al. (2012) and consistent with our results that, during the Middle Holocene (MH), the environmentally suitable area for Z. prasina increased and expanded from the southeast to the center, covering a large part of the YPBP.
Although the LGM was a very dry period, some pleaces have been proposed to be relatively wet, e.g., center-west of Mexico (Bradbury 2000) and south of the YPBP (Hodell et al. 2008, Bush et al. 2009). Drill cores obtained from Lake Petén Itzá, Petén, Guatemala, contain a ~85-kyr record of terrestrial climate from lowland Central America that was used to reconstruct hydrologic changes in the northern Neotropics during the last glaciation.
Sediments are composed of clay, reflecting a relatively wet climate, and pollen from the same period indicates vegetation consisted of a temperate pine-oak forest. This finding contradicts previous inferences that the climate was arid during the Last Glacial Maximum (LGM) at least in the south of the YPBP (Hodell et al. 2008). This result coincides with ours that, during the LGM, the environment was suitable for the establishment of Z. prasina was concentrated in the eastern YPBP where the species may have found refuge during the cold, dry periods of the glaciation.
We propose that the absence of environmental suitability in the YPBP for the establishment of Z. prasina in the Last Interglacial (≈ 120 ka) could be due to some Zamia species needing a seasonal climate, while others have a tree habit and are adapted to very humid, woodland habitats (Nicolalde-Morejón et al. 2011). It is possible that the last interglacial was warmer, humid and without seasonality, in comparison with the Holocene (Walker et al. 2012, Cornejo-Romero et al. 2017), and thus was not propitious for the growth of Z. prasina.
The predictions by theMIROC and the CCSM models for the paleodistribution of Z. prasina in the LGM are different. The CCSM model predicts environmental suitability areas on the eastern coast of the YPBP, by the MIROC model does not predict any favorable areas on the peninsula (Figure 7). This difference may be due to these models basing their simulations on different initial experimental conditions using in different algorithms (Harrison et al. 2016). CCSM model estimates a lower temperature and greater precipitation than the MIROC model does (Otto-Bliesner et al. 2007) although the differences vary depending on the area of study (Taylor et al. 2012, Harrison et al. 2016).
The genetic data (phylogeographic structure and historical demography) suggest that the populations of Z. prasina expanded during the warmest periods of the Mid-Holocene, a pattern consistent with the glacial refugium hypothesis and validated by its paleodistribution. Post-Pleistocene expansion has been proposed for other species of the genus Zamia, such as Z. paucijuga (Nolasco-Soto et al. 2015); after the glaciations, its populations that originated in central Mexico became established to the south in the Pacific watershed.
In our study, the presence of ancestral haplotypes on the southeastern peninsula (based on ITS2 evidence) indicates possible center of origin, although based on atpF-atpH the center could be in Campeche. This difference may be due to the differing type of inheritance between the two markers. However, these results are only preliminary because they are based on information from two short genome regions. Future studies should address this incongruity by using sampling more populations and genomic regions.
In general, our results indicate that climatic fluctuations during the Pleistocene-Holocene influenced the evolutionary history of Z. prasina. The ecological niche modelling suggests that this species prevail during glacial events in restricted populations on the eastern coast of the peninsula, and expanded post-glacially into the northwest to occupy almost the entire territory of the YPBP. This result are congruent with the phylogeographic pattern of other Zamia species (Nolasco-Soto et al. 2015) and helps us understand the historical phylogeographic patterns of the Zamiaceae in the Neotropics. An analysis of the comparative phylogeography at the genus level for Zamia with greater genomic sampling will allow us to make inferences about the temporal congruence of species and about the influence of climate on the composition of the genus.


