


 nueva página del texto (beta)
 Inglés (pdf)
 Artículo en XML
 Referencias del artículo
 Enviar artículo por email
 Citado por SciELO
  Similares en
SciELO
Similares en
SciELO 
 Permalink
Fouquieriaceae (Ericales) is a small family of woody shrubs and small trees that includes a single genus and 11 species distributed throughout the arid and semi-arid areas of Mexico and southwestern United States (Henrickson 1972, Carlquist 2001). Fouquieria splendens Engelm., commonly called “ocotillo”, “flaming sword” and “Jacob’s staff” (Nobel & Zutta 2005), is the most widely distributed member of the family, in which three subspecies are recognized: F. splendens subsp. splendens, F. splendens subsp. campanulata (Nash) Henrickson, and F. splendens subsp. breviflora Henrickson (Henrickson 1972, Waser 1979, Schultheis & Baldwin 1999). Ocotillo is an erect shrub with spiny stems, whose leaves appear after substantial rainfall. Its inflorescences are terminal narrow panicles with orange-red to white flowers, which appear predominantly before rainy season (Zamudio 1995, Ladyman 2004, Nobel & Zutta 2005). This flowering plant is endemic to the arid and semi-arid zones of Mexico and the southwestern United States (Schönenberger & Grenhagen 2005). In Durango, Mexico, F. splendens subsp. splendens and F. splendens subsp. campanulata occur in the arid north-central and northeastern regions, generally on low elevation slopes, associated with xerophytic scrub vegetation. Besides, in southern Durango, there is an atypical population of the subsp. splendens, which occurs not in the characteristic arid zones of this plant but in an intermediate environment between deciduous tropical forest and xerophilous scrub; due to the atypical habitat and disjunct distribution, this population was considered as a relict (González-Elizondo et al. 2011). This population of subsp. splendens is small in size and severely restricted in geographic range, two criteria proposed by Habel et al. (2010) to define a relict population or species.
The biosynthesis and accumulation of compounds derived from both primary and secondary metabolism can vary among populations growing under different environmental conditions (Moore et al. 2014, Sampaio et al. 2016). Plants response to factors such as amount of light, CO2 concentration, temperature, soil nutrients, available water, as well as the attack of herbivores and pathogens through variations in the concentration of secondary metabolites, allowing them to adapt to changing environmental conditions (Wittstock & Gershenzon 2002, Ramakrishna & Ravishankar 2011, Lavola et al. 2017). There is an interest in understanding how secondary metabolites allow plant species and populations to adapt to changing environmental conditions (Sundqvist et al. 2012), which may be crucial for determining distribution patterns of phytochemicals in plants (Darrow & Bowers 1997). Knowledge of abundance, diversity, and distribution of secondary compounds, like phenolics, is essential for the understanding of the ecological interactions, contributing to a better comprehension of the functioning of ecosystems (Uriu et al. 2017), for instance, how chemical diversity within populations helps to prevent herbivores from developing resistance to defense compounds (Laitinen et al. 2000).
Phenolic compounds and carotenoids are widely distributed plant secondary metabolites. These compounds are essential for growth, reproduction, and protection against pathogens, predators and potential UV damage; they also provide color, flavor and aroma to fruits and vegetables (Balasundram et al. 2006, Mirkovic et al. 2017).
The phenolic and terpenic composition, and biological properties of the species of Fouquieria have been little explored. Among the few studies done are those of Domínguez et al. (1972), who found quercetin in the flowers of F. splendens; Scogin (1977), who evaluated, by paper chromatography, the floral anthocyanins of the 11 species of the genus, confirming a close chemical relation between F. splendens, F. diguetii (Tiegh.) I.M. Johnst., and F. macdougalii Nash; Scogin (1978), who considered that the foliar qualitative phenolic composition is a conserved character in the family and found, by paper chromatography, five phenolics (ellagic acid, isoquercitrin, rutin, caffeic acid, and scopolin) for F. splendens; Wollenweber & Yatskievych (1994), who reported the presence of three flavones and five flavonols on the surface of leaves and stems of F. splendens; Warnhoff & Halls (1965), who found ocotillol, a triterpene, in the bark of F. splendens; and Monreal (2015), who reported significant antioxidant and antibacterial activities for the foliar extracts of F. splendens. Thus, further studies are needed to provide information about the abundance, diversity, and distribution of secondary compounds of F. splendens related to environmental conditions. Also, further studies are needed to know if there are differences in the qualitative and quantitative composition of secondary compounds between a relict population and a population in regular conditions for the species. This information can help to understand how this species adapts to changing environments. The aims of the present study were 1) to determine and compare the qualitative and quantitative phenolic composition of leaves and inflorescences of F. splendens subsp. splendens and F. splendens subsp. campanulata, 2) to compare the foliar and floral phenolic composition between a relict population and a typical population of F. splendens subsp. splendens, and 3) to identify the main environmental factors determining the phenolic composition of the analyzed populations.
Materials and methods
Plant material. Inflorescences of 10 adult individuals per population were randomly collected from three locations of Durango, Mexico, from March to April 2016, months in which this species blooms. Leaves were collected from the same locations in August 2016, after the rainy season, when the leaves of this species appear. About 50 g of inflorescences and 100 g of leaves per individual were collected. Both types of samples were stored in paper bags in darkness for transportation to the laboratory. Table 1 shows the geographical data of the collection locations. Population S1 (Acatita, Mezquital) represents a relic of F. splendens subsp. splendens (a small, disjunct population in an intermediate habitat between xerophytic and subtropical scrub), S2 is a “regular” population of F. splendens subsp. splendens (with the environmental conditions and habitat that this species occupy in most of its distribution area), whereas S3 is a population of F. splendens subsp. campanulata. Voucher specimens (one specimen per population) were collected (licence SGPA/DGVS/11922/16), taxonomically identified, and deposited at the herbarium CIIDIR. In the laboratory, leaves and flowers were rinsed with tap water. Similar structures of the ten individuals of each population were combined and then three independent pools of samples (replicas) were formed and separately analyzed. Plant material was dried in an electric dryer (40 °C) for 48 h, then ground to a fine powder, and stored in darkness at room temperature (between 10 and 25 °C) until use (no more than one month).
Table 1 Collection sites and climate conditions (annual averages for each location) for three wild populations of Fouquieria splendens from Durango, Mexico.
| Location | Voucher | Subspecies | Latitude N | Longitude W | Altitude (m) | Prec (mm) | Tmx (°C) | Tm (°C) | Rad (W/m²) | RH (%) |
| Acatita, Mezquital (S1) | Monreal 11 (49021) | splendens | 23°39'42.6'' | -104°22'17.1'' | 1,500 | 1.73 ± 0.22a | 25.35 ± 0.43a | 9.11 ± 0.43b | 516.80 ± 14.16a | 53.93 ± 3.13a |
| Yerbanís, Peñón Blanco (S2) | Monreal 12 (49019) | splendens | 24°44'55.9'' | -103°46'58.5'' | 1,910 | 1.30 ± 0.33a | 24.13 ± 0.33b | 11.06 ± 0.18a | 517.71 ± 18.35a | 48.51 ± 3.52a |
| Atotonilco, San Juan del Río (S3) | Monreal 13 (49020) | campanulata | 24°50'32.4'' | -104°29'36.3'' | 1,680 | 1.47 ± 0.24a | 24.51 ± 0.35b | 9.26 ± 0.38b | 527.74 ± 16.37a | 51.97 ± 3.32a |
Prec: precipitation; Tmx: maximum temperature; Tm: minimum temperature; Rad: global radiation; RH: relative humidity. Different letters on the same column indicate significant differences (Duncan's multiple range test, p < 0.05).
Environmental conditions of collection sites. To compare the environmental conditions affecting the synthesis and accumulation of secondary metabolites of F. splendens populations, the average values of three years (2014-2016) of annual average precipitation (Prec), maximum and minimum temperature (Tmx and Tm, respectively), global radiation (Rad), and relative humidity (RH) were obtained from data of the weather station of The National Institute of Forest, Agricultural and Livestock Research of Mexico (INIFAP), for each collection site.
Soil analysis. The soil physicochemical analysis was carried out using the methods described in the Mexican Official Standard NOM-021-RECNAT-2000 (SEMARNAT 2002), which establish the specifications of fertility, salinity and soil classification. Two samples of 500 g of soil were collected from each location (at 20 cm depth). The two samples of a same location were combined, and three subsamples were formed (replicas) and analyzed independently. Samples from each site were pooled and stored in plastic bags until analysis. The soil parameters analyzed were: texture, pH, electrical conductivity (EC), organic matter (OM), organic carbon (OC), Nitrogen (N), Phosphorus (P), and soluble cations (Potassium [K], Calcium [Ca], Magnesium [Mg] and Sodium [Na]).
Preparation of phenolic extracts. Phenolic extracts were prepared according to Kim & Lee (2002). Foliar samples (5 g) of dry ground tissues were mixed with 50 mL of 80 % ethanol (v/v) and sonicated for 1 h at 25 °C. The resulting solutions were centrifuged (10,500 g, for 10 min at 25 °C), then the supernatants were collected and concentrated to dryness under reduced pressure (0.5 Kg/cm2), at 39 °C, in a rotary evaporator (Büchi, Rotavapor R-114). The dry extracts were re-dissolved in 80 % ethanol (J. T. Baker) solution (v/v) to a final concentration of 100 mg/mL (total extract). Floral extracts were prepared using acidified 80 % ethanol (1 % HCl) as solvent, in the same manner previously described to obtain the respective total extract. The foliar and floral extraction yields (EYL and EYF, respectively) were calculated (mass of total extract/mass of dry sample) for each sample. Aliquots of total extracts were taken to carry out the spectrophotometric determination of total phenolics, total flavonoids, condensed tannins, and total floral monomeric anthocyanins. For the HPLC-DAD analysis of both foliar and floral samples, total extracts were concentrated to remove ethanol and fractioned with ethyl acetate (1:1, v/v). The organic phase was recovered, concentrated to dryness, and dissolved in 2 mL of methanol; these were the phenolic-enriched extracts. Ethyl acetate fractionation was done due to this solvent increase the selectivity of the phenolic compounds and has been selected as the solvent with the highest phenolic affinity by several authors (Mantilla et al. 2015). According to the experience of our research group, ethyl acetate produces phenolic-enriched extracts (Almaraz-Abarca et al. 2006, Reyes-Martínez et al. 2014), from which, well-resolved compounds can be obtained by HPLC (Barriada-Bernal et al. 2014).
Determination of foliar and floral total phenolics (TPL and TPF, respectively). The concentrations of TPL and TPF were estimated according to Singleton & Rossi (1965). A standard curve constructed with six concentrations (0.02-0.50 mg/mL) of gallic acid (GA) (Sigma) was used to estimate the total phenolic contents in the extracts (Abs725 = 8.27 [GA] + 0.10, r = 0.99). TP were expressed as milligrams of gallic acid equivalents per gram of dry extract (mg GAE /g DE).
Determination of foliar and floral total flavonoids (TFLL and TFLF, respectively). Quantifications of TFLL and TFLF were performed according to Ordoñez et al. (2006). A standard curve constructed with six concentrations (0.001-0.062 mg/mL) of quercetin (Q) (Sigma) was used to estimate the flavonoid contents in the extracts (A450 = 38.08 [Q] - 0.01, r = 0.99). TFL were expressed as milligrams of quercetin equivalents per gram of dry extract (mg QE/g DE).
Determination of foliar condensed tannins (TCT). The estimation of TCT (proanthocyanins) was determined according to Julkunen-Tiitto (1985). The TCT concentration in the extract was estimated from a calibration curve constructed with eight concentrations (0.002-0.25 mg/mL) of (-)-epicatechin (E) (Sigma) as standard (A500 = 4.87 [E] + 0.02, r = 0.99), and expressed as milligrams of (-)-epicatechin equivalents per gram of dry extract (mg EE/g DE).
Determination of total floral monomeric anthocyanins (TMA). The TMA contents were determined with the differential pH method described by Giusti & Wrolstad (2001), using the molecular weight (449.2) and the molar absorption (26,900) of cyanidin-3-O-glucoside as reference, since this anthocyanin is the most abundant in F. splendens flowers (Scogin 1977). The values were expressed as milligrams of cyanidin-3-O-glucoside equivalents per gram of dry extract (mg C3gE/g DE).
Determination of total floral carotenoids (TC). The TC of F. splendens were assessed according to Scott (2001). A calibration curve was constructed with six concentrations (0.1-1.0 mg/mL) of β-Carotene (β-C) to calculate the concentration of carotenoids of samples (Abs460 = 0.23 [β-C] + 0.0027, r = 0.99). The results were expressed as micrograms of β-carotene equivalents per gram of dry sample (μg β-CE/g DS).
HPLC-DAD analysis. Aliquots (100 µL) of foliar and inflorescence phenolic-enriched extracts (4 mg/mL) were analyzed in a Perkin Elmer Series 200 HPLC system, according to the gradient method reported by Campos & Markham (2007), using a Perkin Elmer Brownlee Analytical C18 column (4.6 × 250 mm, 5 µm) (Shelton, Connecticut, USA). Chromatograms were registered at 265 and 340 nm. Spectral data of all picks were recorded between 200 and 400 nm using diode array-detection (DAD). Structural information of compounds was obtained by direct comparison of the retention time (RT) and UV spectra of the resolved compounds with those of the following standards: ellagic acid (Sigma) (RT: 34.25 min; λmax: 254, 308sh, 367), caffeic acid (Sigma) (RT: 22.75 min; λmax: 238sh, 297sh, 325), chlorogenic acid (Sigma) (RT: 22.8 min; λmax: 245sh, 296sh, 323), ferulic acid (Sigma) (RT: 34.89 min; λmax: 239sh, 296sh, 324), rutin (Sigma) (quercetin-3-O-[rhamnosyl(1-6)-glucoside], RT: 33.38 min; λmax: 258, 268sh, 301sh, 359). Structural information of compounds also was obtained considering the UV theory developed by Campos & Markhan (2007) for flavones, flavonols and phenolic acids. Concentrations were estimated by an external standard method by area measurements, using a standard curve of rutin (area = 1.12 × 10⁷ [RN] + 2.04 × 10⁵, r = 0.99) for flavonols, ellagic acid (area = 4.90 × 10⁸ [EA] + 1.58 × 10⁵, r = 0.99) for this same acid, and caffeic acid (area = 6.88 × 10⁷ [CA] - 7.75 × 10³, r = 0.99) for other phenolic acids. The content of each compound was expressed as micrograms per gram of dry extract (µg/g DE).
Fourier transform infrared spectroscopic analysis with attenuated total reflection (FTIR-ATR). The phenolic-enriched extracts were analyzed on a Perkin Elmer Frontier FTIR-NIR Spectrometer (Waltham, MA, USA) with diamond ATR accessory to obtain information of functional groups and chemical structures present in the samples. The average of 32 scans were taken for each spectrum. Spectra were recorded between 4,000 and 600 cm-1 with a spectral resolution of 4 cm-1. The influence of H2O and CO2 was subtracted automatically by the equipment. The data were exported using Perkin Elmer Spectrum software version 10.5.4.738 (PerkinElmer, Waltham, MA, USA).
Data analysis. All the chemical assays were carried out for three independent samples and the results were presented as mean ± SD. The data were subjected to a one-way analysis of variance and means were separated by Duncan's multiple range test. To assess the chemical relations between the three analyzed populations, chemical data were subjected to a cluster analysis (Euclidean distances and Ward’s method). To assess the contribution of each chemical attribute to the differentiation of populations, a Principal Component Analysis (PCA) was carried out. A Canonical Correspondence Analysis (CCA) was accomplished, considering both chemical and environmental variables, for determining the influence of environmental conditions on chemical composition. Mahalanobis distance was used to generate matrices with geographical distances (matrix A), based on latitude and longitude data; chemical distances (matrix B), based on HPLC-DAD and spectrophotometric quantifications; and environmental distances (matrix C), based on soil parameters and climatic data. Correlation among matrices distances was calculated with the Mantel test (at 10,000 permutations). Statistical analysis was carried out using XLSTAT Ecology 2017 (version 19.5) and PAST 3.0 at 5 % significance level.
Results
Extraction yield and total phenolics. Non-significant differences in the EYL were found among populations (Table 2). On the contrary, the EYF (Table 3) were significantly different for each population, with that of F. splendens subsp. campanulata (S3) being the highest.
Table 2 Extraction yield (EYL), concentration of total phenolics (TPL), total flavonoids (TFLL), condensed tannins (TCT), flavonoids-total phenolics ratio (TFL/TP) and condensed tannins-flavonoids ratio (CT/TFL) of foliar tissue of two wild populations of Fouquieria splendens subsp. splendens (S1 and S2) and one of F. splendens subsp. campanulata (S3).
| S1 | S2 | S3 | |
| EYL (%) | 21.93 ± 1.15a | 20.98 ± 0.80a | 20.29 ± 0.44a |
| TPL (mg GAE/g DE) | 318.61 ± 20.99a | 268.82 ± 1.70b | 261.39 ± 21.97b |
| TFLL (mg QE/g DE) | 24.55 ± 1.79b | 23.54 ± 0.69b | 29.68 ± 1.32a |
| TFLL/TPL (%) | 7.70 ± 0.15c | 8.77 ± 0.33b | 11.38 ± 0.46a |
| TCT (mg EE/g DE) | 1.52 ± 0.39b | 1.37 ± 0.17b | 2.82 ± 0.26a |
| TCT/TFLL (%) | 6.12 ± 1.12b | 5.81 ± 0.69b | 7.81 ± 0.49a |
GAE, Gallic Acid equivalents; QE, Quercetin equivalents; EE, (-)-epicatechin equivalents; DE, dry extract. Different letters on the same line indicate significant differences (Duncan's multiple range test, p < 0.05).
Table 3 Extraction yield (EYF), concentration of total phenolics (TPF), total flavonoids (TFLF), total monomeric anthocyanins (TMA), total carotenoids (TC), flavonoids/total phenolics ratio (TFLF/TPF), and anthocyanins/flavonoids ratio (TMA/TFLF) of inflorescences of two wild populations Fouquieria splendens subsp. splendens (S1, S2) and one of F. splendens subsp. campanulata (S3).
| S1 | S2 | S3 | |
| EYF (%) | 22.95 ± 1.30c | 26.15 ± 0.20b | 30.93 ± 0.65a |
| TPF (mg GAE/g DE) | 190.63 ± 12.85a | 189.38 ± 1.37a | 192.13 ± 3.03a |
| TFLF (mg QE/g DE) | 8.75 ± 0.96a | 7.33 ± 0.31a | 6.81 ± 0.19a |
| TFLF/TPF (%) | 4.59 ± 0.22a | 3.87 ± 0.15b | 333.55 ± 0.05c |
| TMA (mg C3gE/g DE) | 1.46 ± 0.03a | 1.10 ± 0.07b | 0.27 ± 0.02c |
| TMA/TFLF (%) | 16.84 ± 1.73a | 15.08 ± 0.99a | 3.97 ± 0.34b |
| TC (µg β-CE/g DS) | 51.29 ± 2.12b | 91.47 ± 0.95a | 20.58 ± 1.11c |
GAE, Gallic Acid equivalents; QE, Quercetin equivalents; C3gE: Cyanidin-3-glucoside equivalents; β-CE: Beta carotene equivalents; DE, dry extract; DS: dry sample. Different letters on the same line indicate significant statistical differences (Duncan's multiple range test, p < 0.05).
TPL and TPF are shown in Tables 2 and 3, respectively. For the three populations, the TPL contents were higher than the TPF contents. The TPL value of F. splendens subsp. splendens (S1), the relic population, was significantly higher than the values of S2 and S3. The differences of the TPF values were not significant.
Total flavonoids and TCT. The leaves of F. splendens subsp. campanulata (S3) had the highest flavonoid concentration, representing the 11.38 % of total phenolics (Table 2). Like for the TPF contents, the differences of TFLF contents were not significant between populations (Table 3).
The amount of foliar TCT was higher for F. splendens subsp. campanulata (S3) than for the two populations of F. splendens subsp. splendens (S1 and S2). In S3, TCT represented the 7.81 % of the TPC (Table 2).
Concentration of floral TMA and TC. The levels of floral anthocyanins and carotenoids are displayed in Table 3. The flowers of Fouquieria splendens accumulate both anthocyanins and carotenoids, the second ones at lower concentrations. The contents of both types of compounds were significantly different among populations. The flowers of the relict population had the highest anthocyanins concentration whereas those of F. splendens subsp. campanulata had, by far, the lowest. The subspecies campanulata also had the lowest concentration of carotenoids. The highest concentration of these compounds was found in the typical population of subsp. splendens (S2).
FTIR-ATR analysis. The FTIR spectra of foliar and floral phenolic extracts of the three populations analyzed are shown in Figure 1. The analysis revealed the presence of typical functional groups of phenolic compounds in the extracts, as those represented by bands between 1,722 and 1,702 cm-1, 1,535 and 1,512 cm-1, 1,194 and 1,030 cm-1, and those at 1,609 cm-1 and 1,347 cm-1.
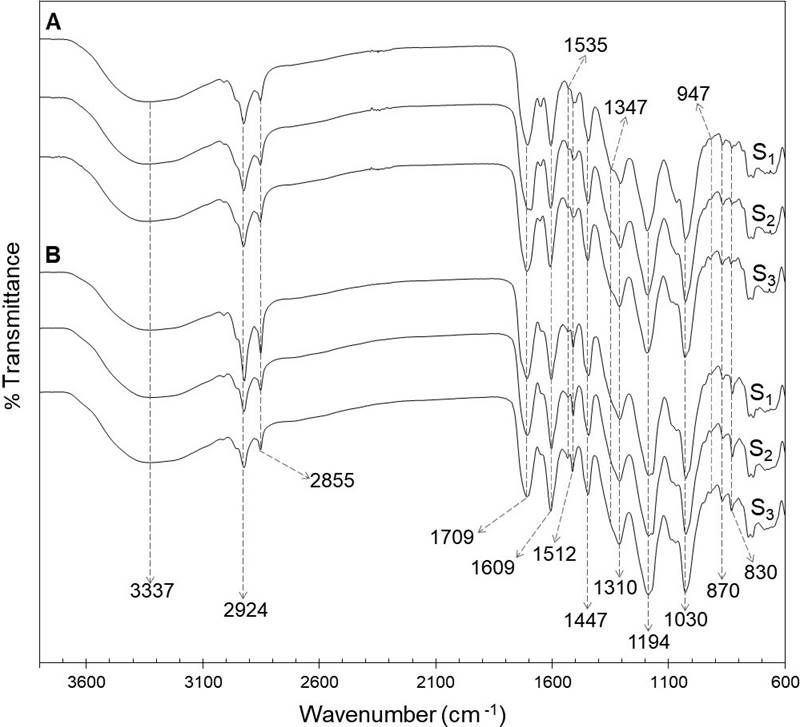
Figure 1 FTIR-ATR spectra of ethanolic extracts of the foliar (A) and floral (B) extracts from a relict population (S1) and a typical population (S2) of Fouquieria splendens subsp. splendens, and from a typical population (S3) of F. splendens subsp. campanulata.
Phenolic profiles. The HPLC chromatograms of the leaves and inflorescences extracts of F. splendens subsp. splendens and F. splendens subsp. campanulata are shown in Figure 2. The UV spectra of the major phenolic compounds found are displayed in Figure 3. The retention time (RT), maximum absorbance (λmax), and concentration of individual phenolic compounds are displayed in Table 4.

Figure 2 HPLC-DAD chromatograms (registered at 265 nm) of the leaves (A) and inflorescences (B) ethanolic extracts from a relict population (S1) and a typical population (S2) of Fouquieria splendens subsp. splendens, and from a typical population (S3) of F. splendens subsp. campanulata from Durango, Mexico. Compounds 1-19 correspond to Table 4.
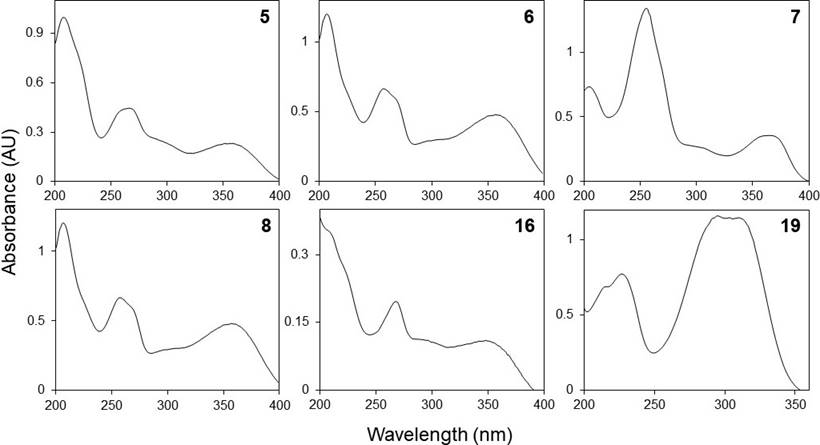
Figure 3 HPLC-DAD UV spectra (registered between 200 and 400 nm) of some phenolic compounds found in the ethanolic extracts of leaves and inflorescences of a relict population (S1) and a typical population (S2) of Fouquieria splendens subsp. splendens, and from a typical population (S3) of F. splendens subsp. campanulata from Durango, Mexico.
Table 4 Phenolic compounds found in leaves and inflorescences of a relict population (S1) and a typical population (S2) of Fouquieria splendens subsp. splendens, and from a typical population (S3) of F. splendens subsp. campanulata from Durango, Mexico.
| Number of compound | Retention time (min) | λmax | Type of phenolic compound | Concentration (µg E/g DE) | ||
| S1 | S2 | S3 | ||||
| Leaves | ||||||
| 1 | 25.71 ± 0.85 | 276 | Phenolic acid | 44.53 ± 0.20a | 26.99 ± 1.12b | 322.54 ± 0.21c |
| 2 | 28.44 ± 0.66 | 259, 305sh, 369 | Ellagic acid derivative | 1.93 ± 0.04b | 1.55 ± 0.03c | 2.09 ± 0.03a |
| 3 | 29.15 ± 0.53 | 276 | Phenolic acid | 8.10 ± 0.50a | 1.55 ± 0.03c | 6.39 ± 0.06b |
| 4 | 30.24 ± 0.31 | 278 | Phenolic acid | 10.59 ± 0.10a | 7.64 ± 0.18b | 6.46 ± 0.03c |
| 5 | 32.70 ± 0.30 | 259, 268sh, 295sh, 355 | Myricetin derivative | 63.79 ± 0.32b | 140.34 ± 3.44a | 66.95 ± 1.51b |
| 6 | 32.98 ± 0.33 | 258, 268sh, 301sh, 359 | Rutin | 81.14 ± 0.29b | 58.28 ± 0.46c | 173.23 ± 6.61a |
| 7 | 34.38 ± 0.43 | 254, 367 | Ellagic acid | 14.04 ± 0.16a | 8.11 ± 0.02c | 8.93 ± 0.07b |
| 8 | 35.16 ± 0.33 | 255, 268sh, 299sh, 359 | Quercetin-3-O-glycoside | 29.67 ± 1.54b | 53.98 ± 1.89a | 18.87 ± 0.35c |
| 9 | 35.73 ± 0.30 | 281 | Phenolic acid | 5.35 ± 0.20c | 6.27 ± 0.02a | 5.69 ± 0.12b |
| 10 | 40.73 ± 0.20 | 259, 366 | Ellagic acid derivative | 33.38 ± 0.01a | 1.84 ± 0.00b | 1.72 ± 0.00c |
| Inflorescences | ||||||
| 11 | 24.92 ± 0.78 | 271 | Phenolic acid | 17.66 ± 1.06a | 15.07 ± 3.49a | 17.12 ± 0.60a |
| 12 | 25.24 ± 0.78 | 268 | Phenolic acid | 13.38 ± 0.40a | 11.07 ± 3.17ab | 7.42 ± 0.18b |
| 13 | 27.81 ± 0.63 | 256, 366 | Ellagic acid derivative | 2.34 ± 0.22b | 2.82 ± 0.40b | 4.79 ± 0.15a |
| 4 | 29.87 ± 0.48 | 278 | Phenolic acid | 6.19 ± 0.58a | 5.67 ± 1.0a | 5.74 ± 0.15a |
| 14 | 30.35 ± 0.52 | 264 | Phenolic acid | 7.73 ± 0.78b | 10.25 ± 2.00a | 11.47 ± 0.31a |
| 7 | 33.99 ± 0.34 | 254, 367 | Ellagic acid | 10.05 ± 0.03c | 12.91 ± 0.33b | 14.37 ± 0.38a |
| 15 | 34.85 ± 0.27 | 259, 264sh, 296sh, 354 | Myricetin derivative | 6.25 ± 0.45a | 7.08 ± 2.84a | 6.20 ± 0.82a |
| 16 | 37.26 ± 0.25 | 268, 296sh, 346 | Kaempferol derivative | 6.73 ± 1.23b | 12.62 ± 2.69a | 0.34 ± 0.11c |
| 17 | 42.31 ± 0.38 | 261 | Ellagic acid derivative | 1.09 ± 0.00a | 1.04 ± 0.01b | 0.63 ± 0.02c |
| 18 | 44.66 ± 0.16 | 296, 311sh | Phenolic acid | 2.25 ± 0.03b | 2.83 ± 0.02a | 1.29 ± 0.05c |
| 19 | 47.02 ± 0.21 | 296, 305sh | Phenolic acid | 62.37 ± 0.06a | 347.28 ± 0.25b | 26.01 ± 0.14c |
Different letters on the same line indicate significant differences (Duncan's multiple range test, p < 0.05).
A total of 19 different phenolics were found in both, leaves and flowers. In leaves, five phenolic acids (1, 3, 4, 7, and 9), two ellagic acid derivatives (2 and 10), and three flavonols (compound 5, proposed as a myricetin derivative; compounds 6, proposed as rutin, and compound 8, proposed as a quercetin-3-O-glycoside) were found. Although ellagic acid (compound 7) is not a typical benzoic or cinnamic acid derivative, it was considered as a phenolic acid. The current results revealed that the foliar phenolic composition of the two subspecies analyzed of F. splendens was highly conserved, therefore similar (Figure 2).
For inflorescences, seven phenolic acids (4, 7, 11, 12, 14, 18, and 19), two ellagic acid derivatives (13 and 17), and two flavonols (compound 15 proposed as a myricetin derivative, and compound 16 proposed as a kaempferol derivative) were found. As for the foliar phenolic composition, the floral phenolic composition of the two subspecies of F. splendens was highly conserved (Figure 2).
The individual concentrations of each phenolic compound resolved in the chromatograms are shown in Table 4. Contrary to the conserved qualitative phenolic composition, significant variations in the concentration of foliar and floral individual phenolics were found among the populations of F. splendens analyzed. Except for 5, whose concentration was non-significantly different between S1 and S3, the concentrations of each of the foliar phenolic compound were variable among the populations. Conversely, the concentration of the 11 floral phenolics were less variable between the populations analyzed.
Soil physicochemical properties. The results of the soil physicochemical analysis of each collection site are displayed in Table 5. Significant variations between populations were found. The data indicate that soils from S1 and S2 were sandy loam, whereas that of S3 had a silt loam texture. The soils were between neutral and slightly alkaline, low in OM, OC, N, P, and Na, but high in K and Ca. Regarding Mg, the soils of S2 and S3 had a relevant higher level than the soil of S1.
Table 5 Soil physicochemical parameters of the three collection sites (S1, S2, and S3) analyzed.
| Parameters | Units | S1 | S2 | S3 |
| Clay | % | 10.52 ± 0.00a | 6.16 ± 0.51b | 3.96 ± 0.00c |
| Silt | % | 21.36 ± 1.92b | 22.72 ± 2.83b | 58.84 ± 1.41a |
| Sand | % | 3368.12 ± 1.92a | 71.12 ± 3.34a | 37.20 ± 141b |
| pH (H2O) | 6.75 ± 0.07c | 7.15 ± 0.07b | 7.55 ± 0.07a | |
| Electrical Conductivity (EC) | µmhos/cm | 80.00 ± 7.07a | 3371.00 ± 9.89a | 27.45 ± 1.20b |
| Organic matter (OM) | % | 0.26 ± 0.01b | 0.22 ± 0.01c | 0.68 ± 0.01a |
| Organic Carbon (OC) | % | 0.15 ± 0.01b | 0.13 ± 0.01c | 0.39 ± 0.01a |
| Phosphorous (P) | mg/L | 0.02 ± 0.00c | 3330.12 ± 0.00a | 0.07 ± 0.01b |
| Nitrogen (N) | % | 0.13 ± 0.04a | 0.18 ± 0.04a | 0.15 ± 0.00a |
| Potassium (K) | mg/kg | 132.77 ± 14.12b | 551.07 ± 30.81a | 33162.97 ± 331.33b |
| Calcium (Ca) | mg/kg | 6491.52 ± 80.02b | 6612.28 ± 68.33b | 20236.16 ± 379.56a |
| Magnesium (Mg) | mg/kg | 13.94 ± 1.18c | 295.03 ± 12.18b | 322.40 ± 4.75a |
| Sodium (Na) | mg/kg | 18.02 ± 1.81b | 15.46 ± 0.60b | 31.06 ± 2.30a |
Different letters on the same line indicate significant statistical differences (Duncan's multiple range test, p < 0.05).
Principal component analysis and clustering. The global chemical variation among the populations analyzed was assessed by a PCA. A two-dimensional plane of the PCA, based on the contents of total phenolics, total flavonoids, total condensed tannins, total monomeric anthocyanins, total carotenoids, as well as the differences in the concentration of individual compounds from leaves and inflorescences, is presented in Figure 4A. The principal components PC1 and PC2 explained 81.53 % (50.92 and 30.61 %, respectively) of the total variance in the data. PC1 separated the two subspecies of F. splendens into two groups: group 1 was formed by F. splendens subsp. campanulata (S3) and group 2 by F. splendens subsp. splendens (S1 and S2). It can be observed that inside group 2, PC2 clearly separated S1 and S2. PC1 was correlated with the concentrations of 1, 4 from leaves, 6, 10, 12, 13, 14, 7 from flowers, 16, 17, 18, 19, EYF, TPL, TFLL, TFLF, TCT, and TMA, and had the highest discriminative power (15.27), whereas PC2 was correlated with the concentrations of 11, 4 from flowers, 15, and TC, and had a lower discriminative power (9.18).

Figure 4 Results of a Principal Component Analysis (A) and dendrogram (B) comparing chemical variables of leaves and inflorescences of a relict population (S1) and a typical population (S2) of Fouquieria splendens subsp. splendens, and of a typical population (S3) of F. splendens subsp. campanulata from Durango, Mexico. EYL: foliar extraction yield; EYF: floral extraction yield; TPL: foliar total phenolics; TPF: floral total phenolics; TFLL: foliar total flavonoids; TFLF: floral total flavonoids; TCC: foliar total condensed tannins; TMA: floral total monomeric anthocyanins; TC: floral total carotenoids; compounds 1-19 correspond to Table 4.
The results of a cluster analysis, based on the contents of the evaluated phytochemicals, are shown in Figure 4B. These results confirmed the discrimination between the two subspecies, as well as the separation of the relict and the typical populations of F. splendens subsp. splendens, showing at the same time a higher similarity between S1 and S2 than either of these with S3.
Correlation between chemicals and environmental variables. The Mantel test was used to calculate the relation between geographical and chemical data, influenced by environmental variables. A significant correlation was found (r[AB.C] = -0.99, p < 0.05; A: geographical distance matrix, B: chemical distance matrix, C: environmental distance matrix).
To explore the importance of the environmental variables on the accumulation of phenolics and carotenoids of the analyzed populations, a CCA comparing the contents of all analyzed compounds was carried out (Figure 5). The CCA showed that the axes CCA1 and CCA2 explained 97.25 % of total variance. Axe CCA1 was mainly related to soil physicochemical parameters. The variables significantly correlated (p < 0.5) were silt (r = 0.88), sand (r = -0.93), EC (r = -0.75), OM (r = 0.93), OC (r = 0.93), K (r = -.078), Ca (r = 0.90) and Na (r = 0.94).
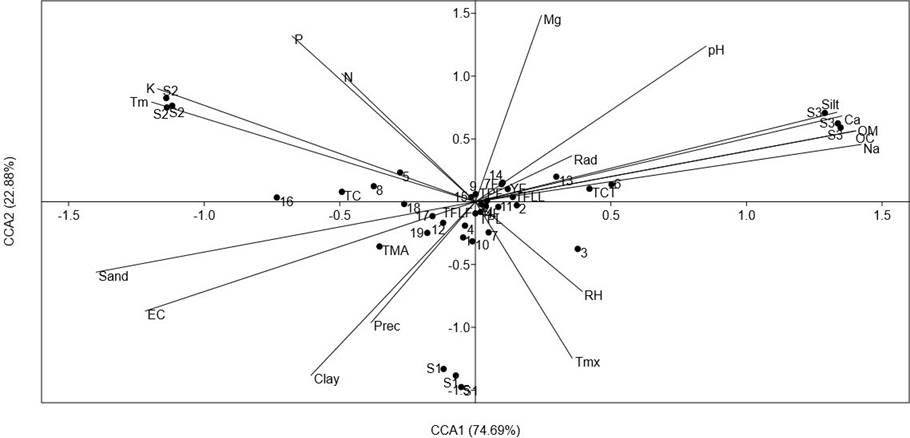
Figure 5 Results of a Canonical Correspondence Analysis (CCA), comparing the concentration of foliar and total phenolics (TPL and TPF, respectively), total flavonoids (TFLL and TFLF, relative respectively), total condensed tannins (TCT), total anthocyanins (TMA), total carotenoids (TC), HPLC-DAD quantification of leaves and inflorescence (compounds 1-19 from Table 4) of a relict population (S1) and a typical population (S2) of Fouquieria splendens subsp. splendens, and of a typical population (S3) of F. splendens subsp. campanulata from Durango, Mexico. The results also considered soil physicochemical parameters (texture, pH, electric conductivity: EC, organic matter: OM, organic carbon. OC, Phosphorous: P, Nitrogen: N, Potassium: K, Calcium: Ca, Magnesium: Mg, and Sodium: Na) and climatic data (annual average precipitation: Prec, maximum temperature: Tmx, minimum temperature: Tm, global radiation: Rad, and relative humidity: RH) of each collection side.
Discussion
Variation in phytochemical contents among populations. The foliar and flower extraction yields obtained in the current study were higher than those reported by Alara et al. (2018) for Vernonia amygdalina leaves (18.79 %), but lower than that of the leaves of Arbutus unedo (Malheiro et al. 2012) (40.10 %). Extraction yields can be affected by the particular extraction conditions; therefore, it is necessary to use an appropriate method for each type of sample, considering the aim of the study, type of sample, and target compounds (Azwanida 2015).
The TPL and TPF contents found in the three analyzed populations were higher than those reported for other plant species of arid and semi-arid zones, such as Rhus tripartita (between 45.00 and 99.93 mg GAE/g dry extract) and Rhus pentaphylla (between 48.26 and 83.17 mg GAE/g dry extract) (Itidel et al. 2013), and also higher than the values reported for 15 inland halophyte from six different families analyzed from the central Balkan (31.86 to 212.71 mg GAE/g dry extract) (Stanković et al. 2015). Our results are in agreement with those of Dambolena et al. (2010), who found interpopulation differences in the phenolic content of oregano (Origanum vulgare L.). The chemical variation of phenolic contents among plant populations may represent adaptation mechanisms to survive under variable environmental conditions, as this type of phytochemicals is reported to play roles of defense against herbivores and UV radiation (Balasundram et al. 2006). In the current study, the significant differences of TPL between S1, considered as relict, and S2, considered a typical population of F. splendens subsp. splendens, besides the marked morphological differences, mainly in the length and width of the stems, observed during the field collections, suggests an important interpopulation genetic variability.
Both, TFLL and TCT concentrations of the relict and typical populations of F. splendens subsp. splendens (S1 and S2) were similar one to each other, and these two were different from those of F. splendens subsp. campanulata (S3). The above suggests that in the quantitative expression of foliar flavonoids and tannins, the environmental context has a less important participation than the genetic context. The TFLL and TFLF contents estimated in the current study were higher than those of Agave durangensis flowers (1,210.48 µg QE/g DE), which are edible and consumed in some semi-arid areas of Mexico (Barriada-Bernal et al. 2014), and also higher than those of Malpighia umbellata leaves (10.55 mg/g DE), a tropical species whose fruits are also edible (Vasavilbazo-Saucedo et al. 2018). Flavonoids are the best-known group of phenolic compounds, are found in practically all plant parts, and their human intake is related to health benefits (Seleem et al. 2017). These compounds play important roles in plants, such as protectors against solar UV radiation, pathogens, and herbivores (Falcone-Ferreyra et al. 2012). These functions are relevant in the arid environmental conditions where F. splendens occurs.
The TCT levels found in the leaves of the three analyzed populations of F. splendens were lower than those reported by Medini et al. (2014) for the leaves of Limonium delicatulum (23.2 and 4.87 mg/g dry weight, in flowering and vegetative stages, respectively), a species that grows in Tunisia, characterized by its resistance to harsh environmental conditions such as salinity, high temperatures, and water deficits. The differences between the tannin contents found here for the three populations of F. splendens and those reported for L. delicatulum (Medini et al. 2014) confirm the proposal of Couture et al. (2016) that tannin concentrations are highly variable among plant species and genotypes, influenced by genetic and environmental conditions.
Regarding the pigments of the flowers, the results (Table 3) suggest that in the determination of the flower color of F. splendens, anthocyanins have a more relevant role than carotenoids, as they are accumulated at considerably higher concentrations. The lower concentrations of anthocyanins and carotenoids in the pale-colored rose flowers of subsp. campanulata vs. the higher concentrations found in the two populations of subsp. splendens with strong red to reddish-orange flowers corroborate the known fact that anthocyanins are the main pigment giving red color, whereas carotenoids are the main pigment giving the yellow and orange colors (Zhu et al. 2010). For example, Berman et al. (2016) found that a combination of red anthocyanins and yellow carotenoids resulted in the orange color of cultivated Gentiana lutea L. var. aurantiaca. But this is not always the case in red plant structures, as in the red fruits of Malpighia emarginata, in which the major pigments were carotenoids (de Rosso et al. 2008). Therefore, it is possible that an analysis of other forms of the subspecies campanulata that have purple-pink flowers and white-colored flowers will show even lower proportions of carotenoids. Anthocyanins have been reported as pollinator attractant (Niu et al. 2017) and the need for an efficient pollinator attraction as the probably force, driving the evolution of flower color appearance (Seitz et al. 2015). The current results revealed the flowers of F. splendens as an important source of anthocyanins, which were recently reported as improvers of glucose intake in human skeletal muscle cells (Ho et al. 2017) with a higher bioavailability than it was supposed (Kay et al. 2017).
Variation in the phenolic profile. The results of the FTIR-ATR analysis of foliar and floral extracts revealed in both tissues types a characteristic absorption broad band at 3,337 cm-1, which correspond to hydroxyl stretching (-OH) of molecules as water and ethanol. The bands at 2,924 and 2,855 cm-1 were due to C-H asymmetric and symmetric stretching vibrations of CH2 groups. Low-intensity overlapping bands are also detected confirming the presence of CH3 groups. The strong band at 1,709 cm-1 was attributed to stretching vibration of C═O in ester and carboxylic acid groups. Bands between 1,722 and 1,702 cm-1 are associated with hydrolysable tannins, especially gallic acid derivatives. The band at 1,609 cm-1 indicated the vibration of C═C in aromatic compounds, whereas the signals at 1,535 and 1,512 cm-1 were due to stretching of aromatic rings (Grasel et al. 2016, Murugan & Mohan 2014). The bands at 1,347 cm-1, only detected in leaf extracts, are attributed to stretching of the C-O of pyran present in flavonoid C-rings, which could indicate the presence of condensed tannins, since those compounds absorb between 1,361 and 1,340 cm-1 (Grasel et al. 2016). A strong band was observed at 1,310 cm-1, corresponding to the C-O stretching and O-H in-plane bending vibration (couple), due to the presence of phenolic compounds. The intense signals at 1,194 and 1,030 cm-1 were attributed to ring vibrations that overlapped with C-OH and C-O-C glycosidic stretching vibrations. The bands at 947, 870 and 830 cm-1 could indicate glycosylation patterns (Luo et al. 2011).
The FTIR-ATR spectra of foliar and floral extracts were quite similar, indicating the presence of phenolic compounds in both types of tissues. Besides, a practically exact match for the foliar FTIR spectra of the two populations of F. splendens subsp. splendens (S1 and S2) and the population of F. splendens subsp. campanulata (S3) was found. The same was observed for the floral FTIR-ATR spectra (Figure 1). These results indicate that the relict condition of S1 has not had any impact in the synthesis of phenolic compounds and that the foliar and floral qualitative phenolic composition is highly conserved in these two subspecies of F. splendens, what could be associated to the important roles that phenolics play in plants.
The results of the HPLC-DAD analysis of the foliar and floral tissues of Fouquieria splendens revealed this species as a rich source of phenolic compounds. Flavonols (a myricetin derivative, rutin, and a quercetin-3-O-glycoside) were the major phenolics in leaves, whereas phenolic acids were the major phenolic compounds in flowers.
The current results are partially in agreement with those published by Scogin (1978), who also found ellagic acid, in addition to the flavonols isoquercitrin and rutin, caffeic acid, and scopoletin (a coumarin) in the leaves of F. splendens cultivated in California. Contrary to the results of Scogin (1978), neither coumarin nor caffeic acid but a myricetin derivative (5) and a higher number of phenolic acids were found in the current study. These differences may be the result of variations in the methods of analysis used in each study. However, as a species-specific trend has been reported for the phenolic profiles (Medina-Medrano et al. 2015, Ávila-Reyes et al. 2018), which result of genetic differences, commanding a defined sequential order in the biosynthesis pathway, which is specific for each plant species (Heller & Forkmann 1994), the inconsistencies between the reports of the phenolic composition of F. splendens from different geographical occurrence need to be revised.
Scogin (1977) reported the anthocyanin composition of the floral tissue of 11 species of Fouquieria. However, except for quercetin, mentioned in a concise report by Domínguez et al. (1972), to the best of our knowledge, the presence of phenolics other than anthocyanins in the flowers of species of Fouquieria had not been reported. The current results are in disagreement with those of Domínguez et al. (1972), who reported quercetin (a flavonol aglycone) in the flowers of F. splendens.
The significant variations found in the concentration of foliar and floral individual phenolic compounds (Table 4) were in agreement with the proposal that for a given species, under changing environmental conditions the main changes occur in the concentration of individual phenolics, keeping the qualitative composition stable (Veit et al. 1995).
The myricetin derivative (5) was accumulated more than twice in plants from S2 than in plants from S1 and S3; rutin (6) was accumulated more than twice in plants from S3 than in plants from S1 and S2; and a quercetin-3-O-glycoside (8) was accumulated around more than twice in plants from S2 than in plants of S1 and S3. These quantitative phenolic differences may have ecological and geographic relevance.
Unlike foliar tissues, flowers accumulated no quercetin derivative but a kaempferol derivative, and in flowers, the major compounds were not flavonoids but phenolic acids (Table 4). Plants from S1 accumulated 1.31 and 2.39 times more of the phenolic acid 19 than plants from S2 and S3, respectively. Other flowers rich in phenolic acids were those of Chrysanthemum morifolium Ramat, for which Lin & Harnly (2010) reported seventeen, and those of Litchi chinensis Sonn. for which Chen et al. (2011) reported 10 phenolic acids, varying in concentrations between 0.28 and 35.34 mg/g dry extract. The current results suggest that phenolic acids may have important ecophysiological roles in the flowers of F. splendens. Ellagic acid has been reported as a potential agent to treat certain chronic diseases, such as ulcerative colitis, Cronh’s disease, Alzheimer’s disease, diabetes, hepatic disorders, and cancer; this compound is a derivative of gallic acid, which usually is accumulated as glycoside or as part of the ellagitannins, in fruits, vegetables, nuts, and wine (Derosa et al. 2016). Ellagic acid was found in leaves and flowers of both subspecies analyzed of F. splendens.
The differences in contents of foliar and floral total phenolics, flavonoids, tannins, anthocyanins, carotenoids, as well as the differences in the concentration of individual compounds, allowed to distinguish the two subspecies of F. splendens and also the two populations of F. splendens subsp. splendens analyzed by PCA and clustering. The separation of S1 and S2 inside the group 2 (Figure 4A), indicated that differences in the accumulation of phenolics have emerged between the relic and the typical populations of F. splendens subsp. splendens, which allow their differentiation. The chemical differences found among the populations analyzed may be the results of the different environmental conditions under which each one grows, as environmental factors have been reported to alter the expression of genes involved in the synthesis of phytochemicals (Gallusci et al. 2017).
Chemical variation related to geographic variation (representing different environmental conditions) has been reported for several plant species, as the quantitative phenolic variation found between populations of Pinus halepensis (Kaundun et al. 1998) and the qualitative and quantitative phenolic differences found between populations of Thymus capitatus (Jaouadi et al. 2018). However, studies on the chemical distinctiveness of relict plant species are scarce, and to the best of our knowledge, phenolic composition of relict plant populations has not been reported. One study, concerning relict plant species, is that of Nikolić et al. (2011), who determined the terpene differences between the relict Picea omorica, Pinus heldeichii, and Pinus peuce, founding qualitative and quantitative variations.
Relationship between phytochemicals and environmental variables. The high correlation coefficient obtained from the Mantel test suggests that the geographical distribution is associated with the concentration of secondary metabolites among populations. Thus, the population located toward southern latitudes (S1) accumulated higher levels of phenolics than the populations located toward the northeast (S2 and S3). Our results are in agreement with those of del Valle et al. (2015), who also found a similar trend for Silene littorea populations. However, the evolutionary and taxonomic differences among the three Fouquieria splendens populations may have also made an important contribution to the chemical variations found in the current study.
The climatic conditions were similar in each collection site (Table 1). Prec, Rad, and RH showed no significant differences, but differences in Tmx and Tm were observed. Warmer temperatures were registered in S1, whereas the lowest in S1 and S3. Previous reports have informed that temperature (Liu et al. 2016, Ben Ahmed et al. 2017) and soil features (Borges et al. 2013) are important factors regulating the synthesis of phenolic compounds.
Fouquieria splendens has a shallow root system, which allows it to grow on rocky, well-drained calcareous soils of limestone or granite origin, frequently supported by caliche (Ladyman 2004). This type of soil is common in arid and semiarid regions and is characterized by high amounts of calcium and pH between 7.5 and 8.5 (Zhang et al. 2015). An important factor that contributes to regional endemic diversity is the adaptation of plants to unusual soils, such as calcareous soils (Aguirre-Liguori et al. 2014). It has been shown that in calcareous soils P deficiency is frequent, since the presence of calcium carbonate (CaCO3) decreases the solubility of this element, affecting its availability and therefore the yield of plants; deficiencies of iron (Fe), manganese (Mn) and zinc (Zn) have also been observed in calcareous soils (Labidi et al. 2012). Our results showed that the soils of S1, S2, and S3 are nutrient-deficient. The mechanisms of adaptation to poor nutrients soils and drought have caused that ocotillo shed their leaves when soil moisture is depleted, in this manner, conserving nutrients (Killingbeck 1992). Soil chemical composition affects plant nutrient balance and this, in turn, influences the synthesis of secondary compounds. The limitation of available phosphate, for example, increase the levels of proanthocyanins, whereas the low levels of iron increase the synthesis of phenolic compounds (Ncube et al. 2012).
The CCA revealed that the clear discrimination among the analyzed populations of F. splendens was related to soil parameters and that the soil features were important factors determining the synthesis of phenolics and carotenoids of these populations. The main soil features determining chemical differences were soil texture, EC, OM, OC, Ca and Na.
Our results are in agreement with those of Sampaio et al. (2016), who reported that the variation of Ca, Mg, P, K, and Cu in soil affected the distribution of secondary metabolites in the inflorescences and roots of populations of the Mexican sunflower (Tithonia diversifolia). However, it must be taken into account that the evolutionary and taxonomic differences arisen among the three studied Fouquieria splendens populations may have also done an important contribution to the chemical variations.
The epigenetic and genetic contexts (not considered in the current study) are also important factors determining chemical variation in plants, as represent a mechanism of adaptation to biotic and abiotic factors (Moore et al. 2014, Gutiérrez-Velázquez et al. 2018). For example, the variation of terpene composition from different cultivars of the American ginseng (Panax quinquefolius L.) was related to genotypic variability (Schlag & McIntosh 2013).
Knowing and understanding the environmental factors linked to the variations of plant chemical composition may contribute to find alternatives to increase plant productivity, especially in species of food and medicinal interest, as Pavarini et al. (2012) pointed out. Besides, chemical typifications are required to understand the ecological interactions between plants and environment, develop strategies of rational exploitation, and develop a chemical fingerprinting for their integral use.
Our results are a contribution to the knowledge on the diversity and abundance of phytochemicals of wild plants of arid zones and the environmental factors responsible for the chemical variations. Our results also represent a contribution to the understanding of the differences among plants of a relict population of F. splendens subsp. splendens and plants of the same subspecies growing in a large population.

