


 nueva página del texto (beta)
 Inglés (pdf)
 Artículo en XML
 Referencias del artículo
 Enviar artículo por email
 Citado por SciELO
  Similares en
SciELO
Similares en
SciELO 
 Permalink
Ecological studies that describe the variation of both structure and floristic composition along an altitudinal gradient are common in mountainous areas of many parts of the world (Vetaas & Grytnes 2002, Gould et al. 2006, Alves et al. 2010). Although in Mexico these studies are not abundant, some have been carried out, such as: Sierra de Catorce in San Luis Potosi (Granados-Sánchez & Sánchez-González 2003) and Sierra Nevada in Mexico state (Sánchez-González & López-Mata 2003). However, in Northwest Mexico, particularly Baja California the information is scarce.
The Baja California Peninsula includes mountainous massifs throughout its territory, the southern part known, as the Cabo Region is perhaps the most interesting due to its floristic, biogeographic and evolutionary characteristics (Wiggins 1980, León de la Luz & Domínguez-Cadena 1989). In this area is located the Sierra La Laguna, which is considered an "island of vegetation" within the environment characterized by arid areas (Padilla et al. 1988). The biophysical characteristics of this mountain area justified the creation of the Sierra La Laguna Biosphere Reserve in 1994 (CONANP, 2003).
The Sierra La Laguna includes six main vegetation types (sarcocaule and sarcocrasicaule scrub, deciduous and semi deciduous lowland rainforest, oak forest, pine-oak forest, gallery forest and natural grassland), although the mesic and tropical communities are considered of greater relevance (Arriaga & León-de la Luz 1989, CONANP 2003). From a floristic point of view, this reserve has been well studied since 1892, registering more than 900 species of vascular plants of which, about 89 are endemic (León-de la Luz & Domínguez-Cadena 1989, León de la Luz et al. 1999, CONANP 2003, León-de la Luz & Breceda 2005). However, ecological studies of vegetation have not been abundant and are restricted usually to conservation and phytogeographic studies (León-de la Luz et al. 2000, León-de la Luz & Breceda 2005).
Considering that this protected natural area has an altitudinal gradient that ranges from 500 to 2,100 meters above sea level (CONANP 2003) and that until now, the vegetation communities with these specific characteristics have not been compared, this study was proposed. The objective of this study was to evaluate the structural variables of abundance (N ha-1), basal area (m2 ha-1) and diversity (alfa and beta) of arboreous species in areas with different elevations in the Sierra La Laguna Biosphere Reserve. The results of this study are expected to confirm the hypothesis that establishes that higher altitudinal gradient decreases abundance, basal area and diversity of plant species.
Materials and methods
Study area. This study was carried out in four localities (Las Tinajas, El Portezuelo, Agua Blanca and El Parteaguas) of the tropical deciduous forest and broadleaved forest of the Sierra La Laguna Biosphere Reserve in the municipalities of La Paz and Los Cabos, Baja California Sur (Northwest Mexico; Figure 1). The study area is located on 23º 24’ 11.63’’ N and 110º 4’ 49.54’’ W. Table 1 shows some physical and climatic variables as a description of the studied areas.
Table 1 Physical and climatic characteristics of the areas.
| Locality | Las Tinajas | El Portezuelo | Agua Blanca | El Parteaguas |
|---|---|---|---|---|
| Altitudinal Gradient | I | II | III | IV |
| Vegetation | Tropicaldeciduous forest | Tropicaldeciduous forest | Broadleaved forest | Broadleaved forest |
| Abbreviation | SBC | SBC | BL | BL |
| Coordinates | 23° 24’ 50.8’’ N 109°57’27.2’’W |
23° 25’ 26.3’’ N 109°58’48.0’’W |
23° 25’ 52.5’’ N 109° 57’ 36.3’’W |
23° 27’ 01.8’’N 109° 58’ 05.1’’ W |
| Altitude (m a.s.l.) | 508 | 1,032 | 1,092 | 1,521 |
|
Average annual temperature (°C) |
27 to 31 | 18 to 25 | 16 to 22 | 12 to 18 |
| Average annual rainfall (mm) | 75 to 150 | 200 to 300 | 200 to 300 | 300 to 400 |
| Soil type | Vertisol | Regosol, Vertisol | Regosol, Vertisol | Regosol |

Figure 1 Study area (Left side: the four localities studied; Upper-right: Northwest Mexico; Lower-right: Baja California Sur, Mexico.
Sampling method. In the spring of 2016, five circular sampling plots of 500 m2 for arboreous vegetation and 1.0 m2 for herbaceous vegetation were established in every vegetation community, resulting in 20 sampling plots. A distance of 50 meters between sampling plots on each vegetation community was established in order to avoid differences on physical and climatic characteristics. Individuals with diameters higher than 7.5 cm and heights above 1.30 m, were considered arboreous. The diameter and taxonomical information of each specimen was obtained.
Data analysis. In order to evaluate the importance of the species using the information obtained from the sample plots, the Importance Value Index (IVI) was calculated. The Importance Value Index defines which species contributes to the characteristics and structure of the ecosystem (Cottam & Curtis 1956), and is calculated as showed in Formula 1. Where, Relative Abundance (A rel ) that is, the percentage of number of individuals of each species in relation to the total number of individuals of all species per 100; Relative dominance (D rel ) that is, the percentage of basal area of a species between the basal area of all the species in the sampling plot per 100, and Relative Frequency (F rel ) that is, the percentage of subplots in which the species appears in relation with the frequency of all species per 100 (Dombois & Ellenberg 1974, Mostacedo & Fredericksen 2000).
To evaluate the alpha diversity the Index of Shannon-Weaver (H’) was used. This Index considers that individuals are shown randomly from an infinitely large population and assumes that all species are represented in the sample (Shannon & Weaver 1949; Magurran 1988).
where S is the number of species; p i is the proportion of the species and p i =n i /N; n i is the number of individuals of the species i and N the total number of individuals.
To calculate the species richness in the study area, the Margalef index (DMg) (Margalef 1958) was used, which is the simplest way to measure biodiversity (Moreno 2001). Particularly, this index is one of the most used and is defined as follows:
where S is the number of species and N is the total number of individuals.
Statistical tests were carried out to verify that all the assumptions of the residuals were fulfilled, normality test by means of Shapiro-Wilk and the homogeneity of variances by the Levene test, both with a degree of significance (p < 0.05). After the assumptions were fulfilled, an analysis of variance (ANOVA) of a single factor (Altitude) for Shannon-Weaver index, Specific Richness, Abundance and Dominance was performed. The Duncan test was used to determine if there were significant differences (p < 0.05) of the variables analyzed by altitude group. Tests were performed using the IBM© SPSS© Statistic version 19 (Zar 2010).
To evaluate the beta diversity, a Bray-Curtis ordering model was generated using BioDiversity Pro 2.0 (McAleece et al. 1997); this model is a graphic representation of the variation of plant composition (0-100 %) in an extent of distance (Beals 1984). The Bray-Curtis ordering model is the most appropriate when a multivariate phytosociological analysis is needed.
Results
Sixteen families, 22 genera and 22 vascular plant species were recorded (Appendix 1). The most diverse family was Fabaceae with four species, followed by Cactaceae with three species.
Abundance. The most abundant species in the altitudinal gradients were shrubs, agaves and cacti. In the altitudinal gradient I (altitude 508 m a.s.l.), the most abundant species were Mimosa xanti (300 N ha-1), Ruellia californica (300 N ha-1) and Jatropha cinerea (240 N ha-1). In the altitudinal gradient II (altitude 1032 m a.s.l.) were Agave promontorii (360 N ha-1), Lysiloma divaricatum (240 N ha-1) and Ruellia californica (210 N ha-1). In the altitudinal gradient III (altitude 1092 m a.s.l.) Tecoma stans (540 N ha-1), Dodonaea viscosa (490 N ha-1) and Lysiloma divaricatum (440 N ha-1). In the altitudinal gradient IV (altitude 1,521 m a.s.l.) Ruellia californica (256 N ha-1), Turnera diffusa (253 N ha-1) and Jatropha cinerea (250 N ha-1). From the three most abundant species in each altitudinal gradient, the altitude one and four share Ruellia californica and the altitude II and III share Lysiloma divaricatum.
Dominance: The arboreal Quercus tuberculata was the most dominant species in the altitudinal gradients I, III and IV and the second in gradient II. The space occupied by this species ranged from 4.5 m2 ha-1 (altitudinal gradient I) to 22.3 m2 ha-1 (altitudinal gradient III). The second most dominant species in the altitudinal gradient one and four is Bursera microphylla. The space occupied by this species ranged from 3.4 m2 ha-1 (altitudinal gradient I) to 4.3 m2 ha-1 (altitudinal gradient IV).
Frequency: In altitudinal gradients II, III and IV, the most frequent species were Mimosa xanti with 13.8 %, 17.1 % and 17.3 % respectively. In altitudinal gradient I the most frequent species were Bursera microphylla (14.7%), Jatroha cinerea (13.9 %) and Quercus tuberculate (13.9 %).
Importance value index (IVI): The species with the highest value of IVI in the altitudinal gradient I were: Mimosa xanti (13.6 %), Ruellia californica (13.6 %) and Jatropha cinerea (10.9 %). In the altitudinal gradient II: Agave promontorii (18.9%), Lysiloma divaricatum (12.8 %) and Ruellia californica (11.0 %). In the III: Tecoma stans (16.8 %), Dodonaea viscosa (15.3 %) and Lysiloma divaricatum (13.9 %). In the IV: Ruellia californica (11.2 %), Jatropha cinerea (11.1 %) and Brahea brandegeei (11.0 %). The three species with higher IVI and abundance in each altitudinal gradient, gradient I and IV share Jatropha cinerea, and gradient II and III share Lysiloma divaricatum (Table 2).
Table 2 Abundance (N ha-1), dominance (m2 ha-1), frequency (Freq ha-1) and Importance Value Index by altitudinal gradient (Species data is arranged in decreasing order according with IVI values).
| Abundance | Dominance | Frequency | IVI | ||||
|---|---|---|---|---|---|---|---|
| Species | Abs | Rel | Abs | Rel | Abs | Rel | Rel |
| N ha-1 | % | m2 ha-1 | % | Freq ha-1 | % | % | |
|
Altitudinal gradient I (508 m a.s.l.) |
|||||||
| Mimosa xanti | 300 | 13.8 | 0.2 | 1 | 0.3 | 6.9 | 13.6 |
| Ruellia californica | 300 | 13.8 | 0.2 | 0.9 | 0.2 | 3.5 | 13.6 |
| Jatropha cinerea | 240 | 11 | 0.3 | 1.4 | 0.6 | 13.9 | 10.9 |
| Lysiloma divaricatum | 176 | 8.1 | 2.9 | 13.1 | 0.2 | 4.6 | 8.1 |
| Quercus tuberculata | 170 | 7.8 | 4.5 | 20.5 | 0.6 | 13.9 | 7.9 |
| Viguiera deltoidea | 170 | 7.8 | 2 | 9.2 | 0.2 | 4.6 | 7.8 |
| Stenocereus thurberi | 160 | 7.3 | 2.4 | 10.7 | 0.4 | 9.3 | 7.4 |
| Karwinskia humboldtiana | 140 | 6.4 | 0.2 | 1 | 0.4 | 9.3 | 6.4 |
| Randia capitata | 120 | 5.5 | 0.3 | 1.1 | 0.3 | 7.7 | 5.5 |
| Bursera microphylla | 113 | 5.2 | 3.4 | 15.6 | 0.6 | 14.7 | 5.3 |
| Agave promontorii | 110 | 5 | 1.5 | 6.8 | 0.2 | 4.6 | 5.1 |
| Brahea brandegeei | 100 | 4.6 | 3.1 | 13.8 | 0.1 | 2.3 | 4.7 |
| Opuntia lagunae | 80 | 3.7 | 1 | 4.7 | 0.2 | 4.6 | 3.7 |
| Subtotal | 2179 | 100 | 22.2 | 100 | 4.3 | 100 | 100 |
|
Altitudinal gradient II (1,032 m a.s.l.) |
|||||||
| Agave promontorii | 360 | 19.2 | 0 | 0 | 0.2 | 3.9 | 18.9 |
| Lysiloma microphyllum | 240 | 12.8 | 3.4 | 13.1 | 0.4 | 6.9 | 12.8 |
| Ruellia californica | 210 | 11.2 | 0 | 0 | 0.2 | 3.9 | 11 |
| Mimosa xantii | 160 | 8.5 | 1.2 | 4.4 | 0.7 | 13.8 | 8.5 |
| Tecoma stans | 115 | 6.1 | 0.6 | 2.1 | 0.3 | 4.9 | 6.1 |
| Jatropha cinerea | 110 | 5.9 | 0.3 | 1.1 | 0.4 | 8.4 | 5.8 |
| Randia megacarpa | 110 | 5.9 | 0.2 | 0.6 | 0.4 | 8.6 | 5.8 |
| Quercus tuberculata | 100 | 5.3 | 6.3 | 24.2 | 0.6 | 11.8 | 5.6 |
| Viguieria deltoidea | 100 | 5.3 | 0.6 | 2.3 | 0.2 | 3.9 | 5.3 |
| Bursera microphylla | 80 | 4.3 | 1.9 | 7.3 | 0.6 | 11.8 | 4.3 |
| Pachycereus pringlei | 80 | 4.3 | 1.3 | 5.1 | 0.1 | 2 | 4.3 |
| Stenocereus thurberi | 53 | 2.8 | 0.7 | 2.8 | 0.4 | 7.9 | 2.9 |
| Opuntia laguneae | 47 | 2.5 | 0.2 | 0.6 | 0.2 | 3.9 | 2.5 |
| Yucca valida | 40 | 2.1 | 7.2 | 27.5 | 0.1 | 1 | 2.5 |
| Karwinskia humboldtiana | 30 | 1.6 | 0.7 | 2.6 | 0.3 | 5.4 | 1.6 |
| Erythrina flabelliformis | 20 | 1.1 | 1.6 | 6.2 | 0.1 | 1 | 1.1 |
| Lippia palmeri | 20 | 1.1 | 0 | 0.1 | 0.1 | 1 | 1.1 |
| Subtotal | 1875 | 100 | 26.1 | 100 | 5.1 | 100 | 100 |
|
Altitudinal gradient III (1,092 m a.s.l.) |
|||||||
| Tecoma stans | 540 | 17.1 | 0.8 | 1.5 | 0.3 | 6.1 | 16.8 |
| Dodonaea viscosa | 490 | 15.5 | 0.6 | 1.2 | 0.4 | 8.5 | 15.3 |
| Lysiloma divaricatum | 440 | 13.9 | 7.1 | 13.3 | 0.4 | 8.5 | 13.9 |
| Ruellia californica | 370 | 11.7 | 0.3 | 0.5 | 0.2 | 4.9 | 11.5 |
| Stenocereus thurberi | 360 | 11.4 | 7 | 13.1 | 0.4 | 9.8 | 11.4 |
| Quercus tuberculata | 250 | 7.9 | 22.2 | 41.4 | 0.6 | 14.6 | 8.5 |
| Jatropha cinerea | 240 | 7.6 | 0.3 | 0.6 | 0.5 | 12.2 | 7.5 |
| Mimosa xanti | 230 | 7.3 | 5.9 | 10.9 | 0.7 | 17.1 | 7.4 |
| Bursera microphylla | 160 | 5.1 | 2.6 | 4.9 | 0.6 | 14.6 | 5.1 |
| Senna atomaria | 40 | 1.3 | 5.6 | 10.4 | 0.1 | 1.2 | 1.4 |
| Pachycereus pringlei | 40 | 1.3 | 1.1 | 2.1 | 0.1 | 2.4 | 1.3 |
| Subtotal | 3160 | 100 | 53.6 | 100 | 4.1 | 100 | 100 |
|
Altitudinal gradient IV (1,521 m a.s.l.) |
|||||||
| Ruellia californica | 256 | 11.3 | 0.1 | 0.8 | 0.2 | 4.9 | 11.2 |
| Turnera diffusa | 253 | 11.2 | 0 | 0 | 0.2 | 3.7 | 11.1 |
| Jatropha cinerea | 250 | 11.1 | 0.3 | 1.3 | 0.4 | 9.9 | 11 |
| Dodonaea viscosa | 207 | 9.2 | 0.1 | 0.6 | 0.4 | 8.6 | 9.1 |
| Quercus tuberculata | 190 | 8.4 | 7.8 | 40.1 | 0.6 | 14.8 | 8.7 |
| Mimosa xanti | 192 | 8.5 | 0.2 | 0.9 | 0.7 | 17.3 | 8.5 |
| Bursera microphylla | 180 | 8 | 4.3 | 22.3 | 0.6 | 14.8 | 8.1 |
| Merremia aurea | 150 | 6.6 | 2.2 | 11.4 | 0.1 | 2.5 | 6.7 |
| Randia capitata | 140 | 6.2 | 0.3 | 1.7 | 0.2 | 4.9 | 6.2 |
| Viguiera deltoidea | 140 | 6.2 | 0.2 | 1 | 0.2 | 4.9 | 6.2 |
| Agave promontorii | 140 | 6.2 | 0 | 0 | 0.2 | 4.9 | 6.1 |
| Brahea brandegeei | 80 | 3.5 | 2.5 | 12.8 | 0.1 | 2.5 | 3.6 |
| Stenocereus thurberi | 80 | 3.5 | 1.4 | 7 | 0.3 | 6.2 | 3.6 |
| Subtotal | 2258 | 100 | 19.4 | 100 | 4.1 | 100 | 100 |
The values of the Shannon-Weaver index, Margalef index, abundance and dominance showed significant differences in the altitudinal gradients (p < 0.05), not showing any tendency of decrease or increase of the values as the altitudinal gradient increased. The altitudinal gradient III presented the lowest values of Shannon-Weaver and Margalef index values and the highest values of abundance and dominance (Figure 2).
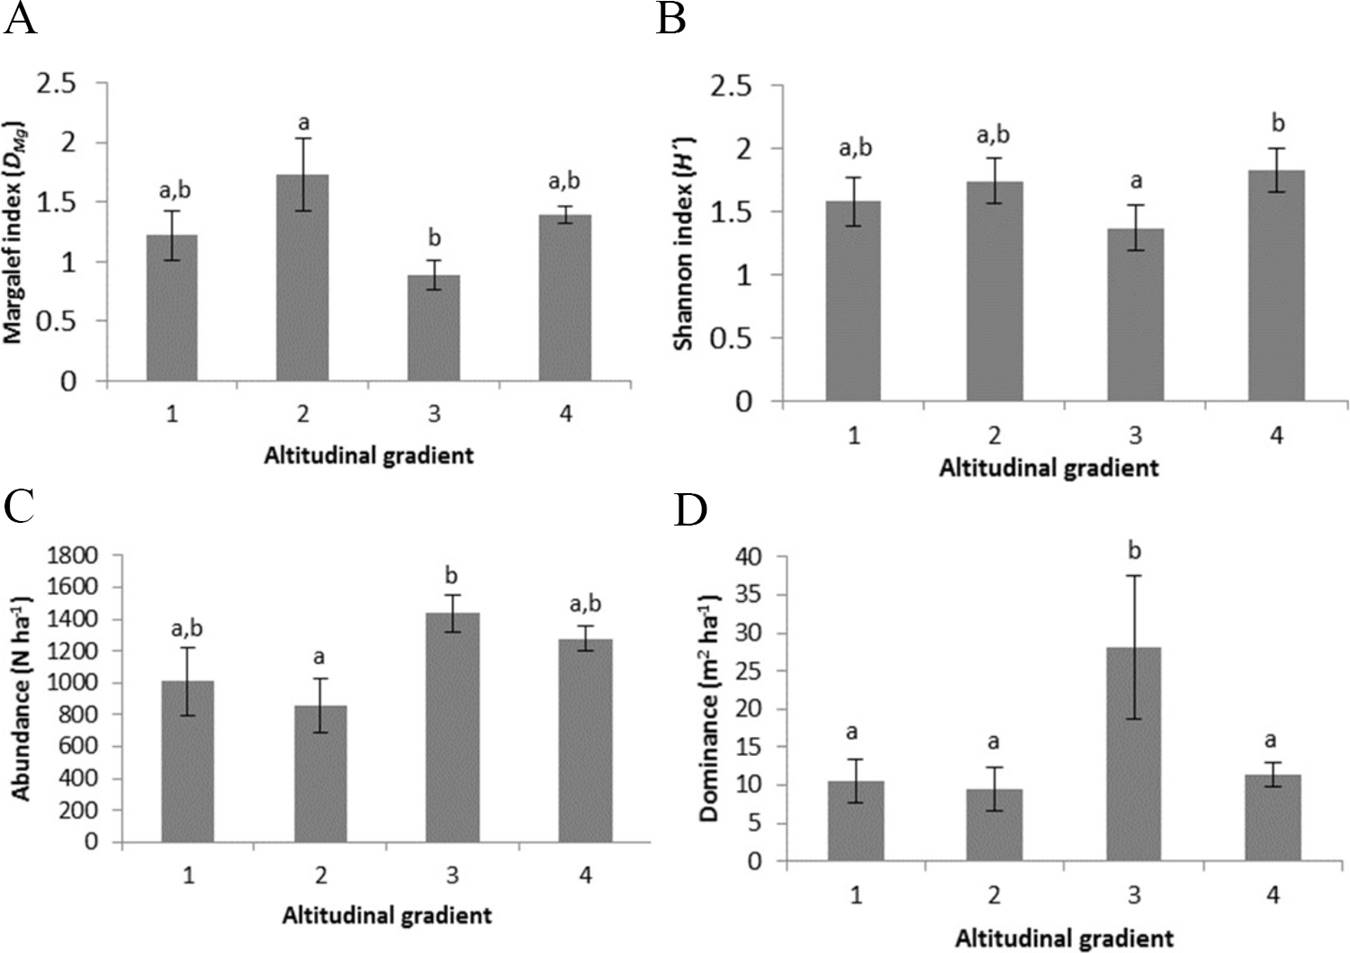
Figure 2 Means and standard error of A) Margalef index, B) Shannon index, C) Abundance and D) Dominance for plant communities in the altitudinal gradients. Altitudinal gradient 1: 508 m a.s.l., 2: 1,032 m a.s.l., 3: 1,092 m a.s.l. and 4: 1,521 m a.s.l. Means followed by different letters (a and b) indicate different levels of significance for p < 0.05.
The values of the Shannon index showed average values that range between 1.37 ± 0.17 and 1.83 ± 0.15 (± standard deviation). The values of the Margalef Index were between 0.89 ± 0.27 and 1.73 ± 0.70. The abundance showed values from 856 ± 375 N ha-1 to 1436 ± 255 N ha-1 and the dominance of 9.57 ± 6.4 to 28.1 ± 21.04 (Figure 2).
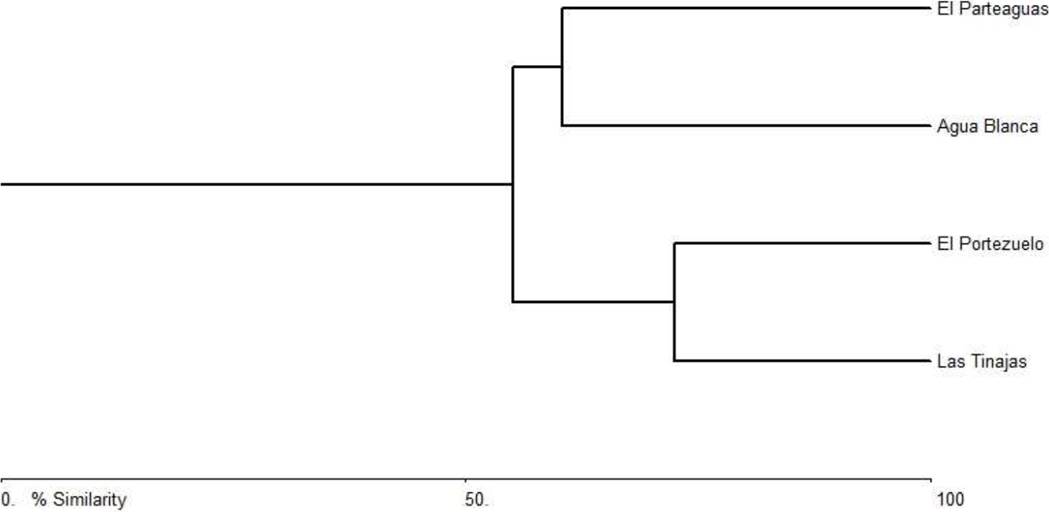
The dendrogram of plant communities depending on altitudinal ranges can be observed in Figure 3. In general, a high similarity is present among communities. In the first group (that joins the other two) exists a 55 % of similarity, the gradient III and IV have a similarity of 60 % and I and II of 72 %. This analysis indicates that plant communities have a high number of species in common, which could be considered generalist, since they have the capacity to develop in a wide range of environmental conditions (Figure 3).
Discussion
Species richness-elevation relationships have received considerable attention during the last two decades, as a response to the major challenge of documentation and explanation of global and regional gradients of species richness (Kessler et al. 2011, Trigas et al. 2013). Most studies indicate that vascular plants show a decrease in species richness as elevation increases, either in a hump-shaped or monotonically (Bachman et al. 2004, Wang et al. 2007).
Climatic factors play an important role in the distribution of plant communities (Rüdiger et al. 2001). In dry regions, the floristic composition and the structure of the vegetation are determined mainly by water availability, so it is assumed that this is the main limiting factor in these regions (Paruelo et al. 2000, Tateno et al. 2017). The availability of water is directly related not only to the annual rainfall, but also to factors such as topography and soil characteristics since they play an important role (Reynolds et al. 2000, Tateno et al. 2017). Altitude represents a complex combination of climatic variables to which the species have to adapt and is considered an environmental factor that affects the structure and organization of the communities (Pavón et al. 2000, Rüdiger et al. 2001). The variables of average annual temperature and total annual precipitation are significantly correlated with altitude (Wang et al. 2015).
The results obtained indicated that in Sierra de la Laguna, different plant communities can be recognized physiognomically along the altitudinal gradient, which had already been mentioned in the Management Program of National Protected Areas (CONANP, 2003). Five species (Erythrina flabelliformis, Lippia palmeri, Senna atomaria, Turnera difusa and Yucca valida) that are distributed only in a single altitudinal gradient were recorded and all of them have low importance value index values. In contrast, there are five species (Ruellia californica, Jatropha cinerea, Quercus tuberculata, Mimosa xanti and Bursera microphylla) with presence in all altitudinal gradients and have intermediate or high values of importance value index. Arriaga and León (1989) also recorded Jatropha cinerea and Bursera microphylla as species with high density and coverage in lowland rainforest of Baja California.
Because there is a high number of species in all studied communities and all showed high abundance values, there is a high similarity between the composition of species in the communities (≥ 55 % in all cases), which could be considered generalist, since they have the capacity to develop in a wide range of environmental conditions.
The topographic pattern of “Sierra La Laguna” have different characteristics, in higher altitude parts there are very steep slopes, in intermediate altitude sites slopes are less inclined and the lower altitudes are constituted of expositions with scarce slopes because are located at sea level. The topographical variation (longitude, form and inclination of slope) is attributed to humidity distribution so that higher parts retain less humidity. The Föhn effect that is characterized by an increase in evaporation rate and a decrease in relative humidity is an important factor in the physiognomy and distribution of plant communities, since it affects considerably the availability of water and temperature (Zhao et al., 2018). The rainfall is other important factor because occurs in very low amounts, which influences the development of vegetation.
In this study, the values of Shannon-Weaver Index and Margalef Index showed significant differences in the altitudinal gradients but did not show any increasing or decreasing tendency of values as the altitudinal gradient increased. This information is different from the results of numerous authors that reported a decreasing of species and diversity richness as the altitudinal gradient increases (Vetaas & Grytnes 2002, Gould et al. 2006). An explanation of why in our study there no trends of declining values as altitude are increased, can be related to temperature and precipitation influences. Table 1 illustrates the average values of the temperature and indicate that even the maximum altitude (1,521 m a.s.l.) show values above the freezing point, which gives the environmental conditions to develop a high variety of species. In addition, all altitudinal gradients are arid (precipitation less than 400 mm), which led to the conditions for establishing this generalist species adapted to arid zones.
In accordance to the results of this research, the hypothesis is rejected because abundance, dominance and diversity of vegetation species do not show any decrease (or increase) tendency of values as the altitudinal gradient augmented. The vegetation communities showed a high similarity in the composition of species (≥ 55 %), because Ruellia californica, Jatropha cinerea, Quercus tuberculata, Mimosa xanti and Bursera microphylla are dominant species and are distributed in all altitudinal gradients.

