


 nueva página del texto (beta)
 Inglés (pdf)
 Artículo en XML
 Referencias del artículo
 Enviar artículo por email
 Citado por SciELO
  Similares en
SciELO
Similares en
SciELO 
 Permalink
Riparian zones are recognized in landscapes as interfaces between terrestrial and aquatic ecosystems (Gregory et al. 1991). Riparian vegetation performs important ecological functions such as provision of habitat and food for many species, regulation of shade and water temperature, control of nutrient and sediment input into streams, provision of corridors for the movement of biota, and stabilization of riverbanks (Naiman & Décamps 1997, Ewel et al. 2001, González del Tánago & García de Jalón 2007). In addition, riparian zones provide spaces for recreational purposes (Naiman et al. 2005). While riparian environments are among the most diverse and complex biophysical ecosystems (Naiman et al. 1993), they are one of the most disturbed by land use change (Charron et al. 2008). Conversion of native vegetation as result of land use may be a valuable indicator of human disturbance and ecosystems condition (Wardrop et al. 2005). Responses of ecosystems to such conversions can vary depending on the type of land use change and the spatial and temporal scales (Defries et al. 2004).
At the landscape level, land use changes can alter water chemistry and the hydrological and physical conditions of the habitat, with repercussions for the biological integrity of fluvial ecosystems (Allan 2004). At the local level, vegetation is one of the most susceptible elements influenced by management and land use practices (Van de Kamp et al. 2013) and, among riparian plant communities, woody vegetation exhibits the strongest relationship with physical factors (Lyon & Gross 2005). Alterations in the vegetation community can occur due to introduction of exotic species (Naiman et al. 2005), or through decline in species diversity and canopy coverage (Moffatt et al. 2004).
In urban–rural contexts, riparian zones often show a severe degree of disturbance associated with human activity. Riparian vegetation of small streams draining rural and urban areas is usually removed as result of utilizing this space for human development (Reis et al. 2015). The rural–urban gradient perspective considers human influence in a continuous decrease, from urban centers to more natural zones; this results in a larger geographical scale that enables accommodation of a city and its surroundings in a particular study (Niemelä 1999). This approach recognizes that urbanization affects both the physical structure and the biotic components of the ecosystem (McDonnell & Pickett 1990).
The Sabinal River basin, in southern Mexico, represents a useful system in which to study riparian zones in an urban-rural context. This watershed has undergone important alterations in its riparian vegetation due to fragmentation and land use change (Pineda-López et al. 2015). As part of a metropolitan phenomenon that involves the incorporation of contiguous municipalities into a central city (SEDESOL et al. 2012), this watershed is embedded within the metropolitan zone of Tuxtla Gutiérrez, capital city of Chiapas State. The process of urbanization has transformed the fluvial networks, particularly in the central part of the city, where channeling has reduced riparian forest cover to less than 40 % (Pineda-López et al. 2015).
In this study, the objectives were to: 1) evaluate the quality of the riparian zone under different adjacent land uses in three catchments with different degrees of urbanization; 2) examine physical elements at local and landscape levels in order to describe alterations in the riparian zone; and 3) compare the riparian woody vegetation among the study catchments. Our hypothesis is that the quality of riparian zones is inversely related to the degree of urbanization of adjacent areas, and land uses that provide forest cover ensures a less degraded condition (including water, soil and vegetation) and greater species diversity. Moreover, human influence can alter the physical attributes of the riparian zone and impact upon its woody species composition.
Materials and methods
Description of the study area. The Sabinal River basin is located in the state of Chiapas, in Southern Mexico, and belongs to the hydrological region of the basin of the Grijalva and Usumacinta Rivers. It has a drainage area of 395 km2 and the length of the main channel is 38.4 km from the headwaters to the confluence with the Grijalva River. Fifteen tributary streams feed this system with a mean annual flow of 8 million m3 (INESA Unpublished report). Elevation ranges from 400 to 1,320 m asl, with a predominant vegetation of tropical low deciduous and tropical low sub-deciduous forests (Miranda & Hernández-X 1963). The soils are leptosols (50 %)
with a very shallow surface horizon, followed by vertisols (17.3 %) on the lower parts, and rendzinas on the slopes. Two main climate types are present: warm subtropical Aw0, with a mean annual temperature of 24-26 °C, and warm humid Aw1, with a mean annual temperature of 22-24 °C (García 1988). Mean annual precipitation ranges from 800 to 1,200 mm and the rainy season extends from May through October, with September the month of greatest precipitation (INESA Unpublished data).
For this study, three catchments, Sabinal, San Agustín and Chacona, were selected (Figure 1). These catchments were considered representative for the study since their streams flow through similar disturbance gradients that include human settlements, rural zones with agricultural and livestock production and secondary vegetation derived from agriculture and pasture (Pineda-López et al. 2015).
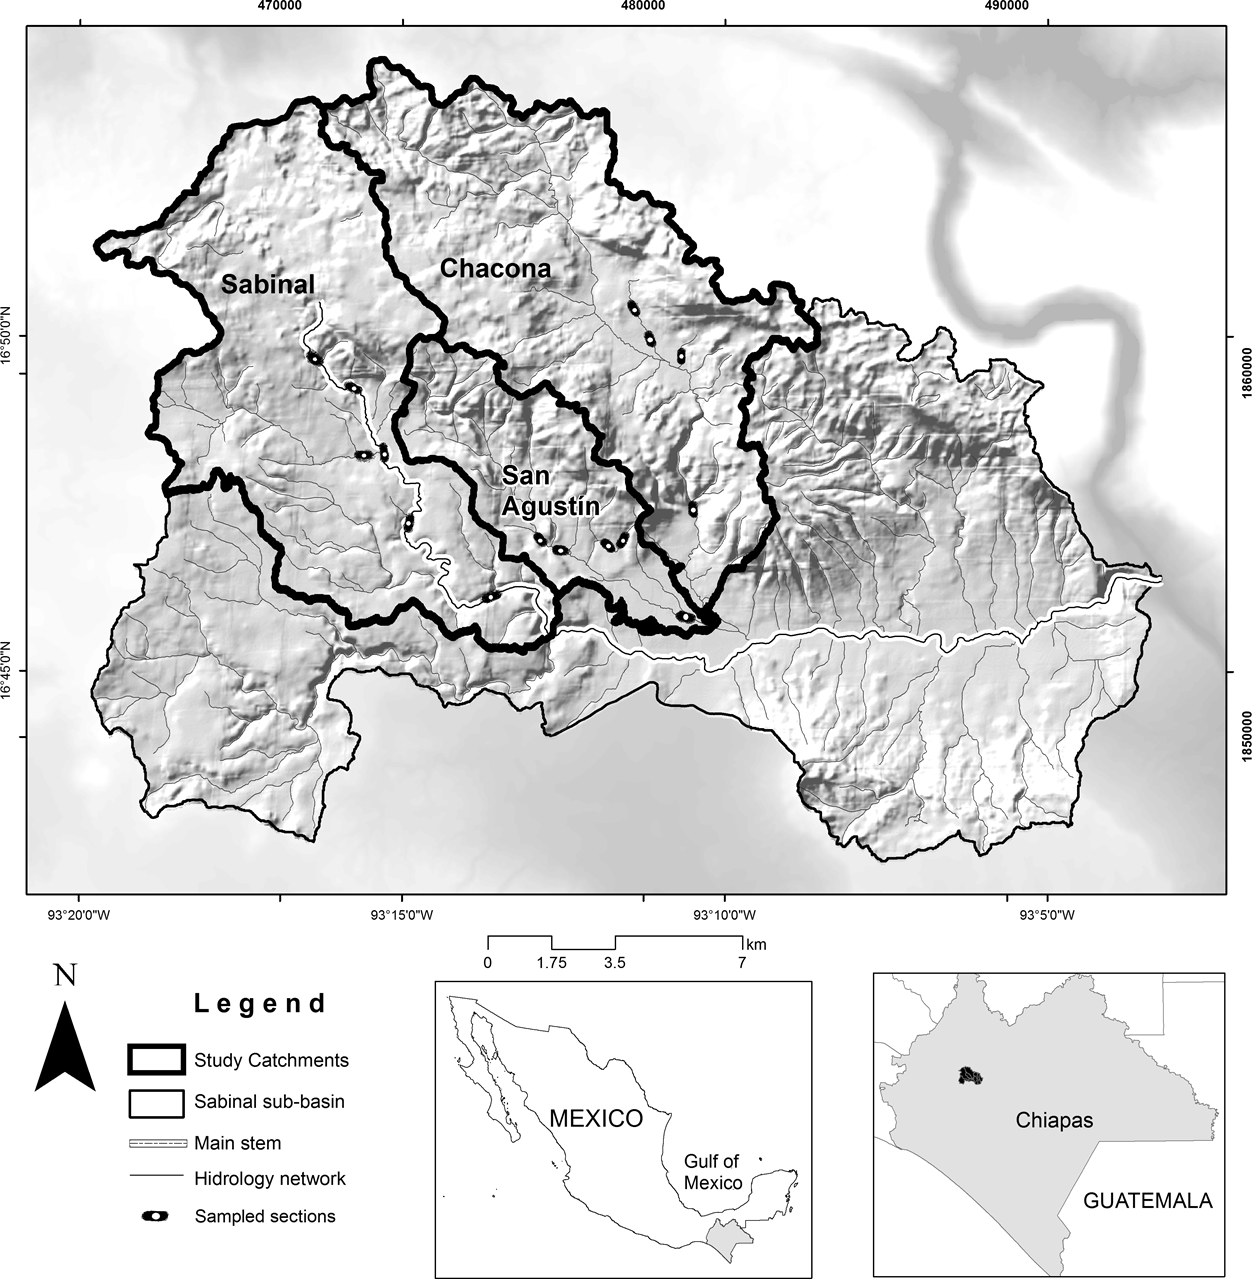
Figure 1 Location of the Sabinal River basin and the three study catchments (Sabinal, San Agustín and Chacona) in Chiapas, Mexico.
Study sites. A digital elevation model, with raster of 15 m and with the hydrographic network (RH30E) at scale 1:50,000 (INEGI 2015), was used to delimit the study catchments using a geographic information system (ArcGIS10) with the Soil and Water Assessment Tool (ArcSWAT). Those layers were superimposed on a land use map of the Ministry of Environment and Natural History of Chiapas (Gordillo-Ruiz & Castillo-Santiago 2017). The study catchments encompass different land use and cover categories as part of the highly disturbed Sabinal River basin (Table 1). Riparian vegetation was assessed within three land-use cover types: secondary forest (SF), grasslands and crops (GC) and human settlements (HS). Primary forest was not found adjacent to riparian zones of the three catchments; only secondary forest was measured.
Table 1 Land use cover at the three study catchments in the Sabinal River, Mexico.
| Land use (%) | Sabinal | San Agustín | Chacona |
|---|---|---|---|
| Primary forest | 12 | 10 | 24 |
| Secondary forest | 28 | 41 | 25 |
| Grasslands and crops | 43 | 19 | 39 |
| Human settlements | 16 | 28 | 11 |
| Limestone quarry | 0.5 | 0 | 0 |
| Roads | 0.5 | 0.7 | 0.3 |
Our sampling unit was the reach, one of the scales proposed by Frissell et al. (1986) to classify stream habitat systems. A reach is a homogeneous length of a stream that provides data on a physical scale. It is useful for describing vegetation distributional patterns or community species composition, and to assess the medium- and long-term effects of human activities in streams. Fifteen sampling reaches of 100m in length were selected with a stratified random sampling method (Mostacedo & Fredericksen 2000), considering accessibility, and with field validation at the three catchments. As suggested by González del Tánago & García de Jalón (2007), prior to field data collection, satellite images were used to assess and classified the type of valley, confinement and reach type (Appendix 1).
Evaluation of riparian zones. Characterization was conducted in August 2015, following recommendations to evaluate small streams (Petersen 1992, Munné et al. 2003) and to maintain a homogeneous length among reaches (González del Tánago et al. 2006, Rheinhardt et al. 2007). However, stream and riparian corridor width was highly variable and limited in some reaches by physical infrastructure (walls, fences, paths and roads) or changes in land use. To evaluate the condition of the riparian zone, the Riparian Quality Index (RQI), proposed by González del Tánago & García de Jalón (2006, 2011) was applied to each reach. The RQI method provides a field format that allows a rapid characterization of the riparian zones as a preliminary step, prior to the evaluation of their ecological condition. The RQI comprises seven attributes (RQI1-RQI7); the first three attributes determine the physical structure of the riparian corridor, while the remaining four are related to the functioning of the system (Table 2). The RQI was considered the most suitable method by which to evaluate the quality of the riparian zone because is applied at the reach scale of the stream and considers the longitudinal, lateral and vertical spatial dimensions. The assessment of RQI attributes was conducted systematically: attributes RQI1, RQI2 and RQI3 were characterized at each riverbank separately, while attributes RQI4 to RQI7 were characterized jointly at both riverbanks (Table 2). RQI total values for each reach were obtained by summing the scores from the attributes. This method allows storage of the quantitative information that has been collected in the field and that will subsequently be encapsulated using a scoring system. It is not intended to find an underlying mechanism in the final relationship obtained, but simply constitutes a systematic method of describing an ecological condition. The condition of reaches was then evaluated on the scoring system from zero to 150 as indicated by the RQI method.
Table 2 Attributes of the Riparian Quality Index (RQI).
| Structural attributes | |
|---|---|
| RQI1 | Dimensions of the riparian corridor |
| RQI2 | Longitudinal continuity, coverage and patterns of distribution of the riparian corridor |
| RQI3 | Composition and structure of the riparian vegetation |
| Functional attributes | |
| RQI4 | Natural regeneration |
| RQI5 | Condition of banks |
| RQI6 | Lateral connectivity between the riparian zone and the channel |
| RQI7 | Substrate and degree of alteration of the riparian corridor |
Landscape and local physical variables. Landscape variables were related to topography and climate, which influence the physical characteristics of ecosystems (Gordon et al. 2004). Fifteen physical variables were taken from the database generated by the RQI method and classified as continuous or categorical. The continuous variables were longitudinal slope, altitude, average annual precipitation, drainage area, riparian strip width, channel width, bank height, canopy cover, bank slope, eroded bank and substrate condition (presence of paving and compaction). The categorical variables were age diversity, natural regeneration of vegetation, bank condition and presence of leaf litter and organic matter. The methods for measuring those variables are included in Appendix 2.
Composition of woody species. Richness (S) and abundance of woody species were determined through a census of all individuals (≥ 3 m in height) on both riverbanks at each of the 15 study reaches. While reach lengths were similar for each site, there were differences in width due to physical obstructions. Botanical samples of individual trees were collected and labeled, indicating locality, date and position along the riparian zone. Plant species and associated vegetation were identified with support of herbarium specialists, floristic lists (Breedlove 1986) and databases of botanical collections (Missouri Botanical Garden: http://www.tropicos.org/; Smithsonian Institute, National Museum of Natural History: http://collections.nmnh.si.edu/search/botany/ and NaturaLista: http://www.naturalista.mx/). The official list of Mexican threatened species (SEMARNAT 2010) and the Red List of the International Union for Conservation of Nature (IUCN 2015) were consulted to determine those species at some category of risk.
Data analysis. One-way ANOVA (P < 0.05) was performed to test for differences in the RQI among catchments and land uses, and post hoc tests were conducted using Tukey´s HSD. Bartlett´s test was used to estimate the homogeneity of variance, while normality was tested by Shapiro-Wilk. These analyses were conducted performed using R Core Team (2015) with a 0.05 level of significance. To examine spatial patterns among catchments and land use cover, a Principal Components Analysis (PCA) was conducted. Data were standardized due to differences in scale between the local and landscape physical variables; variables that presented bias in the Draftsman Plot analysis of correlations (Clarke & Gorley 2006) were square root transformed. The variable ‘abundance of trees’ was eliminated because it presented a strong correlation with percentage of canopy cover (r > 0.90), as suggested by Clarke & Ainsworth (1993).
Analysis of species composition included calculation of richness and diversity of plant species. Diversity was calculated based on the Shannon-Wiener index (H´), and richness (S) as the number of species in the community (Sunil et al. 2010). Values of H´ and S were compared among catchments and land use by one-way ANOVA and when main effects were significant, pairwise comparisons were conducted using Tukey´s HSD test.
A Detrended Correspondence Analysis (DCA) (Hill & Gauch 1980) was conducted to examine differences in the composition of species along a gradient of disturbance. Ordination analysis was performed with the R software (version 3.1.3), using the vegan library (Oksanen 2013). Analysis of woody species involved differentiation of gallery forest, tropical low deciduous and tropical low sub-deciduous forests, and native, introduced and exotic species (Corbacho et al. 2003). A permutational multivariate analysis of variance (PERMANOVA) (Anderson 2001) was used to test the hypothesis that there were no differences in the structure of the plant community among the catchments and land use cover; statistical significance was tested under an unrestricted model using 9,999 permutations. When significant differences were found, multiple comparisons were conducted and SIMPER analysis was performed to determine the contribution of species to those differences (Clarke & Gorley 2006). Statistical analyses were conducted using the PRIMER-E v.6 software with the PERMANOVA extension (Anderson et al. 2008).
Results
Characterization and evaluation of riparian zones. RQI values ranged from 16 to 112 (Table 3). The highest values corresponded to reaches adjacent to secondary forest located in the Sabinal catchment while the lowest values corresponded to reaches adjacent to human settlements of the San Agustín and Sabinal catchments (Figure 2). The RQI showed significant differences among land uses (F (2, 12) = 8.47, P = 0.005) and the Tukey HSD test indicated differences between the reaches adjacent to secondary forest and human settlements (P = 0.004). RQI values among catchments did not differ significantly.
Table 3 Riparian Quality Index (RQI) scores and the ecological condition of fifteen reaches at the three study catchments in the Sabinal River, Mexico. Land use abbreviations stand for: secondary forest (SF), grasslands and crops (GC) and human settlement (HS).
| ID | UTM Coordinates | Catchment | Land use | RQI1 | River condition |
|---|---|---|---|---|---|
| 1 | 472254 E, 1857862 N | Sabinal | HS | 24 | Bad |
| 2 | 472854 E, 1858062 N | Sabinal | HS | 31 | Bad |
| 3 | 472071 E, 1859693 N | Sabinal | GC | 93 | Moderate |
| 4 | 470936 E, 1860468 N | Sabinal | SF | 112 | Good |
| 5 | 473631 E, 1856128 N | Sabinal | SF | 90 | Moderate |
| 6 | 475689 E, 1853868 N | Sabinal | SF | 107 | Good |
| 7 | 479468 E, 1860968 N | Chacona | HS | 60 | Poor |
| 8 | 481290 E, 1859949 N | Chacona | HS | 44 | Poor |
| 9 | 480250 E, 1860584 N | Chacona | GC | 50 | Poor |
| 10 | 481337 E, 1856344 N | Chacona | SF | 62 | Poor |
| 11 | 477074 E, 1855608 N | San Agustín | HS | 22 | Bad |
| 12 | 477690 E, 1855278 N | San Agustín | HS | 28 | Bad |
| 13 | 481149 E, 1853385 N | San Agustín | HS | 16 | Bad |
| 14 | 478905 E, 1855056 N | San Agustín | GC | 32 | Bad |
| 15 | 478980 E, 1855391 N | San Agustín | SF | 56 | Poor |
1 RQI scores: Very good condition: values from 150-130; good condition: 129-100; moderate condition: 99-70; poor condition: 69-40; bad condition: 39-10 and extreme degradation: < 10).
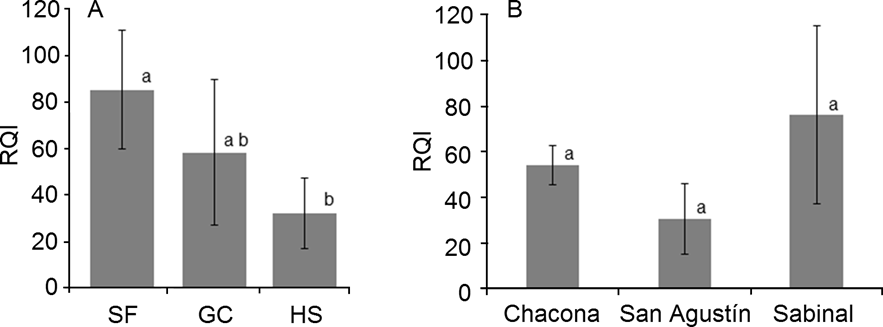
Figure 2 Comparison of mean Riparian Quality Index (RQI) scores among (A) land use: secondary forest (SF), grassland and crops (GC) and human settlement (HS); and (B) the three study catchments (Chacona, San Agustín and Sabinal) in the Sabinal River, Mexico. Average and standard deviation values are shown. Different letters indicate significant (P < 0.05) differences.
RQI attributes ranged from bad to good conditions (Figure 3). Composition and structure of the riparian vegetation, natural regeneration of species and lateral connectivity of the channel with riparian zones, were mostly evaluated as being in a bad condition. Condition of the riverbanks were generally poor while longitudinal continuity obtained the highest score, showing a range from poor to very good condition.
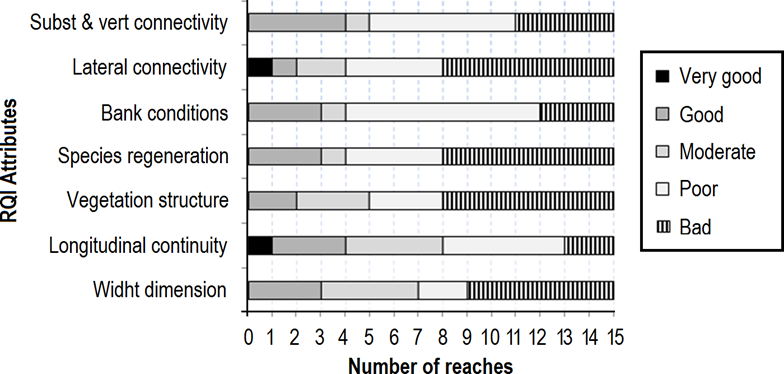
Figure 3 Evaluation of the Riparian Quality Index (RQI) attributes at the 15 study reaches on the Sabinal River, Mexico.
Landscape and local physical variables. PCA1 and PCA2 explained 38.5 and 20.2 % of the variability, respectively (Figure 4). The PCA1 axis was associated with variables that provide a more natural condition to the riparian zones (canopy cover, leaf litter and organic matter, abundance of seedlings) and to the variable paving and compaction, which indicate alterations to the natural substrate. Reaches with secondary forest were placed to the right in the graph, associated with a more natural condition. Reaches adjacent to human settlements were placed to the left of the graph, related to paved and compacted substrates (Figure 4). Most reaches of the Sabinal catchment exhibited a more natural condition. In contrast, all reaches from the San Agustín catchment exhibited paving and compaction. PCA2 distinguished variables that denote the dimensions of the riparian corridor (channel width) and bank condition (height, slope and erosion). The reaches of the Chacona catchment were strongly related to bank erosion. PCA3 featured landscape variables such as altitude and drainage area among its highest values.
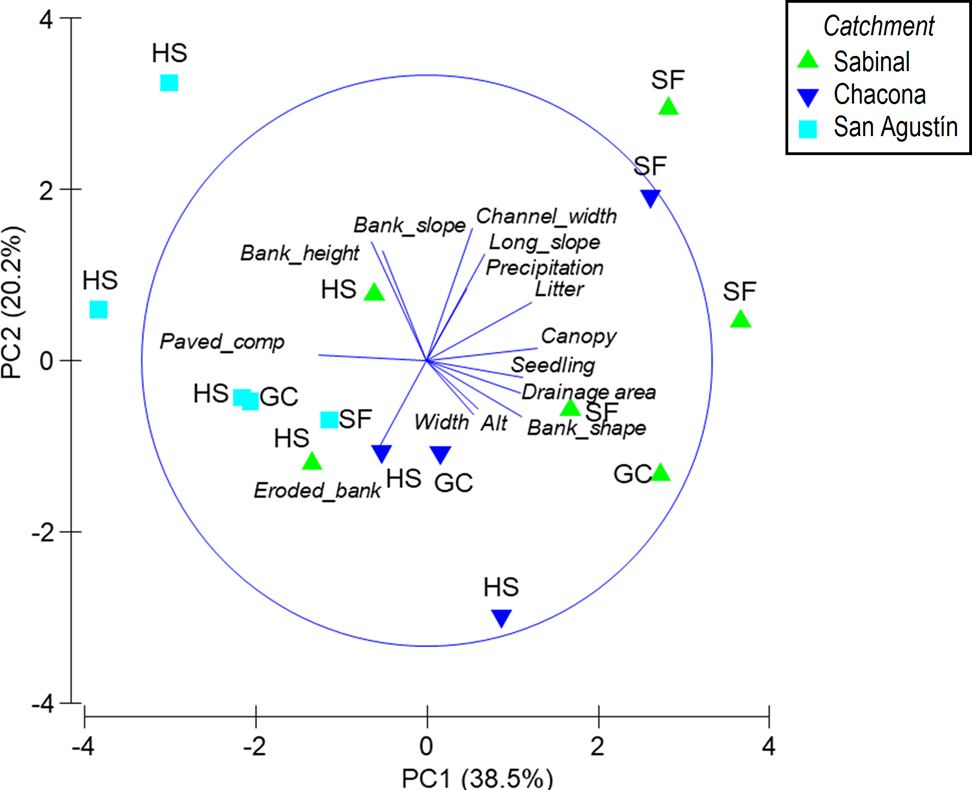
Figure 4 Principal Components Analysis (PCA) based on local physical and spatial variables that describe the riparian zone of the Sabinal River, Mexico, in three catchments: Sabinal, Chacona and San Agustin (Long_slope, longitudinal slope; Precipitation: annual average precipitation; Litter: litter and organic matter abundance; Canopy: canopy cover; Seedling: seedling abundance; Alt: altitude; Width: width of the riparian zone; Eroded_bank: percentage of bank eroded; Paved_comp: percentage of bank paved or compacted). Land use categories: secondary forest (SF), grassland and crops (GC) and human settlement (HS).
Composition of woody species. 1,327 tree individuals were recorded within the three land use types, belonging to 52 families, 104 genera and 143 species, of which nine are considered exotic and five are naturalized for the gallery forest (Appendix 3). The most abundant family was Fabaceae (17 %), followed by Moraceae (8 %). The species with the highest number of individuals (95) was Taxodium huegelii. The reach adjacent to secondary forest in the Sabinal catchment (ID 4) showed the highest number of species (53), 19 of which were found only at this site. The reach with the lowest number of species (ID 13) is adjacent to human settlements in the San Agustín catchment, and had eight species. Significant differences were detected among land uses in richness (S), which was significantly higher in secondary forest (average 40 ± 9.36 species) than in human settlements (average 15 ± 6.82 species, P = 0.0004) and in the grasslands and crops reaches (average 22 ± 8.14 species, P = 0.02). Diversity (H´) was significantly higher in secondary forest (3.27 ± 0.37) than in human settlement reaches (2.25 ± 0.44) (P = 0.0012). No significant differences were observed in richness or diversity among catchments. Richness and diversity were positively correlated to the RQI (r2 = 0.72 and r2 = 0.71, respectively) (Figure 5). According to the IUCN (2015) threatened species list, the species Taxodium huegelii (before T. mucronatum) is in the ‘least concern’ category, while Crossopetalum parviflorum is in the ‘near threatened’ category and Pistacia mexicana, Cedrela odorata and Swietenia humilis are in the ‘vulnerable’ category. According to the Mexican official list of threatened species, Licania arborea is considered a ‘threatened’ species and Croton guatemalensis is ‘subject to special protection’.

Figure 5 Positive correlation between the Riparian Quality Index (RQI), species richness (S) and diversity (H´) at the study reaches in the Sabinal River basin, Mexico.
Differences in the composition of species due to disturbance gradient. The DCA analysis showed the distribution of species and reaches according to their longitudinal gradient. The gradient of the DCA1 axis was 4.41 units of standard deviation in length, with the longest distance occurring between reaches four and 11. Sites that differ by four standard deviations are expected to have no species in common (Ter Braak 1995), which was the case in this study. Non-riparian tree species included Brosimum alicastrum, Dendropanax arboreus, Lonchocarpus rugosus, Oreopanax geminatus, Piper arboreum, Platymiscium aff. pinnatum, Pterocarpus rohrii, Eugenia xalapensis, Eugenia sp., Ficus insipida, F. pertusa and F. petiolaris (Figure 6). Riparian species under more conserved forest conditions included Inga vera, Sapindus saponaria, Taxodium huegelii, Bursera simaruba, Ficus insipida, Manilkara zapota and Tabebuia rosea, while species such as Cnidoscolus aconitifolius, Leucaena esculenta, Plumeria rubra and Zuelania guidonia were common under more disturbed forest conditions (Espinosa-Jiménez et al. 2014). Also found were indicator species of disturbed areas (Guazuma ulmifolia, Senna atomaria, Carica papaya, Mutingia calabura) or those associated with livestock production (Acacia pennatula, Acacia sp., Cordia dentata, Heliocarpus reticulatus). Moreover, there were naturalized species such as Annona diversifolia, Bixa orellana, Carica papaya, Cordia dodecandra and Heliocarpus reticulatus observed. There were species that are considered exotic or introduced, and are mainly associated with human settlements (Bambusa vulgaris, Citrus aurantifolia, Citrus sinensis, Eugenia jambos, Ficus benjamina, Jacaranda mimosifolia, Mangifera indica, Musa paradisiaca and Ricinus communis). The DCA2 axis had a length of 3.4 units of standard deviation; this means that, despite the fact that there are opposite reaches in the graph, such as 7 and 12, they still contain species in common. From the 15 reaches, only three were in the negative quadrant, associated with better riparian condition (secondary forest).
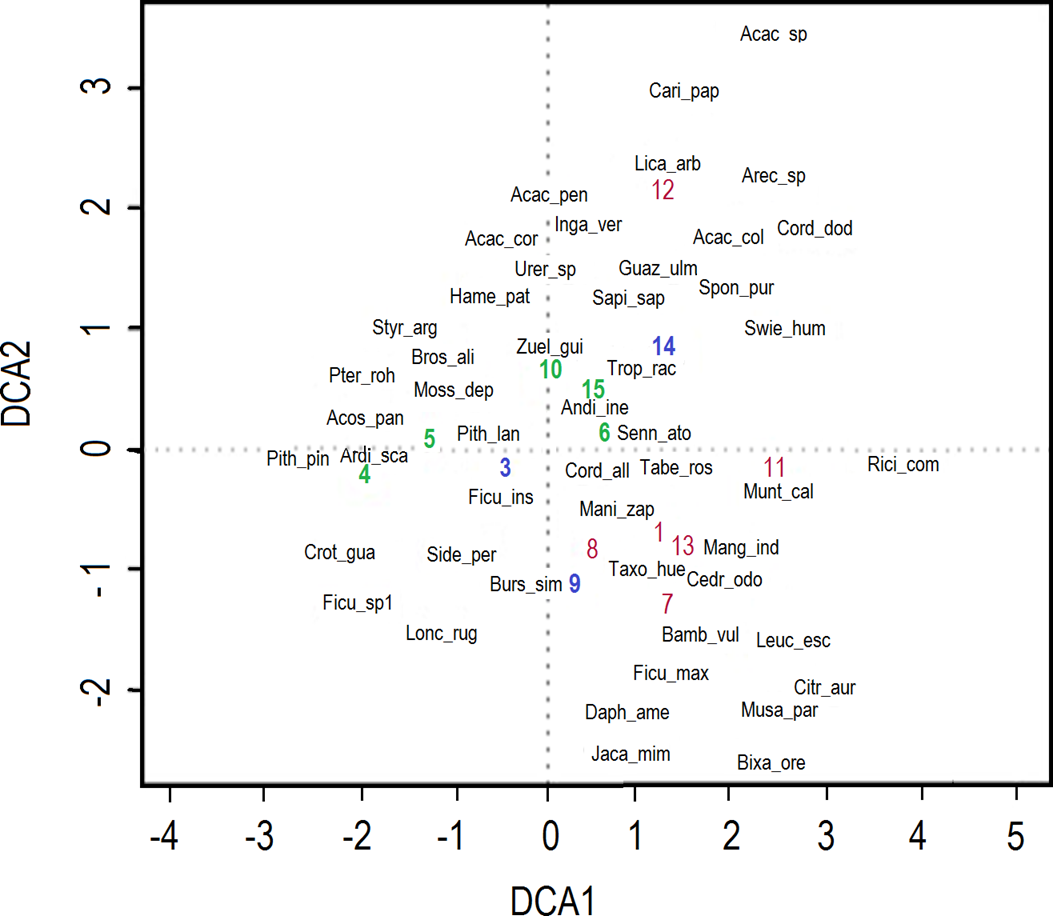
Figure 6 Biplot graph of Detrended Correspondence Analysis (DCA). Acronyms of species close to the green numbers represent sites of secondary forest, blue numbers represent sites of grassland and crops areas, and red numbers represent human settlements areas.
Composition of species at local or landscape level. Significant differences were found in the plant community among catchments (PERMANOVA P = 0.0069, Pseudo-F = 1.76). Differences were found between Chacona and San Agustín catchments (P = 0.017) and between Sabinal and San Agustín catchments (P = 0.048). This analysis did not detect differences among land uses (P > 0.08).
SIMPER indicated that the highest dissimilarity in species abundance and composition was observed between Sabinal and San Agustín (81.4 %), followed by the Chacona and San Agustín (79.5 %) and Sabinal and Chacona (76 %) catchments. These percentages of dissimilarity were contributed by many species of low abundance. Greater contribution to those differences was provided by Cordia dentata, Enterolobium cyclocarpum and Salix humboldtiana, which only occurred at the Chacona catchment. Mosannona depressa and Brosimum alicastrum were registered only in the Sabinal and San Agustín catchments. However, some species did contribute to the similarity within each catchment (Table 4). The percentage of similarity was low (20-34 %) for the three groups. This indicates that only certain species were present in the different land uses at each catchment. The Chacona and Sabinal catchments recorded a higher number of species in common among land uses. San Agustín only reported three species that occur at the three land uses evaluated and, of those, none was locally abundant. In Sabinal, Inga vera was present at almost all sampled reaches, while Taxodium huegelii was present in few places but in considerable abundance. Tabebuia rosea, Guazuma ulmifolia and Cordia dentata were dominant at the Chacona catchment.
Table 4 Representative species at the three study catchments (Sabinal, Chacona and San Agustín) in the Sabinal River, Mexico, based on their percentage of similarity. Sim/SD: it is the ratio between the average similarity divided by the standard deviation. Contrib %: percent contribution of each species to the total similarity. Cum %: cumulated percentages.
| Group (Similarity) | Species | Sim/SD | Contrib % | Cum % |
|---|---|---|---|---|
| Sabinal 26.17% | Inga vera | 3.15 | 11.18 | 11.18 |
| Taxodium huegelii | 0.76 | 10.25 | 21.43 | |
| Tabebuia rosea | 0.78 | 6.20 | 27.63 | |
| Sideroxylon persimile | 1.32 | 6.15 | 33.79 | |
| Guazuma ulmifolia | 0.72 | 5.56 | 39.35 | |
| Mosannona depressa | 0.74 | 4.68 | 44.03 | |
| Brosimum alicastrum | 0.78 | 4.32 | 48.35 | |
| Piper arboreum | 0.77 | 4.26 | 52.51 | |
| Chacona 34.12% | Tabebuia rosea | 3.14 | 13.49 | 13.49 |
| Guazuma ulmifolia | 3.52 | 10.48 | 23.96 | |
| Cordia dentata | 4.47 | 9.60 | 33.56 | |
| Daphnopsis americana | 0.90 | 8.63 | 42.19 | |
| Lonchocarpus rugosus | 0.88 | 7.79 | 49.98 | |
| Salix humboldtiana | 0.90 | 5.95 | 55.93 | |
| San Agustín 20.54% | Mangifera indica | 1.05 | 17.69 | 17.69 |
| Guazuma ulmifolia | 1.00 | 16.94 | 34.63 | |
| Tabebuia rosea | 0.98 | 16.92 | 51.55 |
Discussion
In the context of an urban-rural gradient, landscape elements such as water bodies and riparian vegetation experience strong human pressure. In Mexico, 73 % of the aquatic systems experience some type of contamination or degradation (Mendoza-Cariño et al. 2014). Differences in RQI, local and landscape physical variables, and species composition suggest that the process of land use change, associated with urban growth in the study zone, is altering the quality of the riparian zone.
Our results indicated that adjacent land use influences the condition of the riparian zone, as has been previously stated (Aguiar & Ferreira 2005, Kutschker et al. 2009, Meek et al. 2010). As an example, riparian zones next to secondary forest were in better condition and showed higher percentage values of canopy coverage, greater presence of leaf litter and organic matter and a greater proportion of seedlings, compared to riparian reaches adjacent to areas of grasslands and crops and to human settlements. Such variables confer a more natural condition to the Sabinal catchment and indicate lower human pressure (Corbacho et al. 2003). In contrast, riparian zones adjacent to areas of grasslands and crops presented mostly bad to moderate condition, probably related to soil compaction caused by grazing and agricultural activities (Zepeda-Castro et al. 2002, Valero et al. 2014).
Reaches adjacent to human settlements were the most heavily impacted, supporting previous studies showing that urbanization is among the land uses that have more severe consequences for riparian corridors (Kutschker et al. 2009). In our study, soil compaction and modification of stream banks were the main impacts associated with urban areas. Paving and compaction affect the water quality of streams (Paul & Meyer 2001, Walsh et al. 2005) and the ecological functioning of riparian zones by altering their flood capacity and habitat availability (Lytle & Merritt 2004, González del Tánago & García de Jalón 2006). In addition, paving and compaction increase the proportion of impervious surfaces, which are excellent indicators of the urbanization process intensity because they may enhance degradation of fluvial ecosystems (Walsh et al. 2001, 2005, Wang et al. 2000). Reaches at the San Agustín catchment, which showed the highest percentage of urban area, were associated with paving and compaction, even those adjacent to secondary forest. This could be related to the recreational use of the riparian zone within secondary forest reaches in San Agustín, where the passage of vehicles and people generates soil compaction and alters the structure of the riparian vegetation with little or null seedling recruitment (González del Tánago & García de Jalón 2007).
Modification of stream banks occurs primarily through the widening of channels (Gregory et al. 1992), elevation of the bank and construction of levees and walls that can alter flow patterns (Rodríguez & Ramírez 2014). Riparian zones adjacent to human settlements at the Sabinal and San Agustín catchments exhibited such alterations. However, the banks at the Chacona catchment were less altered because their riparian reaches appeared to be an extension of the backyards of adjacent houses. Such riparian zones showed a greater relationship with eroded banks that is indicative of high flows and bank instability (Harding et al. 2009). For this catchment, management to improve the riparian vegetation could provide greater stability, since banks with no vegetation are more prone to erosion (Naiman & Décamps 1997).
An anthropic effect on the riparian vegetation was observed on the species diversity and composition of the woody plant community. The greatest richness and diversity of species was found in reaches adjacent to secondary forest, followed by grasslands and crops and human settlements. Such patterns can be related to the effects of land use change and occupation of the riparian zone (Aguiar & Ferreira 2005, Meek et al. 2010, Méndez-Toribio et al. 2014). The positive relationship between the quality of the riparian zone (RQI) and species richness and diversity support the hypothesis that less degraded riparian areas hold greater species diversity. This may also suggest the presence of a riparian species diversity associated to sites located distant from human settlements, a condition that is increasingly infrequent in the Sabinal river basin.
Species included in some category of conservation management, such as Pistacia mexicana (‘special protection’ category) and Taxodium huegelii (‘least concern’ category), can be found along conserved portions of the upper and middle parts of the Sabinal River basin. At the same time, those species appear as relicts occurring in disturbed zones with remnant vegetation in the lower part of the catchment. This suggests that conservation and restoration strategies should focus not only on sites with good conservation status, but also consider zones under high human pressure, in order to attain longitudinal connectivity along the riparian corridor.
Reaches within secondary forest allowed an assemblage composed of native species associated with the riparian zone. Along the land use gradient, native species are replaced by introduced species, as well as mixing with adjacent vegetation. This implies that the loss of vegetation due to the establishment of agriculture and urbanization can result in fragmentation, provoking an edge effect and causing alteration in abiotic conditions such as light intensity, air temperature, moisture and water and nutrient flows (Murcia 1995), which can ultimately modify species composition. Urbanization appears to be an important factor affecting species composition and may explain the significant differences detected between San Agustín, Sabinal and Chacona catchments. San Agustín catchment still has some forest fragments in its drainage area (Table 1); however, this does not necessarily imply that those areas are well conserved, considering the pressure of land conversion to urban areas (Pineda-López et al. 2015). In addition, changes in the soil conditions of urban zones, including acidification and presence of pollutants, can also affect species composition (Huang et al. 2013). Likewise, the higher occurrence of exotic species in areas of human settlements probably responds to the higher human disturbance and potential introduction through people using riparian zones (Sunil et al. 2010). This situation leads to the gradual replacement of native for allochthonous species, affecting the composition and diversity of the native plant community (Burton et al. 2005, Rodríguez-Téllez et al. 2012, White et al. 2014).
The results of the diversity analysis illustrate the potential role of rural and urban zones in contributing to diversity at landscape level. The heterogeneity of environments is reflected by the low percentage of similarity, which implies a small number of species commonly shared among different land uses (Rodríguez 2009). PERMANOVA analysis detected that the plant community at San Agustin differs from that of the Sabinal and Chacona catchments. These differences can be related to the higher percentage of urbanization in the San Agustin catchment and its shorter distance to the core area of the metropolitan zone of Tuxtla Gutiérrez, which probably results in less woody vegetation in the riparian zone. In addition, the species Mangifera indica, which appeared abundantly in the San Agustin catchment, indicates greater human pressure. On the other hand, common species among the three catchments, such as Tabebuia rosea and Guazuma ulmifolia, are indicative of secondary forest species that denote a degree of disturbance. Complementarily, there were found species in the urban reaches that are originated from primary forests (e.g., Stemmadenia donnell-smithii, Tabebuia rosea, Cordia alliodora, Diospyros digyna, Taxodium huegelii, among others), which could be dispersed by the river from the upper catchment (Hyslop & Trowsdale 2012). Local and disseminated species in each of the catchments could be providing the structure of the plant community and their role in riparian restoration should be investigated in greater detail.
In riparian zones is pertinent to explore premises such as those formulated by McMahon & Cuffney (2000) about how the landscape characteristics do not simply reflect the physical and geographic context, but also management decisions associated with the needs of the people that live in the catchment. For this reason, management and conservation strategies should be developed at a local level, with the understanding and involvement of all relevant stake-holders.

