


 text new page (beta)
 English (pdf)
 Article in xml format
 Article references
 Send this article by e-mail
 Cited by SciELO
  Similars in
SciELO
Similars in
SciELO 
 Permalink
Genetic exchange between two differentiated genomes is considered a major source of variation with an important role in bacterial, animal, fungal and plant evolution (Arnold et al. 2008). In particular plant hybridization may lead to the origin of new species, an increase of intraspecific genetic diversity, species extinction, among others (Rieseberg & Carney 1998, Arnold 2006). However, besides its importance in evolution, plant hybridization is challenging for taxonomist when it leads to atypical or morphologically intermediate individuals. Atypical individuals are sometimes described as a new species (e.g., Romero 1993), and in extreme cases, the presence of morphologically intermediate hybrids causes the merging of two taxa into a single species (López-Caamal et al. 2014). However, even when hybridization is known to occur between a species pair, the boundaries between parental species are blurred, creating difficulties when assigning individuals into parental or hybrid categories.
Hybrid identification relies nowadays in neutral molecular markers. The main advantage of molecular markers is that their analysis is straightforward, revealing with great accuracy the ancestry of hybrids and identifying the potential outcomes of hybridization (Hohenlohe et al. 2011). However, botanists rely on morphological characters to discriminate between hybrid and parental individuals under field conditions. In this regard, identifying diagnostic morphological characters of hybridizing species would be of great value for taxonomists.
The morphological expression of hybrids is complex (Rieseberg et al. 1999). Hybrids may express intermediate characters if under polygenic control, transgressive character expression when complementary gene action occurs, or parental character expression if the character is under the control of one or few genes with complete dominance/recessivity. Given the complexity of hybrid phenotypic expression, morphological markers are rarely used nowadays as the unique tool for hybrid recognition. These markers are used along with molecular or cytological markers to make robust hypothesis of hybridization (López-Caamal & Tovar-Sánchez 2014). However, morphometric studies are important as they reveal diagnostic markers for both parental and hybrid individuals and may give insights of the ecological performance of hybrids (López-Caamal & Tovar-Sánchez 2014).
Natural hybridization between oaks (Quercus L., Fagaceae) is frequent. Hybrid zones have been and are continuously being detected in North America (González-Rodríguez et al. 2004, Peñaloza-Ramírez et al. 2010, Valencia-Cuevas et al. 2014), Europe (Muir & Schlötterer 2005) and Asia (Lee et al. 2014, Song et al. 2015). The involved oak species usually show high levels of gene flow, generating complex patterns of morphological expression within hybrid zones leading to taxonomic confusion. Most oak hybridization studies use a combination of morphological and molecular markers (Tovar-Sánchez & Oyama 2004, González-Rodríguez et al. 2004, Song et al. 2015). In particular, leaf morphological characters are thoroughly used in these studies, usually supporting the hybridization hypothesis when used along with molecular markers. Leaf micromorphological characters (leaf trichomes, trichome density, stomata type, stomata density) are informative and usually exhibit unique combinations in oak hybrids (Scareli-Santos et al. 2007, Scareli-Santos et al. 2013, Fortini et al. 2015). If these characters are found, they may enable taxonomists to easily differentiate between parental and hybrid types.
Oaks exhibit a high diversity in Mexico. Indeed, the country is considered a center of diversification of the genus with a high proportion of endemic species (Valencia-A. 2004). Mexican oaks have been intensively studied in recent years. Hybrid zones have been found between several Quercus species pairs (Tovar-Sánchez & Oyama 2004) and some authors have explored hybridization rates between three or more species of Quercus (Peñaloza-Ramírez et al. 2010, Valencia-Cuevas et al. 2014). Also, phylogeographical analyses have revealed a complex history of hybridization and introgression between oak species (González-Rodríguez et al. 2004, Tovar-Sánchez et al. 2008). Despite the high number of studies, the genus Quercus is still considered a “difficult” group for taxonomists. The recognition of parental species and their hybrids in the wild is usually difficult due to the lack of clearly diagnostic leaf morphological markers. However, leaf micro morphological markers arise as a useful tool to discriminate between hybrid and parental categories due to their usually intermediate pattern of expression in hybrids (Little 2004, Kim et al. 2010, Danusevičius et al. 2012, Fortini et al. 2015), suggesting a simple genetic inheritance (Wei et al. 2015).
In this study, we explore the micromorphological patterns of hybridization between two Mexican oaks: Quercus crassifolia Bonpl. and Q. crassipes Bonpl. (sect. Lobatae). Quercus crassifolia is distributed mainly in the Sierra Madre Occidental (SMOc), the Faja Volcánica Transmexicana (FVT), and in the southern parts of Sierra Madre Oriental (SMOr) while Q. crassipes does it in SMOr and in the FVT (Figure 1). In their sympatric range, atypical individuals with intermediate morphology are found. Initially, these individuals were considered as a separate species (Q. dysophylla; Romero 1993, Zavala Chávez 1995). However, Tovar-Sánchez & Oyama (2004) identified through macro morphological and molecular markers that the intermediate forms between Q. crassipes and Q. crassifolia are hybrid individuals, designating them as Q. × dysophylla (Tovar-Sánchez & Oyama 2004). Furthermore, these authors found that geographic proximity of hybrid individuals to the allopatric site of a parental species increases their macro morphological and genotypic similitude with the parental species.
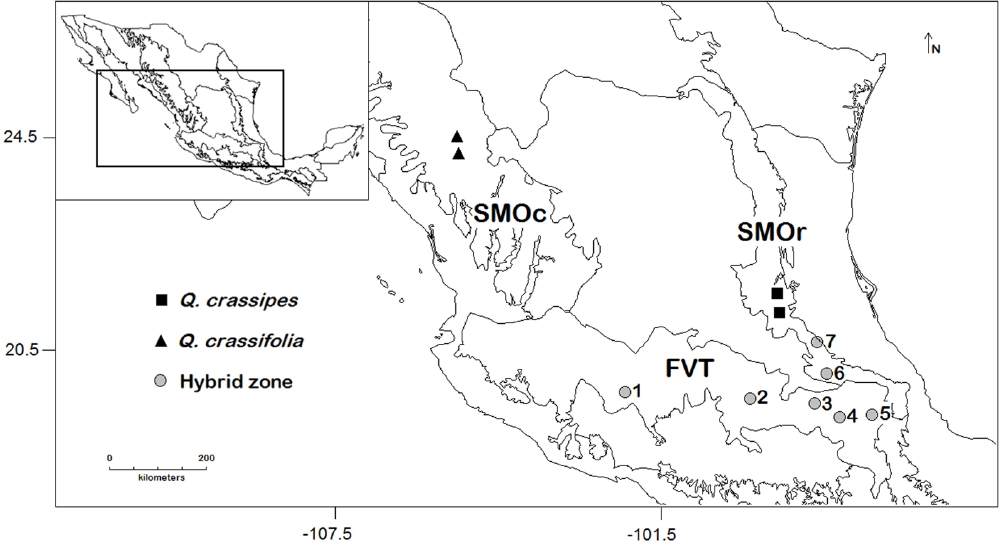
Figure 1 Map of sampled Quercus crassifolia and Q. crassipes allopatric stands and hybrid zones. 1) Cantera, 2) Canalejas, 3) Tlaxco, 4) Acajete, 5) Esperanza, 6) Agua Blanca, and 7) Palo Bendito. Solid lines represent biogeographical regions.
The goals of this paper were 1) to describe the micro- and macro-morphological spatial variation of Quercus × dysophylla and its parental species, 2) to compare the spatial patterns of hybridization revealed by genetic (Tovar-Sánchez & Oyama 2004) macro morphological and micro morphological, and 3) find micro-morphological diagnostic markers of Q. × dysophylla in order to facilitate its recognition. Due to the simple genetic inheritance found in a number of micro morphological characters, we hypothesize that micro morphological characters will exhibit the same spatial pattern revealed by genetic markers (geographic proximity to a species’ allopatric site will increase the similitude individuals to that species).
Materials and Methods
Study species and study sites. Quercus crassifolia and Q. crassipes belong to the section Lobatae. These species show noticeable differences when distributed in allopatry (Valencia-A. 2004). Chloroplast DNA analyses revealed that for both species, colonization routes were in a north – south direction following the formation and retreat of glaciers during the Last Glacial Maximum (Tovar-Sánchez et al. 2008). Quercus crassifolia colonized initially the northern part of SMOc, the entire FVT and the southern parts of SMOr. Meanwhile, Q. crassipes colonized initially the northern parts of SMOr and then the FVT. Atypical individuals with putative intermediate morphology are found where the distributions of these species overlap (FVT and southern parts of SMOr). These individuals were described as Q. dysophylla. However, RAPD analysis revealed that these individuals are the result of interspecific gene flow between Q. crassipes and Q. crassifolia. The name Q. × dysophylla was proposed for intermediate individuals with additive pattern of RAPD loci (Tovar-Sánchez & Oyama 2004).
For this paper, we chose the same sites and individuals studied by Tovar-Sánchez & Oyama (2004). These include two allopatric sites in SMOc for Q. crassifolia and two for Q. crassipes in SMOr. Also, five hybrid zones in the FVT and two in the southern part of SMOr were included in the analysis (Figure 1). We labeled individuals as Q. crassifolia, Q. crassipes or Q. × dysophylla according to the genetic analysis performed by Tovar-Sánchez & Oyama (2004).
Trichome and stoma characterization. In order to characterize the type of stomata and trichomes in leaves through Scanning Electron Micoscopy (SEM), we randomly chose one individual per taxa in each sympatric site (Q. crassifolia, Q. crassipes and Q. × dysophylla) and one individual per taxa in each allopatric site (Q. crassifolia or Q. crassipes).
For trichome characterization, we explored the abaxial leaf surface. Due to their great density, we manually eliminated a portion of trichomes in order to distinguish them clearly. We followed the nomenclature provided by Jones (1986) for trichome characterization. For stomata characterization, we retired manually all trichomes. SEM Coating System (Polaron) was used to coat the samples with gold and SEM was carried out in a Zeiss DSM 950 microscope.
Leaf micro- and macromorphological measurements. For trichome micro-morphological measurements, we randomly selected three individuals per taxa (Q. crassifolia, Q. crassipes and Q. × dysophylla) in each macromorphological allopatric site and hybrid zones (n = 25). For each micromorphological individual, we randomly selected three mature and undamaged leaves. Five trichome slides were prepared for each leaf (n = 1,125 slides). We only measured fasciculate-stipitate trichomes as this was the only type shared across all individuals of Q. crassipes, Q. crassifolia and Q. × dysophylla (see Results). Trichome slides were prepared as follows; we carefully retired the leaves’ underside trichomes. Next, trichomes were stained with toluidine blue and permanent slides were prepared with glycerinated gelatin. We measured 15 trichomes per leaf, and we included three leaves per individual (n = 135 trichomes). For each trichome, four micromorphological characters were recorded: ray length (RL), stipe length (TSL), ray number (NR) and the relation between stipe length and ray length (TSL%; Table 1). For stomata measurements, we randomly selected five individuals per taxa in each allopatric site and hybrid zone. Three undamaged leaves were selected per individual and three slides were prepared per leaf (n = 1,125). These slides were prepared as impressions of the leaf surface through the replica technique (Wilson 1981). Briefly, the impression was made by placing a drop of cyanoacrylate adhesive in the leaf surface. Once the adhesive dried out (after 1 – 2 hours), the leaf tissue was carefully removed. The Slides were then observed under a microscope at 40X. In total, four characters (stomata length [SL], width [SW], density [SD] and stomata coberture [SC]) were measured in 1875 stomata.
Table 1 List of stomata, trichome and leaf macromorphological characters measured in individuals of Quercus crassifolia, Q. crassipes and Q. × dysophylla in Mexico.
| Character | Units | Description |
|---|---|---|
| Micromorphological | ||
| Stomata | ||
| SL | µm | Stoma length |
| SW | µm | Stoma width |
| SD | no./µm2 | Stomata density at 40X |
| SC | µm2 | [(Stoma length + Stoma width)/4]2 π |
| Trichomes | ||
| TSL | µm | Stipe length |
| RL | µm | Ray length |
| NR | no. | Number of rays |
| TSL% | - | (Stipe length/Ray length)100 |
| Macromorphological | ||
| FA | cm2 | Foliar area |
| PA | cm2 | Petiole area |
| VA | degrees | Secondary vein angle |
| PA% | - | (Petiole area/Foliar area)100 |
In addition to micromorphological characters, we also measured macromorphological leaf characters (Foliar area [FA], petiole area [PA], secondary vein angle [VA] and the relation between foliar and petiole area [PA%]; Table 1). We selected 10 individuals per taxa in each hybrid zone and 20 individuals in each allopatric stand (n = 290 trees). Twenty mature undamaged leaves were randomly selected per individual and four macromorphological characters were recorded (Table 1).
Data analyses. ANOVA was conducted to determine the effect of taxa (Q. crassifolia, Q. crassipes and Q. × dysophylla) in each micro- and macromorphological character measured. Percentage data were transformed as [arcsin (%)1/2], and count characters were transformed as [(x) 1/2 + 0.5] (Zar 2010). Significant mean differences between taxa were determined with a Tukey multiple range test. According to the results of the Tukey multiple range test, we recorded the phenotype of Q. × dysophylla as intermediate or Q. crassifolia-like when significant differences were found with at least one parental species. Otherwise, the character was recorded as Parental-like when no significant differences were found between Q. × dysophylla and either parental species. All allopatric and hybrid zones were included in the analysis.
Discriminant function analysis (DFA) was carried out using all morphological variables. We performed a separate DFA for trichome, stomata and leaf macromorphological characters including all populations without taking into account their geographic origin. The purpose of this analysis was to determine the most useful characters to discriminate between taxa and to visually assess the separation of individuals into groups. We established taxon (Q. crassifolia, Q. crassipes and Q. × dysophylla) as the predictor variable. Separate analyses were performed with trichome, stomata and macromorphological datasets because different sample sizes were obtained with each of these structure measurements, rendering them incomparable. Aditionally, a classification analysis using DFA was performed in order to test the accuracy of each structure’s morphology to place each individual in the established pre-defined categories (Q. crassifolia, Q. crassipes and Q. × dysophylla).
In order to know the phenotypic expression of Q. × dysophylla in each hybrid zone, we performed the following analyses. First we conducted an ANOVA with taxa (Q. crassifolia, Q. crassipes or Q. × dysophylla) as independent variable and each morphological character as dependent variable. Significant mean differences between taxa were determined with a Tukey multiple range test. If a Q. × dysophylla character differed significantly between taxa, it was recorded as transgressive (positive or negative) if the value of the putative hybrid exceeded the parental species value. Otherwise, the character was reported as intermediate, Q. crassifolia-like or Q. crassipes-like when significant differences were found between the mean trait values of Q. × dysophylla and one or both parental species. Finally, the character was reported as parental-like, when no significant differences were found with either parental species (Schwarzbach et al. 2001).
Finally, to test if geographic proximity to an allopatric site of a Quercus species increases the morphological similitude of individuals to that species, we performed linear regressions between each macro- and micromorphological character and geographic distance of each hybrid zone in a west-east direction. We expect Q. × dysophylla morphological characters to increase their similitude to Q. crassifolia when there is close proximity to its allopatric stand (west). In a similar fashion, we expect that Q. × dysophylla morphology will increase its similitude to Q. crassipes when it is in close proximity to its allopatric site (east). All statistical analyses were performed with JMP software ver. 12 (SAS Institute, Cary, NC).
Results
Trichome and stoma characterization. We found one type of glandular trichome and five types of non-glandular trichomes (Table 2, Figure 2). In general, all three taxa exhibited simple uniseriate glandular trichomes, however, this type was not present in all individuals of the three taxa. Regarding non-glandular trichomes, Q. crassifolia exhibited all types except simple stellate trichomes, while Q. crassipes only exhibited fasciculate stipitate and simple stellate trichomes. Lastly, Q. × dysophylla showed fasciculate stipitate, multirradiate and simple stellate trichomes (Table 2). We found that all individuals of all three taxa exhibited fasciculate stipitate trichomes. Meanwhile, anomocytic stomata were observed in all individuals of Q. crassipes, Q. crassifolia and Q. × dysophylla. In some cases, the stomata were covered with dense epicuticular waxes, which made difficult to observe all of their structures.
Table 2 Glandular and non-glandular foliar trichomes found in the abaxial surface through SEM in individuals of Quercus crassifolia, Q. crassipes and Q. × dysophylla in Mexico.
| Taxa | Glandular trichome |
Non-glandular trichome | ||||
|---|---|---|---|---|---|---|
| Simple uniseriate |
Solitary unicellular |
Fasciculate sessil |
Fasciculate stipitate |
Multirradiate | Simple stellate |
|
| Q. crassifolia | × | × | × | × | × | |
| Q. crassipes | × | × | × | |||
| Q. × dysophylla | × | × | × | × | ||
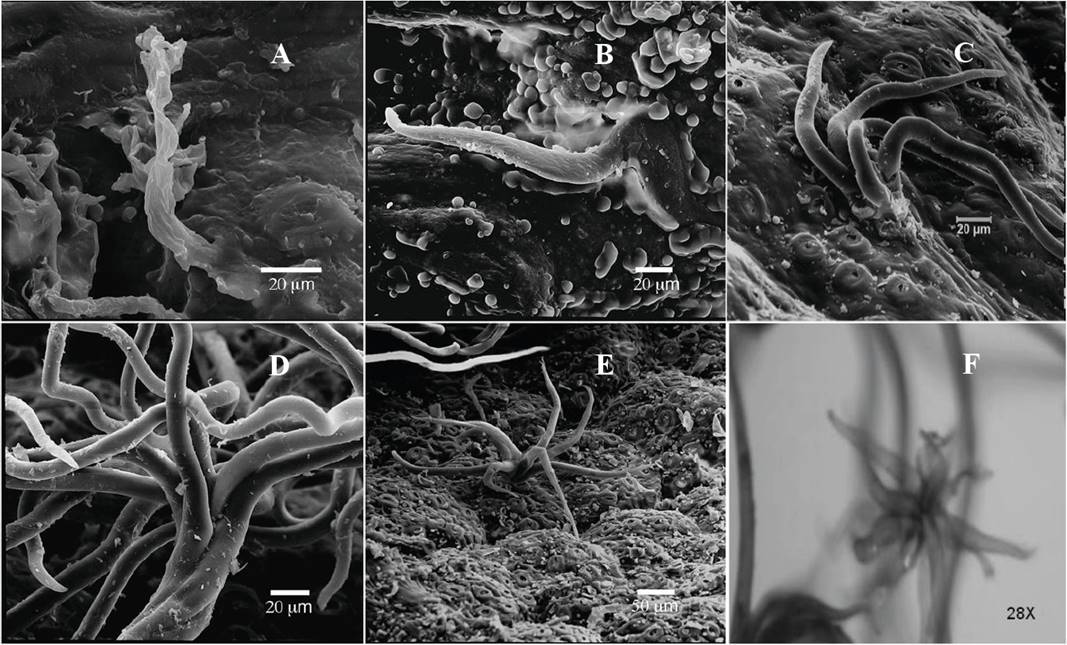
Figure 2 Uniseriate simple glandular trichome (A) and non-glandular trichomes (B-F) found in Quercus crassifolia, Q. crassipes and Q. × dysophylla through SEM. Solitary unicelular non-glandular (B), fasciculate sessile (C), fasciculate stipitate (D), simple stellate (E) and multirradiate trichomes (F) were found. See text for details.
Quantitative analysis of trichome, stoma and leaf macromorphological characters. ANOVA of trichome, stoma and leaf macromorphological characters revealed that taxa (Q. crassipes, Q. crassifolia and Q. × dysophylla) had a significant effect in all morphological characters except for stomatal density (SD; Table 2). Furthermore, after post hoc comparisons, Q. × dysophylla showed an intermediate phenotype between its parental species in all characters except for stomatal density (parental-like; Table 3) and TSL% (Q. crassifolia-like; Table 3).
Table 3 Mean ± standard error and ANOVA results for all micro- and macromorphological characters for Quercus crassipes, Q. crassifolia and Q. × dysophylla. Different letters indicate significant differences between taxa (Tukey, p < 0.05).
| Character | Q. crassifolia | Q. × dysophylla | Q. crassipes | F Taxa | Q. × dysophylla phenotype |
|---|---|---|---|---|---|
| Micromorphological | |||||
| Stomata | F(2, 1798) | ||||
| SL | 26.53 ± 0.08a | 26.05 ± 0.09b | 24.32 ± 0.10c | 144.50 * | Intermediate |
| SW | 24.38 ± 0.08a | 23.90 ± 0.10b | 22.87 ± 0.09c | 65.60 * | Intermediate |
| SD | 58.72 ± 2.21a | 59.28 ± 2.66a | 66.05 ± 3.42a | 0.19 ns | Parental-like |
| SC | 84,399.33 ± 943.83a | 78,363.44 ± 977.65b | 63,413.83 ± 948.36c | 131.93 * | Intermediate |
| Trichomes | F(2, 1941) | ||||
| TSL | 136.98 ± 1.64a | 116.59 ± 1.48b | 99.47 ± 1.34c | 162.58 * | Intermediate |
| RL | 779.05 ± 11.36a | 672.84 ± 8.75b | 459.76 ± 5.64c | 325.86 * | Intermediate |
| NR | 2.66 ± 0.01a | 2.80 ± 0.01b | 3.12 ± 0.01c | 308.90 * | Intermediate |
| TSL% | 19.07 ± 0.24a | 18.56 ± 0.31a | 22.81 ± 0.49b | 56.53 * | Q. crassifolia-like |
| Macromorphological | F(2, 4909) | ||||
| FA | 43.93 ± 0.46a | 22.19 ± 0.28b | 8.04 ± 0.09c | 2,780.47 * | Intermediate |
| PA | 0.64 ± 0.01a | 0.25 ± 0.01b | 0.11 ± 0.01c | 2,131.98 * | Intermediate |
| VA | 48.18 ± 0.17a | 44.30 ± 0.21b | 37.81 ± 0.23c | 745.80 * | Intermediate |
| PA% | 1.70 ± 0.03a | 1.22 ± 0.02b | 1.53 ± 0.07c | 86.95 * | Intermediate |
DFA with taxa as the predictor variable and stomata characters as dependent variables yielded two discriminant functions (DF) that explained 100 % of the variation of the original data set (Figure 3A). The variables with the highest standardized discriminant coefficients in DF1 were Stoma length and Stoma coberture, while Stoma coberture and stoma length had the highest standardized discriminant coefficients in DF2 (Table 4). The plot of DF2 vs. DF1 showed that individuals of Q. crassifolia, Q. crassipes and Q. × dysophylla show significant overlap in the ordination space (Figure 3A). However, classification analysis through DFA with stoma characters showed that only 11.11 % of individuals of Q. crassifolia were misclassified as Q. × dysophylla, while a significant percentage of Q. crassipes and Q. × dysophylla were misclassified (Table 5).
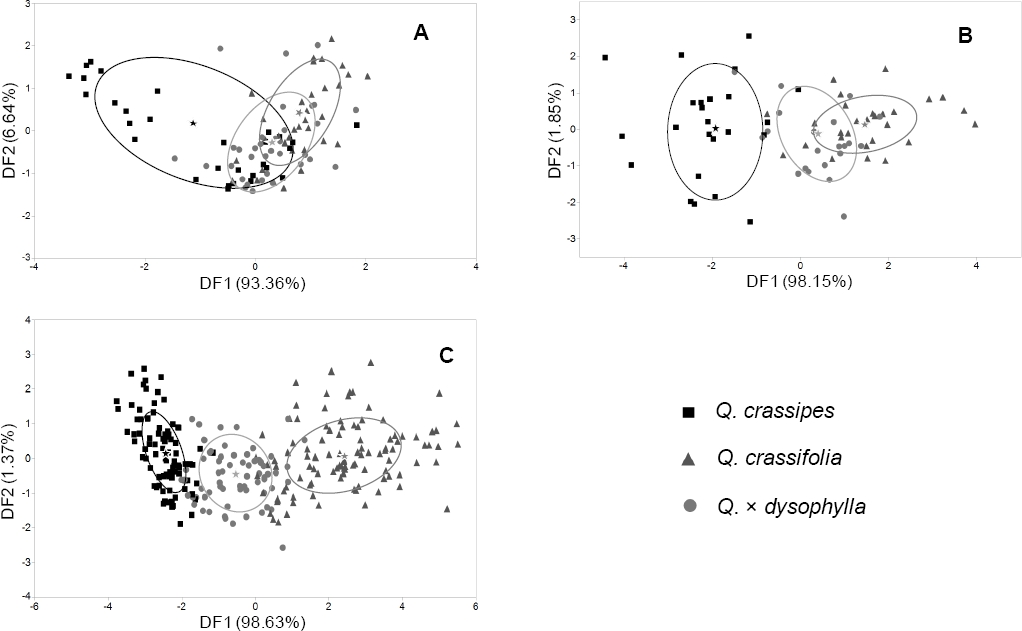
Figure 3 Plot of DF2 vs. DF1 extracted through DFA of stomata (A), trichome (B), and foliar macromorphological characters (C) of Quercus crassifolia, Q. crassipes and Q. × dysophylla in central Mexico. Stars indicate group centroids and ellipses depict the estimated zone that includes 50 % of population data for each taxa.
Table 4 Standardized canonical coefficients of each micro and macromorphological variable derived from DFA of allopatric and hybrid zones between Q. crassifolia and Q. crassipes.
| Morphological variable | DF1 | DF2 |
|---|---|---|
| Stomata | ||
| SL | 1.67 | -9.62 |
| SW | 0.64 | -8.55 |
| SC | -1.23 | 17.19 |
| Trichomes | ||
| TSL | 2.27 | 0.15 |
| RL | -1.29 | 0.46 |
| NR | -0.49 | 0.27 |
| TSL% | 2.17 | 0.95 |
| Foliar macromorphological | ||
| FA | 0.63 | 0.07 |
| PA | 0.65 | 0.15 |
| VA | 0.37 | -0.6 |
| PA% | -0.27 | 0.75 |
Table 5 Classification analysis performed by DFA overall Quercus populations. The percentages of assignment to each category (taxa) are shown for stomata, trichome and foliar macromorphological characters
| Genetic assignment | Predicted by DFA (%) | Percentage of misclassification | ||
|---|---|---|---|---|
| Taxa | Q. crassifolia | Q. crassipes | Q. × dysophylla | |
| Stomata | ||||
| Q. crassifolia | 88.89 | 0 | 11.11 | 11.11 |
| Q. crassipes | 25.71 | 48.58 | 25.71 | 51.42 |
| Q. × dysophylla | 57.22 | 8.50 | 34.28 | 65.72 |
| Trichome | ||||
| Q. crassifolia | 71.43 | 0 | 28.57 | 28.57 |
| Q. crassipes | 0 | 87.50 | 12.50 | 12.50 |
| Q. × dysophylla | 9.52 | 4.76 | 85.72 | 7.14 |
| Foliar macromorphological | ||||
| Q. crassifolia | 90.75 | 0 | 9.25 | 9.25 |
| Q. crassipes | 0 | 96.66 | 3.34 | 3.34 |
| Q. × dysophylla | 5.79 | 2.89 | 91.30 | 4.34 |
In a similar fashion, DFA with trichome characters produced two DF that explained 100 % of the variation in the original data set (Figure 3B). Trichome stipe length and the relation between stipe length and ray length showed the highest standardized canonical coefficients in DF1, while the relation between stipe length and ray length (TSL%) and ray length showed the highest standardized canonical coefficients in DF2 (Table 4). The plot of DF1 vs. DF2 with trichome characters showed that Q. crassifolia and Q. crassipes show almost no overlap in the ordination space (Figure 3B). However, Q. × dysophylla individuals were placed in an intermediate space. Classification analyses showed that parental species were not misclassified between them. However, some individuals of the parental species were classified as Q. × dysophylla. Also, some Q. × dysophylla individuals individuals were classified as Q. crassipes or Q. crassifolia (Table 5).
DFA with leaf macromorphological character as dependent variables produced two DF that explained 100 % of the variation in the original characters data set (Figure 3C). Foliar area and petiole area showed the highest standardized discriminant coefficients in DF1, while vein angle and the relation between petiole and foliar area (AP%) did it in DF2. The plot of DF1 vs. DF2 revealed that individuals of all three taxa showed almost no overlap in the ordination space; Q. × dysophylla individuals were placed in an intermediate space between individuals of both parental species (Figure 3C). Classification analysis showed low percentages of misclassification in all taxa (Table 5).
Analysis of phenotypic expression of Q. × dysophylla in each of the seven hybrid zones revealed that transgressive, intermediate and parental-like characters show geographic variation (Table 6). In general, we recorded few transgressive and intermediate characters (10.71 % and 36.9 % respectively). However, characters not different to at least one parental species or parenta-like characters represented 52.38 % of all phenotypes recorded (Table 6). The complete phenotypic analysis per hybrid zone is shown in Appendix 1.
Table 6 Percentages of transgressive, intermediate and parental like characters of Quercus × dysophylla in seven hybrid zones in central Mexico. For details refer to Appendix 1.
| Q. × dysophylla phenotype | Locality | |||||||
|---|---|---|---|---|---|---|---|---|
| Cantera | Canalejas | Tlaxco | Acajete | Esperanza | Agua Blanca | Palo Bendito | Mean | |
| Transgressive | 8.33 | 0 | 16.67 | 0 | 16.67 | 16.67 | 16.67 | 10.72 |
| Intermediate | 33.33 | 33.33 | 50.00 | 25.00 | 41.67 | 25.00 | 50.00 | 36.9 |
| Q. crassifolia-like | 8.33 | 50.00 | 0 | 25.00 | 33.33 | 0 | 25.00 | 20.24 |
| Q. crassipes-like | 25.00 | 8.33 | 25.00 | 16.67 | 0 | 8.33 | 0 | 11.9 |
| Parental-like | 25.00 | 8.33 | 8.33 | 33.33 | 8.33 | 50.00 | 8.33 | 20.24 |
Lastly, regression analysis revealed that geographic distance (in a west-east direction) did not have significant effects in morphological characters of Q. × dysophylla except for three stomata-related characters (Table 7). Interestingly, a number of parental-species’ macro and micromorphological characters were significantly affected by geographic distance. Regarding stomata characters, Q. crassipes showed significant negative correlations with distance in the length and width of stomata. That is, stomata tend to be smaller when Q. crassipes is in closer proximity with its allopatric stand in the SMOr. The same pattern arises with Q. crassipes foliar macromorphological characters and with the stipe length of trichomes (Table 7). However, stomatal density and the number or trichome rays tend to increase when Q. crassipes individuals are located in proximity to its allopatric site. On the other hand, stomata characters of Q. crassifolia were not significantly affected by the geographic distance. However, the stipe length of trichomes and the ray length of trichomes show significant associations with geographic distance. Both characters tend to increase its values when Q. crassifolia individuals are closer to its allopatric stand in the SMOc. The same pattern arises for two macromorphological characters. However, the trichome number of rays and the relation between stipe length and ray length of trichomes showed the opposite pattern (Table 7).
Table 7 Regression analysis between each macro and micromorphological character of Quercus crassifolia, Q. crassipes, and Q. × dysophylla and geographic distance. Only correlations significant at p < 0.05 are shown. See text for details.
| Character | Q. crassifolia | Q. × dysophylla | Q. crassipes | |||||
|---|---|---|---|---|---|---|---|---|
| r | r2 | r | r2 | r | r2 | |||
| Stomata | ||||||||
| SL | - | - | - | - | -0.67 | 0.49 | ||
| SW | - | - | 0.56 | 0.31 | -0.54 | 0.29 | ||
| SD | - | - | -0.56 | 0.32 | 0.72 | 0.52 | ||
| SC | - | - | -0.43 | 0.19 | -0.63 | 0.39 | ||
| Trichomes | ||||||||
| TSL | -0.45 | 0.20 | - | - | -0.53 | 0.28 | ||
| RL | -0.63 | 0.39 | - | - | - | - | ||
| NR | 0.74 | 0.55 | - | - | 0.51 | 0.26 | ||
| TSL% | 0.42 | 0.18 | - | - | -0.51 | 0.26 | ||
| Foliar macromorphological | ||||||||
| FA | - | - | - | - | - | - | ||
| PA | -0.45 | 0.21 | - | - | -0.52 | 0.27 | ||
| VA | - | - | - | - | - | - | ||
| PA% | -0.51 | 0.26 | - | - | -0.52 | 0.27 | ||
Discussion
Phenotype expression of Quercus crassifolia, Q. crassipes and Q. × dysophylla. In this paper, we explored the morphological variation of Q. × dysophylla and its parental species, Q. crassipes and Q. crassifolia. Identification of oak species and their hybrids is usually difficult due to the continuous morphological and genetic variation. In this regard, detailed morphometric studies arise as an important approach to identify diagnostic characters that enable the discrimination between parental and hybrid categories. Results show that, overall populations, Q. × dysophylla shows an intermediate phenotype of all the micro- (except for SD and TSL%) and macromorphological characters evaluated. However, leaf macromorphological characters clearly discriminate between taxa. This result is in accordance with other studies that report hybrid phenotypes in several Quercus species. For instance, Tovar-Sánchez & Oyama (2004) found that hybrid individuals between Q. crassipes and Q. crassifolia exhibit an intermediate phenotype in macromorphological characters. Also, Song et al. (2015) explored the phenotype between Q. austrochinchinensis and Q. kerri in China. The authors found that 13 out of 14 characters showed an intermediate phenotype in the hybrid. Similar results have been found between several Quercus species (Borazan & Babaç 2003, González-Rodríguez et al. 2004, Albarrán-Lara et al. 2010, Fortini et al. 2015), suggesting that quantitative characters in several Quercus species may have a polygenic control with additive effects.
Despite that intermediate phenotypes are found when all populations of Q. crassipes and Q. crassifolia are analyzed together, the phenotype of Q. × dysophylla seems to show geographic variation. When hybrid zones are analyzed individually, Q. × dysophylla shows a mosaic of intermediate, transgressive and parental-like characters. Results show that, when hybrid zones are analyzed individually, only 36.9 % of characters showed an intermediate phenotype, while a significant portion (52.38 %) were characters not different to one or both parental species. This result highlight the fact that hybrids are not uniform; they may exhibit a wide array of phenotypes depending on the hybrid class analyzed (F1, backcrosses). Also, selection pressures acting at each site may differ between hybrid zones. This may partially explain the differential phenotypes found between hybrid zones. Future studies should analyze the hybrid phenotypes for each hybrid class (F1, F2, backcrosses) under uniform conditions in order to know the contribution of phenotypic plasticity to hybrid phenotypes.
Quercus crassipes and Q. crassifolia may be easily differentiated through leaf macromorphological characters. These characters separated parental individuals into discrete clusters (Figure 2C) and > 90 % of individuals of both parental species were correctly classified to their pre-established category (Table 5). Micromorphological trichome characters showed the same pattern (Figure 2B, Table 5). This finding is in accordance with other studies that support the use of leaf macromorphological and trichome characters to discriminate between Quercus species (Fortini et al. 2015, Song et al. 2015). However, these characters were not informative when Q. × dysophylla was brought into analysis. When Q. × dysophylla was included, the individuals were placed in an intermediate space between parental species through DFA. However, up to 28.57 % of individuals of parental species were misclassified as Q. × dysophylla. This suggests that trichome characters may be initially informative when discriminating between hybrid and parental categories but other characters may be take into account. In this sense, qualitative rather than quantitative characters may be useful for Q. × dysophylla identification. In accordance with previous work (Valencia-Ávalos & Delgado-Salinas 2003, Vázquez 2006, Scareli-Santos et al. 2013), we found that parental species can be differentiated by trichome types. A diagnostic character for Q. crassipes is the presence of simple stellate trichomes, while for Q. crassifolia solitary unicellular, fasciculate sessile and multirradiate non-glandular trichomes were its diagnostic features. However, these diagnostic features recombine in Q. × dysophylla. The hybrids exhibit both multirradiate and simple stellate non-glandular trichomes. This characteristic may be considered as diagnostic features for Q. × dysophylla. In a previous study, Scareli-Santos et al. (2013) identified multirradiated trichomes in Q. crassipes, however we failed to recognize this trichome type in this species. So, we suggest that the presence of multirradiated trichomes in this species is not a constant character in Q. crassipes. However, future studies should analyze micromorphological variation employing more individuals of Q. crassifolia, Q crassipes and their hybrid Q. × dysophylla in order to evaluate if the trends found in this study can be generalized across these taxa.
Spatial morphological variation of Quercus × dysophylla and its parental species. Previous genetic studies in hybrid zones between Q. crassipes and Q. crassifolia in Mexico found that geographic proximity to a species’ allopatric stand increases the genetic similitude of hybrid individuals to that species (Tovar-Sánchez & Oyama 2004). We hypothesized that the same pattern would occur when micro- and macromorphological characters were studied. However, we did not find an effect of geographic distance in the morphological characters of Q. × dysophylla except for three stomata micromorphological characters. Several authors have found a strong correlation of foliar morphological characters with geographic distance or ecological gradients (Bruschi et al. 2000, Bruschi et al. 2003, Albarrán-Lara et al. 2010, Fortini et al. 2015). However, this was not the case for Q. × dysophylla. Despite several authors have recorded a strong effect of environmental gradients in the hybrid micromorphological phenotypic expression (e.g. Bruschi et al. 2003), our analyses show that the environment is not a driver of the morphological expression of Q. × dysophylla, suggesting that hybrids show increased morphological variation due to their recombinant origin (Wei et al. 1995). Nonetheless, individuals included into analysis are both probable F1 individuals and backcrosses toward both parental species. The inclusion of several hybrid classes obscure the effects of geographic distance over the macro- and micro morphological characters due to differential phenotype expression between hybrid classes.
Although Quercus × dysophylla phenotype did not exhibit an effect of geographic distance, some parental species’ characters did show a significant effect of geographic distance. For instance, 9 out of 12 stomata, trichome and leaf macromorphological characters of the parental species were significantly affected by geographic distance. Meanwhile, all trichome characters and two foliar macromorphological characters of Q. crassifolia showed an effect of geographic distance. The fact that both parental species show the same pattern of geographical variation in trichome and macromorphological phenotype expression may be the result of an ecological or environmental gradient along FVT. Future studies should correlate the morphology of Q. crassipes and Q. crassifolia with environmental conditions as done elsewhere (e.g. Bruschi et al. 2003).

