


 nueva página del texto (beta)
 Inglés (pdf)
 Artículo en XML
 Referencias del artículo
 Enviar artículo por email
 Citado por SciELO
  Similares en
SciELO
Similares en
SciELO 
 Permalink
Genetic diversity is a basic component of biodiversity that is extremely important for conservation strategies (Gordon et al. 2012). Preserving the genetic diversity of endangered plants has a significant influence on their long-term survival and evolution in changing environments (Yang et al. 2014). Several methods have been developed in order to assess diversity through biochemical, physiological and morphological characterization (Greene et al. 2004). Phenotypic diversity in plants is the basic feature of life system, it is required for populations to evolve in response to environmental changes, and its maintenance is crucial for long-term species survival (Yang et al. 2014). Therefore, knowledge of the phenotypic variation of an endangered plant under different environments is the prerequisite for understanding its genetic variation pattern, fitness and evolutionary capacity to adapt to environmental changes, and it is crucial for their conservation and management (Lopes et al. 2014).
Tetracentron sinense Oliv. appears to have survived largely unchanged since the early Tertiary, like Ginkgo and Metasequoia (Martyn & Peter 2007), and belongs to the family of Tetracentraceae (Chen et al. 2007). This species, the East Asian endemic species, a threatened deciduous broad-leaved canopy tree, with a distribution restricted to central and southern China, mainly lived in moist temperate deciduous, or mixed evergreen and deciduous forests or forest edge, above 1,100-3,500 m sea level (Fu & Bartholomew 2001, Martyn & Peter 2007). Due to the high demand for medicine, timber, ornamental and scientific research (Wang et al. 2006, Lai et al. 2010), the destruction of T. sinense resources recently reached a very serious degree, resulting in the continuous decrease of remaining wild population and individuals. As a consequence, T. sinense was listed as a national second-grade protected plant in China (Fu 1992), and is still at risk of extinction. Practical conservation measures, which can ensure conservation of the maximum genetic diversity of the species, are urgently required.
In order to explore the persistent status and factors resulting in endangered populations, the population ecology, reproductive ecology, systematic status, and seed and seedling ecology of T. sinense had been studied by many authors (Zhou 2007, Chen et al. 2008, Luo et al. 2010, Cao et al. 2012, Gan et al. 2012, Gan et al. 2013, Cindy et al. 2013, Li et al. 2015). Recently, the current situation of genetic diversity in wild populations of T. sinense was assessed based on the chloroplast DNA (Sun et al. 2014). However, molecular and phenotypic classifications often disagree. Presently, little is known about the phenotypic diversity in natural populations of T. sinense, and its fitness and evolutionary potential to the fragmental habitat.
In this paper, the phenotypic variation of leaf, infructescence, fruit and seed in 11 natural populations of T. sinense in China were reported. The aim of this study was (1) to characterize the level of phenotypic diversity in natural populations of T. sinense, and compare phenotypic diversity with molecular diversity based on cpDNA data, (2) to investigate the spatial distribution patterns of phenotypic variation, and (3) to discuss possible implications of these population genetic data for management and conservation.
Materials and methods
Plant materials and field experiments. Tetracentron sinense is a bisexual deciduous broad-leaved canopy tree. The leaf is simple, born on short branch top. The inflorescence is short pedunculate, with 80–125 sessile flowers, and the flowering period is June-July. The infructescence is spicate, and fruiting occurs throughout September-October, and the fruit has tetralocular capsules with four styles (Chen et al. 2007). The size range of fruit is 3 to 5 mm. Seeds are minute and wind-dispersed.
The leaves and infructescences of T. sinense were collected from 11 wild populations (all located in natural reserves) between September and October 2014 according to the distribution of the species in China (Fu & Bartholomew 2001; Figure 1). The geographic locations and climatic conditions of these sites are in Figure 1 and Table 1, wherein climatic data were all from the monitoring of natural reserves. The sampled trees per site ranged from 8 to 10 depending on the seed bearing specimens at each site. To ensure inclusion of maximum genetic variation, the selected trees were 50 m apart from each other. The perennial shoots with leaves and infructescences under the canopy in four directions were gathered and mixed well. Vouchers were deposited in the herbarium of China West Normal University.

Figure 1 Distribution centers of T. sinense in China in the bottom right of the picture. Arrow indicates the distribution of locations included in the study of T. sinense provenances in China. Circles with different colors denote the origin of the 11 provenances
Table1 Geographical locations and climatic conditions for tested T. sinense provenances
| Provenance | Code | Longitude N |
Latitude E |
Elevation /m |
Ta/°C | T1/°C | T7/°C | Td/°C | Ha/% | Ar/mm | Sa/h |
|---|---|---|---|---|---|---|---|---|---|---|---|
| Kangpu, | KP | 099° 08’ | 27° 33’ | 2456 | 5.4 | 1.4 | 15.0 | 3100 | 86 | 606.6 | 2203.1 |
| Baima sonw Mountain | BMSM | 099° 21’ | 27° 38’ | 2732 | 4.7 | -0.8 | 16.2 | 3457 | 75 | 1350.0 | 1986.0 |
| Ailao Mountain, | ALM | 101° 06’ | 24° 26’ | 2499 | 11.0 | 2.5 | 15.3 | 3721 | 83 | 1931.9 | 1931.9 |
| Dafengding | DFD | 103° 08’ | 28° 46’ | 2241 | 10.2 | -3.0 | 14.5 | 4000 | 80 | 1100.0 | 1918.1 |
| Baihe | BH | 105° 7.8’ | 33° 24.4’ | 1850 | 8.5 | -0.5 | 20.0 | 3115 | 82 | 750.0 | 1637.5 |
| Huangboyuan, | HBY | 104° 7.8’ | 33° 14.4’ | 1814 | 8.7 | -25 | 20.6 | 3374 | 78 | 922.8 | 1833.8 |
| Daozhendashahe, | DZDSH | 107° 45.6’ | 29° 90’ | 1627 | 11.5 | 3.8 | 22.3 | 4250 | 84 | 1280.0 | 1338.0 |
| Shennongjia, | SNJ | 110° 18.6’ | 31° 24.6’ | 1497 | 14.5 | 3.0 | 27.0 | 3795 | 75 | 1334.9 | 1858.3 |
| Wufeng houhe, | WFHH | 110° 32.4’ | 30° 42’ | 1192 | 11.7 | 1.7 | 24.1 | 3500 | 76 | 1814.0 | 1554.5 |
| Badagong Mountain, | BDGM | 110° 36’ | 29° 45.6’ | 1356 | 11.5 | 0.1 | 22.8 | 3612 | 90 | 2105.4 | 1136.2 |
| Shunhuang Mountain, | SHM | 111° 06’ | 26° 22.2’ | 1598 | 16.8 | 5.7 | 27.7 | 4425 | 79 | 1490.0 | 1300.0 |
Note: The provenances here are in alphabetic ordered by longitude. The same as followed.
Abbreviation: Ta, Annual average temperature; T1, Annual average temperature in January; T7, Average temperature in July; Td, The days of greater than 10°C accumulative temperature; Ha, Annual average relative humidity; Ar, Annual average precipitation; Sa, Annual sunshine hours. The same as followed.
Assessment of phenotypic traits. To evaluate the leaf phenotypic traits, twenty leaves from each sample tree were respectively quantified. As shown in Figure 2, the leaf length (LL; cm), leaf longest (LLEST; cm), total leaf length (LLT; cm), leaf width (LW; cm) and leaf petiole length (LPL; cm) were measured using a ruler, then the leaf shape index (LSI), leaf base tapering index (LBPI) and leaf tip pointed index (LTPI) were calculated. According to the method of Tian (2008), the leaf blade was scanned using PERFECTION V350 PHOTO EPSON scanner, and then the leaf area (LA; cm2) and leaf perimeter (LP; cm) were calculated using the CAD AUTO 2007 software.

Note: leaf length (LL) = ah; leaf longest (LLEST) = nj; leaf petiole length (LPL) = hg; total leaf length (LLT) = ag; leaf width (LW) = dl; leaf shape index (LSI) = (cm+ek)/2/ah; leaf base taper-ing index (LBPI) = (fp/hp+io/ho)/2; leaf tip pointed index (LTPI) = (bp/ap+qo/ao)/2.
Figure 2 Illusion of leaf phenotypic traits
From each sampled tree, one hundred infrutescences, fruits and seeds were quantified to gauge reproductive organ variation. The infructescence weight (IW; g), fruit weight (FW; g) and the weight of 1,000 seeds (WS; g) were weighted using an electronic balance (FA1004) (Luo et al. 2010). The infructescence length (IL; cm), fruit length (FL; cm) and fruit width (FW1; cm) were measured using a ruler. After the seed number per fruit (SN) was investigated, the length (SL; cm), width (SW; cm) and thickness (ST; cm) of seed were measured using electronic digital caliper (SF2000). Each experiment was replicated four times.
Statistical analyses. The analysis of phenotypic variation and differentiation coefficients were performed using SAS 9.3. The data were subjected to nested analysis of variance (Shen 1988), and the general statistical mixed model applied was:
Where: μ is the overall mean; αi is the effect values of the ith group; βj( i) is the effect values of jth individual in ith group; εijk. is residual error.
The phenotypic differentiation coefficients (Vst) were calculated using the following formula (Ge et al. 1988):
Where: σ2t/s is the variance components among populations; σ2s is the variance components within population.
The correlation between the phenotypic trait and geo-climate factor was analyzed using Pearson correlation analysis (Li et al. 2015). The dispersion degree of phenotypic traits was obtained based on mean coefficient of variation (CV) analysis using the following formula (Wang et al. 2008): CV=S/X. Where: S is standard deviation; X is the average value. According to the method of Lee et al. (2015), the 20 phenotypic traits were subjected to principal component analysis (PCA), which can present the primary information. Cluster analysis was carried out by Between-groups linkage method, and the measurement method was done by Squared Euclidean distance. Analyses and calculations above were done on SPSS v20.0.
Results
Variation character of phenotypic traits. The variance analysis showed that the phenotypic variation of leaf morphology reached extremely significant level whether within or among populations (DF among populations = 10, DF within populations = 77, F = 3.66-30.41, P < 0.01; Table 2), and that of reproductive phenotypic traits also reached significant or extremely significant level whether among populations or within populations (DF among populations = 10, DF within populations = 99, F = 1.29-27.45, P < 0.01; Table 2). All traits showed the higher variance for among population variation.
Table 2 Variance analysis of phenotypic traits in different provenances of T. sinense.
| Phenotypic traits | Abbreviation | Mean square | F values | ||||
|---|---|---|---|---|---|---|---|
| Among population |
Within population |
Random error |
Among population |
Within population |
|||
| Leaf | Leaf length | LL | 63.7920 | 17.4343 | 1.1693 | 3.66** | 14.91** |
| Leaf longest | LLEST | 101.6502 | 16.6064 | 1.2412 | 6.12** | 13.38** | |
| Total leaf length | LLT | 124.1168 | 25.8182 | 1.6131 | 4.81** | 16.01** | |
| Leaf petiole length | LPL | 23.1848 | 1.6253 | 0.1249 | 14.26** | 13.02** | |
| Leaf width | LW | 116.7289 | 9.8908 | 0.9066 | 11.80** | 10.91** | |
| Leaf area | LA | 14306.0173 | 1567.7652 | 144.0651 | 9.13** | 10.88** | |
| Leaf perimeter | LP | 1088.5987 | 128.3944 | 11.7823 | 8.48** | 10.90** | |
| Leaf shape index | LSI | 4.3430 | 0.3326 | 0.0203 | 13.06** | 16.35** | |
| Leaf base tapering index | LBPI | 1.8932 | 0.4103 | 0.0135 | 4.61** | 30.41** | |
| Leaf tip pointed index | LTPI | 0.2437 | 0.0239 | 0.0041 | 10.20** | 5.79** | |
| Reproductive organ | Infructescence weight | IW | 0.2226 | 0.0355 | 0.0098 | 6.27** | 3.62** |
| Infructescence length | IL | 35.5655 | 6.0975 | 2.5185 | 5.83** | 2.42** | |
| Fruit weight | FW | 0.00003833 | 0.00000323 | 0.00000085 | 11.87** | 3.79** | |
| Fruit length | FL | 3.4048 | 0.5639 | 0.1828 | 6.04** | 3.08** | |
| Fruit width | FW1 | 1.6299 | 0.1886 | 0.0759 | 8.64** | 2.49** | |
| Seed number per fruit | SN | 331.5740 | 64.0290 | 24.1839 | 5.18** | 2.65** | |
| Seed length | SL | 2.3356 | 0.1910 | 0.1260 | 12.23** | 1.52** | |
| Seed width | SW | 0.4574 | 0.01667 | 0.0125 | 27.44** | 1.33* | |
| Seed thickness | ST | 1.1185 | 0.083 | 0.058 | 13.48** | 1.43** | |
| Weight of 1000 seeds | WS | 2.9971 | 0.8353 | 0.6475 | 3.59** | 1.29** | |
** P ≤ 0.01
The mean within population CV of 20 phenotypic traits in T. sinense varied from 0.06 to 16.36, and the grand mean value was 4.80 (Table 3). The mean CV of leaf phenotypic traits (CV = 9.39) was higher than that of the reproductive phenotypic traits (CV = 0.21) (Table 3). The CV of LPL and LA was higher (12.02, 16.36 respectively) than that of the other leaf traits; the CV of SN was the highest (0.47) among reproductive traits.
Table 3 Variation coefficient of phenotypic traits of T. sinense Populations
| Traits(a) | KP | BMSM | ALM | DFD | BH | HBY | DZDSH | SNJ | WFHH | BDGM | SHM | Mean | |
|---|---|---|---|---|---|---|---|---|---|---|---|---|---|
| Leaf | LL | 7.11 | 8.28 | 5.23 | 8.14 | 8.27 | 8.17 | 6.27 | 12.37 | 16.08 | 9.37 | 3.41 | 8.43 |
| LLEST | 8.87 | 6.95 | 5.26 | 9.38 | 4.4 | 8.32 | 20.83 | 9.97 | 13.32 | 7.88 | 4.79 | 9.09 | |
| LLT | 10.21 | 8.14 | 4.98 | 9.21 | 3.32 | 6.85 | 6.92 | 11.68 | 14.89 | 9.24 | 2.54 | 8.00 | |
| LPL | 22.23 | 7.87 | 5.47 | 16.85 | 15.51 | 6.46 | 16.38 | 12.83 | 13.21 | 10.66 | 4.79 | 12.02 | |
| LW | 10.01 | 6.46 | 5.11 | 15.8 | 4.77 | 11.26 | 7.68 | 6.84 | 15.49 | 9.41 | 10.47 | 9.39 | |
| LA | 15.89 | 12.16 | 8.68 | 24.28 | 6.68 | 21.64 | 11.23 | 16.08 | 30.14 | 16.35 | 16.78 | 16.36 | |
| LP | 9.65 | 6.97 | 4.57 | 11.62 | 2.61 | 9.73 | 6.23 | 8.05 | 12.69 | 7.58 | 10.11 | 8.16 | |
| LSI | 3.51 | 6.02 | 4.51 | 10.33 | 4.62 | 5.88 | 9.22 | 10.91 | 8.89 | 10.89 | 7.32 | 7.46 | |
| LBPI | 8.06 | 5.91 | 3.8 | 11.54 | 5.65 | 10.35 | 3.67 | 17.54 | 14.19 | 12.07 | 6.53 | 9.03 | |
| LTPI | 0.14 | 13.44 | 8.64 | 5.39 | 3.42 | 3.87 | 4.65 | 5.6 | 8.87 | 7.5 | 4.01 | 5.96 | |
| Reproductive organ | IW | 0.32 | 0.34 | 0.29 | 0.31 | 0.43 | 0.38 | 0.16 | 0.22 | 0.38 | 0.29 | 0.25 | 0.31 |
| IL | 0.63 | 0.10 | 0.18 | 0.18 | 0.11 | 0.16 | 0.14 | 0.09 | 0.17 | 0.18 | 0.08 | 0.18 | |
| FW | 0.32 | 0.25 | 0.30 | 0.38 | 0.40 | 0.30 | 0.16 | 0.26 | 0.34 | 0.32 | 0.30 | 0.30 | |
| FL | 0.19 | 0.11 | 0.12 | 0.14 | 0.11 | 0.10 | 0.08 | 0.10 | 0.13 | 0.15 | 0.09 | 0.12 | |
| FW1 | 0.16 | 0.12 | 0.12 | 0.16 | 0.12 | 0.11 | 0.12 | 0.11 | 0.12 | 0.01 | 0.11 | 0.11 | |
| SN | 0.52 | 0.38 | 0.56 | 0.50 | 0.39 | 0.50 | 0.42 | 0.50 | 0.47 | 0.44 | 0.50 | 0.47 | |
| SL | 0.14 | 0.16 | 0.16 | 0.13 | 0.13 | 0.14 | 0.14 | 0.15 | 0.15 | 0.11 | 0.12 | 0.14 | |
| SW | 0.20 | 0.22 | 0.19 | 0.19 | 0.19 | 0.15 | 0.17 | 0.15 | 0.14 | 0.15 | 0.20 | 0.18 | |
| ST | 0.29 | 0.25 | 0.26 | 0.23 | 0.27 | 0.28 | 0.20 | 0.30 | 0.27 | 0.22 | 0.23 | 0.25 | |
| WS | 0.02 | 0.08 | 0.02 | 0.05 | 0.03 | 0.05 | 0.15 | 0.07 | 0.04 | 0.06 | 0.06 | 0.06 | |
| Mean | 4.92 | 4.21 | 2.92 | 6.24 | 3.07 | 4.74 | 4.74 | 5.69 | 7.50 | 5.14 | 3.63 | 4.80 |
(a): See Table 2 for phenotypic traits.
Among 11 populations, the CV of 20 phenotypic traits varied from 2.92 to 7.50 and the grand mean value was 4.80 (Table 3). Among these, the CV of phenotypic traits from WFHH was the highest (CV = 7.50), which was more than 2 times as much as that from ALM (CV = 2.92) with the smallest level of variation.
Phenotypic differentiation. The phenotypic differentiation coefficients among populations in T. sinense varied from 30.27 % to 91.67 %, and the mean value was 61.84 % (Table 4), which was higher than that within population (Vst = 38.16 %). The variance component among population accounted for 27.95 % of total phenotypic variation, which was higher that within population (18.67 %), suggesting that the phenotypic variation of T. sinense mainly existed among population. Differentiation coefficient of leaf traits among population (Vst = 53.25 %) was lower than that of the fruit and seed (Vst = 70.24 %), showed that the differentiation level of fruit and seed traits was higher than that of leaf.
Table 4 Variance portions and differentiation coefficients on phenotypic traits among/within populations of T. sinense.
| Traits | Variance component | Percentage of variance component (%) |
Phenotypic differentiation Coefficient (%) |
|||||
|---|---|---|---|---|---|---|---|---|
| Among populations |
Within populations |
Random error |
Among populations |
Within populations |
Random error |
|||
| Leaf | LL | 0.3816 | 0.8789 | 1.1693 | 15.70 | 36.17 | 48.12 | 30.27 |
| LLEST | 0.7416 | 0.8460 | 1.2411 | 26.22 | 29.91 | 43.88 | 46.71 | |
| LLT | 0.8192 | 1.3087 | 1.6131 | 21.90 | 34.98 | 43.12 | 38.50 | |
| LPL | 0.1858 | 0.0817 | 0.1249 | 47.35 | 20.82 | 31.82 | 69.46 | |
| LW | 0.9167 | 0.4855 | 0.9066 | 39.70 | 21.03 | 39.27 | 63.38 | |
| LA | 108.2438 | 76.8441 | 144.0651 | 32.89 | 23.35 | 43.77 | 58.48 | |
| LP | 8.1728 | 6.3013 | 11.7823 | 31.13 | 24.00 | 44.87 | 56.46 | |
| LSI | 0.0350 | 0.0169 | 0.0203 | 48.41 | 23.45 | 28.14 | 67.44 | |
| LBPI | 0.0135 | 0.0216 | 0.0135 | 27.72 | 44.47 | 27.81 | 38.46 | |
| LTPI | 0.0019 | 0.0011 | 0.0041 | 26.44 | 15.13 | 58.43 | 63.33 | |
| Reproductive organ | IW | 0.0062 | 0.0026 | 0.0098 | 33.60 | 13.85 | 52.55 | 70.45 |
| IL | 1.2278 | 0.4474 | 2.5185 | 29.28 | 10.67 | 60.05 | 73.29 | |
| FW | 0.00000059 | 0.00000024 | 0.00000085 | 35.03 | 14.19 | 50.79 | 71.08 | |
| FL | 0.0473 | 0.0381 | 0.1828 | 17.65 | 14.21 | 68.14 | 55.39 | |
| FW1 | 0.0240 | 0.0113 | 0.0759 | 21.61 | 10.14 | 68.26 | 67.99 | |
| SN | 7.0940 | 3.9845 | 24.1839 | 20.12 | 11.30 | 68.58 | 64.03 | |
| SL | 0.0214 | 0.0065 | 0.1260 | 13.93 | 4.22 | 81.85 | 76.70 | |
| SW | 0.0044 | 0.0004 | 0.0125 | 25.46 | 2.41 | 72.13 | 91.67 | |
| ST | 0.0011 | 0.0002 | 0.0058 | 15.36 | 3.43 | 81.21 | 84.62 | |
| WS | 0.0802 | 0.0899 | 0.1672 | 29.52 | 15.75 | 54.73 | 47.15 | |
| Mean | ---- | ---- | ---- | 27.95 | 18.67 | 53.38 | 61.84 | |
(a): See Table 2 for phenotypic traits.
Correlation between phenotypic traits and geo-climatic factors. Except for the LL and LSI, the remaining leaf traits had a significant negative correlation with longitude, and were positively correlated with elevation. In reproductive traits, SN had a significant negative correlation with longitude, and a positive correlation with elevation; SW, WS had a significant positive correlation with longitude, and a significant negative correlation with elevation; IW, FW, SN showed a significant negative correlation with latitude (Table 5).
Table 5 Correlation analysis of phenotypic traits to geo-climate variables.
| Traits(a) | Longitude | Latitude | Elevation | Ta | T1 | T7 | Td | Ha | Ar | Sa |
|---|---|---|---|---|---|---|---|---|---|---|
| LL | -0.564 | -0.421 | 0.635* | -0.446 | -0.05 | 0.528 | 0.149 | 0.276 | -0.310 | 0.131 |
| LLEST | -0.693* | -0.338 | 0.739* | -0.572 | -0.139 | -0.648* | -0.130 | 0.222 | -0.367 | 0.214 |
| LLT | -0.726* | -0.425 | 0.810** | -0.550 | -0.218 | -0.639* | -0.306 | 0.026 | -0.340 | 0.424 |
| LPL | -0.737* | -0.347 | 0.820** | -0.516 | -0.377 | -0.598 | -0.407 | -0.375 | -0.229 | 0.741* |
| LW | -0.851** | -0.147 | 0.868** | -0.712* | -0.512 | -0.74* | -0.556 | -0.098 | -0.522 | 0.7* |
| LA | -0.841** | -0.238 | 0.870** | -0.717* | -0.439 | -0.745* | -0.505 | -0.2 | -0.486 | 0.6 |
| LP | -0.82** | -0.335 | 0.879** | -0.661* | -0.367 | -0.734* | -0.394 | 0.025 | -0.388 | 0.517 |
| LSI | 0.675* | -0.107 | -0.653* | 0.555 | 0.595 | 0.550 | 0.588 | 0.351 | 0.439 | -0.827** |
| LBPI | -0.713* | -0.083 | 0.733* | -0.543 | -0.588 | -0.639* | -0.492 | -0.285 | -0.204 | 0.699* |
| LTPI | -0.708* | -0.028 | 0.690* | -0.512 | -0.488 | -0.593 | -0.590 | -0.273 | -0.441 | 0.875** |
| IW | -0.256 | -0.894** | 0.410 | -0.022 | 0.294 | -0.314 | 0.296 | 0.261 | 0.618 | 0.005 |
| IL | 0.056 | -0.100 | -0.047 | -0.015 | -0.369 | -0.085 | -0.150 | 0.324 | 0.562 | -0.199 |
| FW | -0.151 | -0.734* | 0.323 | 0.106 | 0.417 | -0.182 | 0.592 | 0.238 | 0.540 | -0.188 |
| FL | -0.2 | -0.172 | 0.225 | 0.205 | 0.158 | 0.069 | 0.459 | 0.138 | 0.011 | -0.235 |
| FW1 | -0.028 | -0.571 | 0.149 | 0.224 | 0.361 | -0.133 | 0.492 | 0.373 | 0.64* | -0.193 |
| SN | -0.687* | -0.759* | 0.855** | -0.321 | 0.067 | -0.579 | 0.061 | -1.8 | 0.104 | 0.543 |
| SL | 0.629 | 0.156 | -0.536 | 0.386 | 0.16 | 0.621 | 0.49 | 0.149 | 0.287 | -0.788** |
| SW | 0.758* | 0.280 | -0.749* | 0.565 | 0.151 | 0.610 | 0.421 | 0.298 | 0.404 | -0.952** |
| ST | 0.547 | 0.215 | -0.579 | 0.323 | 0.025 | 0.347 | 0.238 | 0.577 | 0.337 | -0.889** |
| WS | 0.749* | -0.022 | -0.688* | -0.595 | 0.295 | 0.6 | 0.573 | 0.343 | 0.665* | -0.936** |
Note: *P ≤ 0.05; **P ≤ 0.01. (a): See Table 1 for climate conditions, and see Table 2 for phenotypic traits.
LW, LA and LP were negatively correlated to Ta; LLEST, LLT, LA, LP, LW and LBPI were significantly negative correlated to T7 respectively; FW1 and WS showed a significant positive correlation with Ar respectively; LPL, LW, LBPI, LTPI and Sa showed a significant positive correlation respectively, while LSI, SL, SW, ST and WS were negatively correlated to Sa (Table 5). All traits had no correlation with T1, Td and Ha.
As a result, the phenotypic traits in T. sinense showed cline variation along longitude and elevation, and Sa was the dominant climate factor influencing the phenotypic variation.
Principal component and cluster analysis of phenotypic traits. Based on the 20 phenotypic traits investigated, PCA was carried out (Table 6). According to the standard deviation of phenotypic traits, five PC were extracted. The first PC concentrated 46.367 % of the total variance of phenotypic traits, the second 19.945 %, the third 14.581 %, the forth 6.650 %, the fifth 4.819 %. The cumulative contribution rate reached 92.362 %, basically reflecting the main information contained in the original index. LLEST, LLT, LPL, LW, LA, LP, LBPI, LTPI and SN had relatively large positive influence on the first component; conversely, LSI, SL, SW, ST and WS had negative influence. IW, FW and FW1 had positive influence on the second component. The third PC emphasized LL; and the fourth PC emphasized IL. While the fifth separated FL.
Table 6 Principal Component analysis of phenotypic characteristics.
| Variance(a) | PC1 | PC2 | PC3 | PC4 | PC5 |
|---|---|---|---|---|---|
| LL | 0.564 | 0.496 | 0.615 | -0.161 | 0.147 |
| LLEST | 0.633 | 0.502 | 0.477 | -0.179 | -0.058 |
| LLT | 0.821 | 0.337 | 0.413 | -0.027 | 0.147 |
| LPL | 0.933 | 0.013 | -0.100 | 0.168 | 0.131 |
| LW | 0.959 | 0.017 | 0.219 | 0.152 | 0.002 |
| LA | 0.920 | 0.152 | 0.332 | 0.081 | 0.098 |
| LP | 0.895 | 0.294 | 0.319 | 0.066 | 0.066 |
| LSI | -0.831 | 0.362 | 0.206 | -0.305 | 0.141 |
| LBPI | 0.867 | -0.087 | -0.197 | 0.329 | -0.118 |
| LTPI | 0.856 | -0.378 | -0.164 | 0.149 | -0.083 |
| IW | 0.153 | 0.763 | -0.452 | -0.205 | 0.335 |
| IL | -0.156 | 0.407 | -0.401 | 0.572 | 0.458 |
| FW | 0.035 | 0.861 | -0.401 | -0.251 | -0.136 |
| FL | 0.200 | 0.593 | 0.123 | 0.281 | -0.683 |
| FW1 | 0.105 | 0.660 | -0.585 | -0.182 | -0.258 |
| SN | 0.755 | 0.468 | -0.383 | -0.168 | 0.003 |
| SL | -0.605 | 0.466 | 0.207 | 0.424 | 0.023 |
| SW | -0.753 | 0.264 | 0.427 | 0.267 | -0.109 |
| ST | -0.649 | 0.378 | 0.518 | 0.228 | 0.012 |
| WS | -0.809 | 0.491 | 0.082 | 0.213 | 0.089 |
| Eigenvalue | 9.737 | 4.188 | 3.062 | 1.397 | 1.012 |
| Proportion of Variance (%) | 46.367 | 19.945 | 14.581 | 6.650 | 4.819 |
| Cumulative of Variance (%) | 46.367 | 66.312 | 80.893 | 87.543 | 92.362 |
(a):See Table 2 for phenotypic traits.
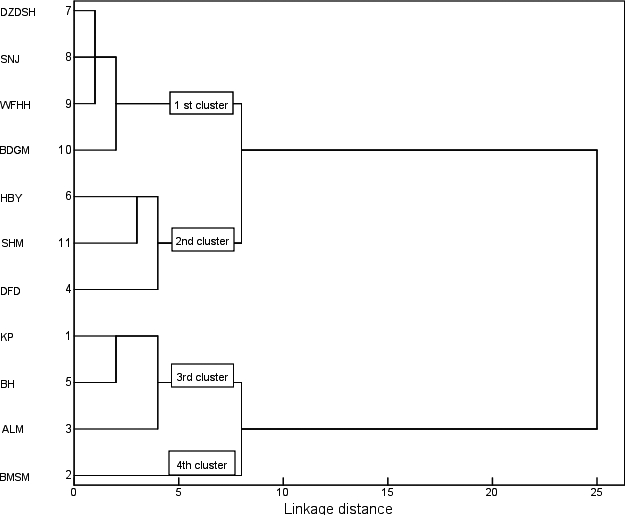
PCA scores were taken for cluster analysis (Figure 3). By using a Euclidean distance coefficient of 5, 11 provenances of T. sinense were clustered into four groups, namely cluster A, B, C and D. Cluster A includes DZDSH, SNJ, WFHH and BDGM; cluster B includes HBY, SHM and DFD; cluster C includes KP, BH and ALM; cluster D includes BMSM.
Discussion
The geo-climatic factors influencing phenotypic variation in T. sinense. The size of the distribution range and its ecological complexity are the main factors influencing the phenotypic variation in plants (Hunter 2003). In general, the phenotypic variation in woody plants was usually correlated with latitude, due to the temperature gradient (Jan & Jon 2010, Naia et al. 2013). In this study, 9 of 20 phenotypic traits in T. sinense had a significant negative correlation with longitude, and 10 traits had a positive correlation with elevation, only 3 indexes presented association with latitude, which indicating that the phenotypic variation in T. sinense showed cline along longitude and elevation, and latitude had few influence on phenotypic variation in T. sinense, different from the results in most woody plants, but in accordance with the result from Pyracantha crenulata and Cotinus szechuanensis (Pinyopusarerk & Williams 2005, Naia et al. 2013). As a rule, relative humidity would increase and annual sunshine hours would decrease with the increase of longitude, resulting in smaller size of leaf and seed in T. sinense. Moreover, high altitude is usually companied by low atmospheric pressure, low CO2 concentration and more rainy days, contributing to more rainfall and lower temperature, which can improve the efficiency of leaves photosynthesis and seed propagation (Daniel 2000, Connolly et al. 2003, Li 2014), accounting for the adaptive variation of T. sinense phenotypic traits. The findings had also further confirmed that T. sinense is suitable to survival under the micro-environment with low temperature and high humidity (Fu et al. 2001).
Under the comprehensive effect of natural selection, gene flow and genetic drift, several other geographic patterns (such as continuous variation, regional plate variation and random variation) will form the phenotypic variations in plants (Thompson & Daniel 1986; Young et al. 2010; Kevin 2011). For many plants, leaf and seed morphological character typically showed the regional plate features in some areas, whereas random variation pattern was presented in another areas, which was mainly influenced by the geographical position, average annual temperature, rainfall frost free period and other climatic factors (Hunter 2003; McKay 2005). The cluster analysis showed that adjacent provenances in T. sinense were grouped, such as provenance of KP and ALM, or provenance of SNJ and WFHH, indicating typical regional plate and continuous variation pattern, which corresponds to the cline variation of phenotypic traits along longitude and elevation. In addition, some provenances far away from each other were also grouped, such as provenance of SHM and DFD, presenting random variation pattern. The findings are in line with the result from Betula platyphylla (Liu et al. 1999) and Paulownia fortunei (Mo et al. 2013), wich may be correlated to the comprehensive effect of geo-climatic factors and genetic control (Murray et al. 2004, Pilar 2006).
Among the 11 populations of T. sinense, the CV of phenotypic traits in WFHH was the highest, indicating the relatively abundant phenotypic diversity, which was in consistent with the result from cpDNA marker (Sun et al. 2014). The reason may be correlated to the geographical position and topography. The WFHH is situated at the eastern of Wuling mountain, located in the transition zone from the second step to the third step of chinese topography, where there has the characteristics of complex topography, larger gap of above sea level and complicated micro-environment (Li et al. 2005), contributing to a variety of ecosystems and vegetation types (including evergreen broad-leaf forest, sub alpine shrub and sub alpine meadow), and then providing prerequisite advantage for higher phenotypic diversity. However, the population in Ailao mountain presents a low level of phenotypic diversity (CV = 2.79), which may be related to poor vegetation type (only Evergreen Broad-Leaved Forest existed in most regions), resulting in poorer habitat heterogeneity for biodiversity (Zhang et al. 2010).
The phenotypic diversity in natural populations of T. Sinense. In this paper, phenotypic variation of T. sinense reached significant level whether among or within populations. For leaf traits 4 of 10 traits have a higher among population component, and for reproductive traits 8 of 10 traits is really higher, indicating phenotypic variation of T. sinense mainly existed among population. Similar results have been reported on Rosa praelucens, Coptis teeta, Reaumuria soongarica and Miscanthus sinensis (Guan et al. 2012, Yang et al. 2013, Xiao et al. 2013). Meanwhile, the results from cpDNA marker in T. sinense also showed that phenotypic variation mainly resulted from the variation among populations (Sun et al. 2014). The cause may be correlated to the distinctive environment in different populations. During the long-term evolution, plant phenotypic traits presented stronger plasticity with the changing environment, and phenotypic plasticity having a larger ecological amplitude and stronger adaptability could penetrate into the vast area and occupy the heterogeneous habitat (Sun et al. 2005). According to field investigation, artificial destruction resulted in higher spatial heterogeneity among populations, which was the main cause for higher phenotypic variation among population of T. sinense.
In T. sinense, the mean value of phenotypic differentiation coefficients among populations was 61.84 %, which is lower than that in Rosa praelucens, Coptis teeta (Vst = 69.56 and 74.41 % respectively), but higher that in Ulmus lamellosa, Calycanthus chinensis, Pinus bungeana (Vst = 28.104, 17.1 and 22.86 % respectively) (Wang et al. 2008, Huang et al. 2011, Li et al. 2013). The result showed that the phenotypic differentiation among populations in T. sinense is at moderate level. Sun et al. (2014) also reported the higher genetic differentiation among populations in this species based on cpDNA marker. In this study, the CV of total phenotypic variation among populations in T. sinense varied from 2.92 to 7.50, and the mean is only 4.80, which is significantly lower than that in other endangered plants, such as Rosa praelucens, Coptis teeta, Ulmus lamellose, Calycanthus chinensis (Wang et al. 2008, Huang et al. 2011, Li et al. 2013), indicating the popularly lower level of phenotypic diversity in T. sinense. To better evaluate the level of genetic diversity and genetic divergence among populations in T. sinense, further investigation of molecular marker based on nuclear genome is urgently needed. Taking into account that these molecular markers could not reflect variation due to phenotypic plasticity within populations, identifying the genes involved and searching for genetic variation within populations is also needed.
Selfing plant species with relatively more homozygous individuals and reduced effective population size, usually display lower genetic variation and higher genetic differentiations than outcrossers (Spielman et al. 2004). Due to the smaller population size and harsh environmental condition, the successful reproduction for T. sinense may only rely on self-pollination or geitonogamy in most cases (Gan et al. 2013). Therefore, autogamy or geitonogamy is likely to account for the low level of phenotypic variation and comparably higher phenotypic differentiation within the species T. sinense.
Life history traits including seed dispersal mechanism are correlated to the genetic diversity and structure in plants. Geographical isolation can result in loss of genetic variation and high genetic differentiation, particularly when coupled with small population sizes and low levels of gene flow (Frankham et al. 2002, Marchelli et al. 2010). The small population size of T. sinense with a few dozen individuals makes this species suffer from low level of genetic diversity. In addition, the early geological changes and recently artificial destruction resulted in the fragmented habitat of T. sinense, and then formed long-term geographical isolation between populations in T. sinense (Sun et al. 2014). The geographical isolation and its gravity-dispersed seeds (no effective vector was observed for its seeds dispersal during our field investigations), make long distance migration difficult, which would restrict the gene flow between populations and promote genetic differentiation. In consequence, all these factors may also contribute to the low phenotypic diversity and comparably higher phenotypic differentiation in T. sinense.
Implications for T. sinense conservation. Drawing on our study results, we suggest possible management strategies for the conservation of T. sinense. Considering the lower level of phenotypic variation within population and the medium level of phenotypic differentiation among populations due to geographical isolation and restricted gene flow in this species, the primary strategy is to carry out in situ conservation to preserve all the extant populations, so that the vast majority of genetic variability can be conserved (Zhou et al. 2010). One way to recover small inbred populations with low genetic diversity is to introduce genetically unrelated individuals from other inbred populations (Frankham et al. 2002). Therefore, inter-population introduction of individuals via appropriate propagation and seedling management might be an effective strategy to retain genetic diversity within populations of T. sinense, especially for the ALM population. Due to the most abundant phenotypic variation, the WFHH population should be selected as the prioritizing population for in situ conservation, as well as the germplasm sources of genetic breeding.
Conclusion
Phenotypic variation in T. sinense mainly existed among populations, and there was moderate level of phenotypic differentiation among populations and low level of phenotypic variation within populations in T. sinense. Autogamy or geitonogamy may be the major factor contributing to the low phenotypic variation and comparably higher genetic divergence within this species. The phenotypic variation in T. sinense showed regional plate and continuous variation pattern in some populations, and random variation pattern in others. Suggestions for conservation strategies are provided to preserve the genetic resources of T. sinense.

