


 nueva página del texto (beta)
 Inglés (pdf)
 Artículo en XML
 Referencias del artículo
 Enviar artículo por email
 Citado por SciELO
  Similares en
SciELO
Similares en
SciELO 
 Permalink
Castor bean (Ricinus communis L.) is a tropical perennial shrub that originated in Eastern Africa (Ethiopia), but is now cultivated in many tropical and subtropical regions around the world (Chan et al. 2010, Lakhani et al. 2015). It is an oilseed crop that belongs to the spurge family (Euphorbiaceae), which contains about 300 genera and 6,300 to 7,500 species (Chan et al. 2010, Singh & Geetanjali 2015). The genus Ricinus L. is monotypic, with R. communis (2n = 20) being the only species (Ramprasad & Bandopadhyay 2010). R. communis is a shrub-like plant with reddish to purple stems that may reach 4–5 m in height. The large (10–76 cm), umbrella-like leaves have 5–9 pointed, finger-like lobes. Long purple leaf-stems are attached near the centers of the leaf blades (Falasca et al. 2012). R. communis is monoecious, with separate male and female flowers on the same individual. There are no petals and each female flower consists of a little spiny ovary and a bright red structure with stigma lobes that receives pollen from male flowers. Each male flower consists of a cluster of many stamens which literally smoke as they shed pollen in a gust of wind (Ladda & Kamthane 2014). Seed size ranges from 0.08-0.9 g by weight and 0.8-1.9 cm by height and there are two varieties: small seeded variety and large seeded variety (Akande et al. 2012). The genome of R. communis is being sequenced (Chan et al. 2010); the reported assembly covered the genome ~4.6×, spanning 350 Mb and 31,237 gene sequences were identified by these authors.
Morphological description of seeds requires the comparison with geometric figures that resemble seed images. The approach has been developed in the model plant (Arabidopsis thaliana (L.) Heynh., Cervantes et al. 2010) as well as in the model legumes, Lotus japonicus and Medicago truncatula (Cervantes et al. 2012). In Capparis spinosa L. the comparison of seed images with the cardioid was helpful to describe differences between two subspecies. Higher variation in seed shape was found in populations of Capparis spinosa Subsp. spinosa L. than in Subsp. rupestris (Sm) Nyman (Saadaoui et al. 2013). In Jatropha curcas L. (Euphorbiaceae), a relationship was found between yield and seed size and shape, lower yields being associated with smaller seed size and poorer adjustment of the seed to morphological models (Saadaoui et al. 2015a).
In Ricinus communis, high phenotypical variability is observed in the seeds (Khan et al. 2014). Our previous work presented variations in size, shape, and color of seeds in plants of castor bean grown in twelve locations in Tunisia (Martín-Gómez et al. 2016). In the analysis of seed shape, the model applied for the geometric description was an ellipse. J index indicated the percent of similarity of seed images with an ellipse. Among the parameters measuring seed shape, roundness varied more than J index. Values of J index were superior, thus J index describes better than roundness the shape of R. communis seeds. Seed size and color presented higher variation than magnitudes concerning shape indicating that shape is more conserved in R. communis seeds, than size or color. Differences in size and shape were found among climatic regions. Reduced size, J index and color intensity values were observed together with increased values of roundness in seeds obtained from the population grown in the desert (Martín-Gómez et al. 2016). Seeds from this study were used as parentals in the work reported here thus allowing for the first time the comparison of seed shape between cultivated seeds and their wild parentals from diverse geographical origins.
Despite the great economic importance and wide distribution of Ricinus communis in Tunisia, no work has been published yet on the genetic variability of this spontaneous species. Agro-phenotypical variability has been evaluated in twelve populations issued from seeds obtained from plants existing from North to the South of the country and the seed yield and quality of each provenance estimated. The populations were cultivated and evaluated in the same field to obtain homogeneous conditions of environment and culture. The values obtained for seed shape are compared with data already published on the populations used as the source of seeds used in this experiment (Martín-Gómez et al. 2016).
Our objective is to analyze the level of variability between populations and in climatic regions, to describe morphotypes and try to find phenotypic parameters to select productive populations.
Materials and Methods
Plant material. In summer 2014, mature racemes were harvested and seeds were obtained from plants growing spontaneously in 12 Tunisian sites (Figure 1; Table 1). These populations were planted together in the experimental station of INRGREF in Gabes (33°54’ N and 10°02’ E). Fifty five plants of castor bean were studied.

Figure 1 Localization in the map of Tunisia of the populations that are at the source of the seeds used in the present study. (1) Nefza, (2) Mateur, (3) Mornag, (4) SidiBou Ali, (5) Souassi, (6) Bouthady, (7) Gabes, (8) Matmata, (9) KsarJdid, (10) Medenine, (11) Ghomrassen, (12) Kebili.
Table 1 Codes, coordinates, altitudes and bioclimates of studied sites.
| Population | Code | Number of plants | Latitude (N) | Longitude (E) | Altitude (m) | Bioclimate |
|---|---|---|---|---|---|---|
| Nefza | P1 | 4 | 36° 58’ 36.53” | 9° 03’ 51.01” | 34 | Humid and |
| Mateur | P2 | 5 | 37° 01’ 51.80” | 9° 52’ 51.67” | 23 | Sub-humid |
| Mornag | P3 | 5 | 36° 41’ 40.78” | 10° 18’ 21.19” | 52 | Upper and inferior |
| SidiBou Ali | P4 | 5 | 35° 57’ 05.03” | 10° 28’ 17.92” | 20 | semi-arid |
| Souassi | P5 | 5 | 35° 20’ 20.77” | 10° 32’ 24.30” | 55 | Upper and inferior |
| Bouthady | P6 | 4 | 35° 04’ 10.43” | 10° 15’ 56.32” | 124 | arid |
| Gabes | P7 | 4 | 33° 52’ 23.25” | 10° 07’ 40 04” | 46 | |
| Matmata | P8 | 4 | 33° 32’ 25.81” | 09° 57’ 95.03” | 375 | |
| KsarJedid | P9 | 5 | 33° 18’ 03.93” | 10° 17’ 37.84” | 208 | |
| Medenine | P10 | 4 | 33° 21’ 40.50” | 10° 28’ 59.44” | 100 | |
| Ghomrassen | P11 | 5 | 33° 03’ 32.33” | 10° 19’ 35.01” | 93 | |
| Kebili | P12 | 5 | 33° 38’ 44.94” | 8° 59’ 38.66” | 45 | Saharan |
Chemical characteristics of soil. Soil of the experimental station is sandy, characterized by pH = 7.53, Electric conductivity CE = 8.82 mS/cm, rate of organic matter OM = 6.5 % and rate of gypsum (CaSO42H2O) is 7.89 %.
Experimental protocol. Seedlings were planted in September 2014. Each population was represented by 4 to 5 plants. The experiment was conducted in a randomized block design with 12 plants per plot, and 5 replicates. The spacing was 1 × 2 m (5,000 plants/hectare). After ten months, morphological parameters of leaf, fruit and seed were analyzed, seed yield was measured and the percentage of aborted seeds was quantified.
Morphological Traits analyzed in plants. Leaf traits.- For five developed leaves of each plant, four traits were measured: limb length, width and area (L, W and A respectively) and length of the petiole (PL). Petiole length, limb length and limb width were measured by graduated ruler (e = 1 mm). Leaf area was measured by a digital planimeter, with 0.1 cm2 resolution and 0.2 % precision.
Fruit and seed traits.- Twenty fruits per plant were used, a total of 1,100 fruits were studied. The measured parameters are length (FL) and width (FW) of the fruit (capsule), weight of each fruit (WF) and the weight of all seeds in each fruit (WG). Fifty seeds per plant were used, 2,750 seeds in total. We measured length, width, thickness, weight of each seed (SL, SW, Ha and PS, respectively). Length, width and thickness were measured by Calliper (e = 0.1 mm). Seeds and fruits were weighed by electronic balance (Scaltec SBA 41, e = 0.001 g).
Seed image analysis.- Roundness is a measure of the similarity between a plane figure and a circle given by
Where A is the length of the major axis. It ranges from zero to one giving the value of 1 for circles and it is a useful magnitude as a first approximation to seed shape. It is preferred here to circularity index because the latter is very sensitive to alterations in the margin of the figure.
J index measures the degree of similarity of a plane figure with an ellipse. An ellipse can be defined as the locus of all points that satisfy the equation
Where (x, y) are the coordinates of any point on the ellipse, and (a, b) are the radius on the x and y axes respectively.
Seed images were adjusted to an ellipse whose relation between the major and minor axes (a and b) equals 1.43. The ratio was chosen after measuring the ratios between axes in a sample of seeds (Martín-Gómez et al. 2016). J index was defined previously for quantification of Arabidopsis Heynh seed shape in comparison to a cardioid (Cervantes et al. 2010) and here is used to measure the adjustment of seed shape to the ellipse. To obtain J index, composed images containing an ellipse and the seed (Figure 2) were elaborated for each seed with the software Corel PaintShop Pro X5. The ellipse was drawn with CorelDRAW X6. Area quantification was done with Image J (Java Image Processing Program).

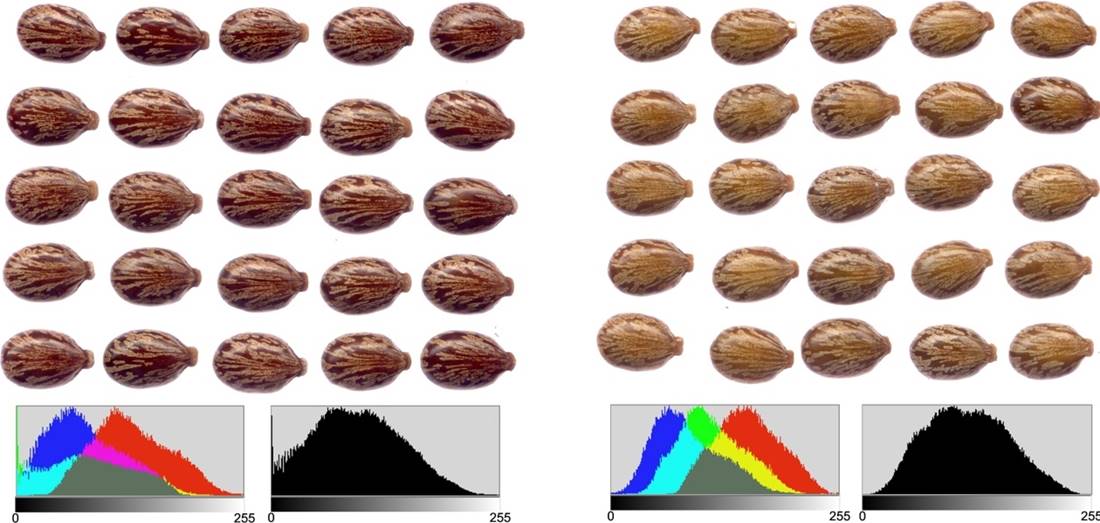
Figure 2 Seeds of Ricinus communis showing the method used in the calculation of J index. To obtain J index, composed images containing an ellipse and the seed were elaborated for each seed with the software Corel PaintShop Pro X5. The ellipse was drawn with CorelDRAW X6. Area quantification was done with Image J (Java Image Processing Program).
Quantification of the adjustment was done in each seed as a proportion between the areas in two regions: The common region in the ellipse and the seed image (area C), and the sum of total regions of both images; the seed and the ellipse (Figure 2). The index of adjustment (J index) is defined by:
Where area (C) represents the common region and area (D) the regions not shared. Note that J index ranges between 0 and 100, and decreases when the size of the non-shared region grows. It equals 100 when ellipse and seed image areas coincide, i.e., area (D) is zero. J Index was calculated for a total of 1398 seeds.
Seed color.- Intensity of grey and RGB values were obtained with CorelDRAW X6. The RGB color model is one of the most common ways to encode color in computing and diverse programs may give for each image the relative contribution of each of the three colors (Red, Green and Blue). Please remark that lower gray values correspond to darker seeds.
Yield traits. In 2015, the production of seeds for each individual was scored twice a week; the harvest was staggered over seven months, from June to December 2015. The harvested seeds were weighed (balance Scaltec SBA 41, e = 0.001 g). For each population, three batches of 20 seeds were analyzed to determine the number of light (aborted) seeds (seed weight < 0.30 g).
Statistical analysis. For the twelve morphological traits, the effect of the population was determined by the analysis of variance (ANOVA). The values of F and p obtained in each analysis are given. The comparison of the averages was realized by using the Tukey test (α = 0.05). Statistical analysis was done with SPSS software and included also the elaboration of a matrix of coefficient of simple linear correlation between variables. The relationship between populations was analyzed by hierarchical ascendant classification (HAC), realized by Xlstat, 2015 software.
Results
Diversity among populations. Morphological characters.- The analysis of variance showed a high and significant variation for most leaf, fruit and seed traits (F values for leaf length, leaf width, leaf area and petiole length were 20.2, 18.6, 13.9 and 6.9 respectively being 11 and 263 the degrees of freedom inter and intra-groups respectively; F values for fruit length, fruit width, weight of fruit and grain weight were of 74.6, 93.7, 98.3 and 109.7 respectively being 11 and 1075 the degrees of freedom inter and intra-groups respectively; F values for seed height, length, width and weight were of 25.3, 383.1, 491.3 and 233.6 being 11 and 3259 the degrees of freedom respectively; P = 0.00 in all cases).
Tukey test (at P < 0.05) revealed four groups for leaf width, leaf area (W and A) and petiole length (PL); seven groups for leaf length (L), fruit length (FL) and weight of grains (WG) and 9 groups for seed width (SW) (Tables 2 and 3). Thus, in general fruit and seed descriptors are more variable than leaf descriptors. For fruits and seeds, Gabes and Sidi Bou Ali populations (P7 and P4 respectively) presented the lowest values in the majority of parameters, whereas Souassi population (P5) presented the highest values; its fruits and seeds were the biggest (Table 3).
Table 2 Mean values of the analyzed parameters of the leaf and groups resulting from Tukey test.
| Population | Code | A (cm2) | L (cm) | W (cm) | PL (cm) |
|---|---|---|---|---|---|
| Nefza | P1 | 592 b.c.d | 41.3 b,c,d | 37.6 b.c | 35.1 a,b |
| Mateur | P2 | 372.8 a | 31.9 a | 30.5 a | 31.9 a |
| Mornag | P3 | 608.9 c.d | 46.5 d,e,f,g | 41.8 c.d | 37.1 b,c,d |
| SidiBou Ali | P4 | 504.3 b.c | 41 b,c | 37.4 b.c | 36.4 a,b |
| Souassi | P5 | 658.6 d | 46.7 e,f,g | 42 c.d | 35.7 a,b |
| Bouthady | P6 | 553.6 b.c.d | 41.5 b,c,d,e | 39.2 b.c | 37.6 b,c,d |
| Gabes | P7 | 642.5 d | 49.8 g | 46.35 d | 42.1 d |
| Matmata | P8 | 578.2 b.c.d | 43.1 b,c,d,e,f, | 39.8 b.c | 37.3 b,c,d |
| KsarJedid | P9 | 490.3 b | 38.9 b | 36.3 b | 35.4 a,b |
| Medenine | P10 | 649.8 d | 47.1 f,g | 42.3 c.d | 39.9 b,c,d |
| Ghomrassen | P11 | 618.3 d | 45.0 c,d,e,f,g | 42.2 c.d | 41.8 c,d |
| Kebili | P12 | 616.4 d | 48.0 f,g | 45.9 d | 36.8 a,b,c |
Table 3 Mean values of the analyzed parameters of the fruit and seed and groups resulting from Tukey test.
| Fruit | Seed | |||||||
|---|---|---|---|---|---|---|---|---|
| Populations | FL (mm) | FW (mm) | WF (g) | WG (g) | Ha (mm) | SL (mm) | SW (mm) | WS (mg) |
| P1 | 21.6 d | 18 c | 2.39 b | 1.57 c | 6.98 b.c.d | 9.84 d | 15.64 f | 521 c |
| P2 | 21.7 d.e | 18.7 d | 2.39 b | 1.52 c | 7.28 d.e.f.g | 9.81 d | 14.88 b.c | 505 c |
| P3 | 22.5 f.g | 19.4 e | 2.76 e,f | 1.79 e.f | 7.60 g | 10.48 f | 16.53 i | 594 f |
| P4 | 20.2 a | 17.2 a | 2.17 a | 1.43 b | 6.86 a.b.c | 9.7 c | 15.15 d.e | 480 b |
| P5 | 22.6 g | 19.1 e | 2.83 f | 1.85 f | 7.59 f,g | 10.57 f | 16.46 i | 615 g |
| P6 | 20.6 a.b | 17.6 b | 2.22 a | 1.43 b | 6.67 a.b | 9.48 b | 15.03 c.d | 475 b |
| P7 | 20.2 a | 17.3 a.b | 2.11 a | 1.31 a | 6.7 a.b | 9.19 a | 14.82 b | 444 a |
| P8 | 22.1 e.f | 18.5 d | 2.59 c.d | 1.71 d.e | 7.27 d.e.f | 10.2 e | 16.55 i | 575 e |
| P9 | 22.2 e.f.g | 19.2 e | 2.69 d.e | 1.75 e | 7.16 c.d.e | 10.28 e | 16.23 h | 587 e.f |
| P10 | 20.9 b.c | 18 c | 2.53 c | 1.66 d | 7.22 d.e | 10.23 e | 16.03 g | 556 d |
| P11 | 21.2 c.d | 18.1 c | 2.37 b | 1.54 c | 7.37 e.f.g | 9.8 c,d | 15.19 e | 511 c |
| P12 | 20.5 a.b | 17.4 a.b | 2.12 a | 1.40 b | 6.57 a | 9.5 b | 14.59 a | 457 a |
A positive correlation (R > 0.74) was found between the parameters of fruit (FL, FW, WF and WG) and seed (Ha, SW, SL and WS), as well as between all parameters of the leaf (L, W, A and PL; R > 0.69; not shown).
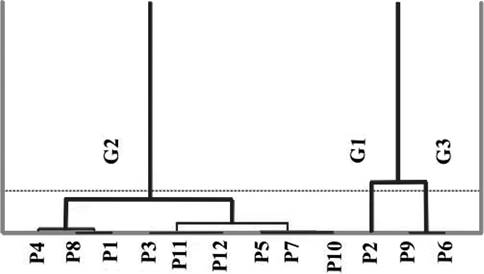
Three groups were identified by hierarchical ascendant classification (HAC). The first (G1) contains the population of Mateur (P2), characterized by a small leaf size, a large fruit and a small seed. However, the seed is characterized by elevated thickness value. The second group (G2) includes nine populations (P1, P3, P4, P5, P7, P8, P10, P11 and P12), characterized by intermediate values between the first and third groups for the dimensions of the fruit and seed, with exception for the width of the seed, which is reduced. It is also characterized by a large size of leaf and a long petiole. The last group (G3) contains two populations (P6 and P9), characterized by a reduced length of the fruit, and long and broad seeds with reduced thickness (Figure 3).
Seed size (image area) and shape.- Image area, roundness and J index varied between populations. F values for the comparisons of seed size and shape were of 152.8 for the area, 11.8 for J index and 41.1 for roundness values (P = 0.00 in all cases); five independent groups were obtained based on seed image area (Table 4). Seeds from populations P12 and P7 (Kebili and Gabes respectively) were smaller, whereas seeds from populations P3 and P5 (Mornag and Souassi) were larger. Roundness revealed six groups with Matmata (P8) having lowest values and Mateur (P2), Ghomrassen (P11) and Kebili (12), highest. J index values were lower in Mateur (P2) and Gabes (P7) and higher in Nefza (P1) and Kebili (P12).
Table 4 Mean values for seed area, roundness, J index and gray value for each population and groups resulting from Tukey test.
| Label | N | Area | Roundness | J index | Gray Value |
|---|---|---|---|---|---|
| P1 | 99 | 1.17 c | 0.647 b.c.d | 89.9 c | 102.0 a |
| P2 | 124 | 1.12 b | 0.667 e.f | 88.9 a | 106.9 b |
| P3 | 125 | 1.33 e | 0.646 b.c.d | 89.2 a.b | 111.0 b.c |
| P4 | 125 | 1.12 b | 0.647 b.c.d | 89.1a.b | 122.4 e,f |
| P5 | 125 | 1.29 e | 0.653 d | 89.3 a.b | 116.4 d |
| P6 | 100 | 1.11 b | 0.651c.d | 89.5 b.c | 123.7 e,f |
| P7 | 100 | 1.04 a | 0.647 b.c.d | 89.0 a | 120.4 d,e,f |
| P8 | 100 | 1.26 d | 0.634 a | 89.2 a.b | 115.6 c,d |
| P9 | 125 | 1.23 d | 0.639 a.b | 89.1a.b | 122.0 e,f |
| P10 | 125 | 1.17 c | 0.644 b.c | 89.5 b.c | 119.1 d,e |
| P11 | 125 | 1.12 b | 0.663 e | 89.5 b.c | 124.7 f |
| P12 | 125 | 1.06 a | 0.675 f | 90.0 c | 119.4 d,e |
Seed color.- F values for the comparison of seed color intensity were of 78.3 (P = 0.00). Tukey test (Table 4) revealed six groups with lower values in Nefza (P1), then Mateur (P2); two populations of the north and higher in Ghomrassen (P11), existing in the extreme south (Table 4).
Seed yield.- F value for the comparison of seed yield was of 6,15 (P = 0.00). Mateur (P1) is the only winter-flowering population, all the rest flower in spring (Table 5). The fruiting period is from mid-May until late December, the peak of production was observed in June. Seed yield per plant varied significantly between populations (P < 0.05), the average of production is 292.3 ± 97,7 g/plant/year, Souassi (P5, in the Center) and Ghomrassen (P11, in the South) showed the highest average yield (434.7 and 408.5 g/plant/year respectively) and Nefza lowest (98,8 g/plant/year).
Table 5 Average seed yield per plant and percentage of aborted seeds for each population and groups resulting from Scheffé test.
| Population code |
Beginning of flowering period |
Seed yield (g/plant/year) |
Seed yield (tone/hectare/year) |
Percentage of Aborted seeds |
|---|---|---|---|---|
| P1 | End of April 2015 | 98,8a | 0,49 | 13b |
| P2 | December 2014 | 215,3a,b | 1,07 | 4,33a,b |
| P3 | Beginning April 2015 | 385,6a,b | 1,92 | 6,24a,b |
| P4 | End of April 2015 | 266,2a,b | 1,33 | 1,99a,b |
| P5 | Beginning April 2015 | 434,7b | 2,17 | 3,33 a,b |
| P6 | End of April 2015 | 399a,b | 1,99 | 4,58a,b |
| P7 | End of April 2015 | 174,6a,b | 0,87 | 7,49a,b |
| P8 | End of April 2015 | 193,5a,b | 0,97 | 7,08a,b |
| P9 | Beginning April 2015 | 196,2a,b | 0,98 | 2,99a,b |
| P10 | End of April 2015 | 364,6a,b | 1,82 | 2,5a,b |
| P11 | End of April 2015 | 408,5b | 2,04 | 6,99a,b |
| P12 | End of April 2015 | 370,8a,b | 1,85 | 0,33a |
Percentage of aborted seeds.- F value for the comparison of percentage of aborted seeds was of 3,35 (P = 0.02). The average of aborted seeds is 5.07 ± 3.36 %. The lowest value was 0.33 ± 0.34 % in Kebili population (P12), belonging to Saharan bioclimate. The highest was 13 ± 6.52 % for Nefza population (P1), which exists in the extreme north and belongs to humid bioclimate (Table 5). P1 is also characterized by the lowest yield seed (0.48 tone/hectare/year).
Diversity among climatic regions. Relationship between climate and characteristics of leaf and fruit.- The climate has a significant effect on leaf and fruit variability. F values were of 13.1, 26.5, 30.3, and 10.1 for leaf area, leaf length, leaf width and petiole length respectively; 20.5, 25.3, and 38.9, for fruit length, fruit width, and weight of fruit respectively and 23.5, 102.1, 237.4, and 102.6 for seed height, seed length, seed width and seed weight respectively (P = 0.00 in all cases). In humid and sub-humid climates, plants showed reduced leaf area and high petiole length (Table 6a). In Sahara, the plants showed a smaller fruit (Table 6b) as well as smaller seeds (Table 6c).
Table 6 Mean values for climatic regions for leaf, fruit and seed magnitudes, and their respective groups obtained from Scheffé analysis. In a) leaf area (A), leaf length (L), leaf width (W), petiole length (PL). In b), fruit length (FL), fruit width (FW) and weight of fruits (WF); and in c) Seed height (Ha), seed length (SL), seed width (SW) and grain weight (WG).
| Leaf Bioclimate |
N | A | L | W | PL |
|---|---|---|---|---|---|
| Humid and subhumid | 45 | 470.2 a | 36.1 a | 33.6 a | 33.3 a |
| Semi-arid | 50 | 556.6 b | 43.8 b | 39.6 b | 36.8 b |
| Arid | 155 | 597.8 b | 44.5 b,c | 41.05 b | 38.4 b |
| Saharan | 25 | 616.4 b | 48.0 c | 45.9 c | 36.8 b |
| a) | |||||
|
Fruit Bioclimate |
N | FL | FW | WF | |
| Humid and subhumid | 170 | 21.65 b | 18.38 b | 2.39 b | |
| Semi-arid | 200 | 21.35 b | 18.27 b | 2.47 b,c | |
| Arid | 617 | 21.47 b | 18.31 b | 2.49 c | |
| Saharan | 100 | 20.49 a | 17.37 a | 2.12 a | |
| b) | |||||
|
Seed Bioclimate |
N | Ha | SL | SW | WG |
| Humid and subhumid | 510 | 7.15 b | 9.82 b | 15.22 b | 0.512 b |
| Semi-arid | 600 | 7.23 b | 10.09 d | 15.84 c | 0.537 c |
| Arid | 1860 | 7.16 b | 9.99 c | 15.78 c | 0.541 c |
| Saharan | 301 | 6.57 a | 9.50 a | 14.59 a | 0.458 a |
| c) |
Relationship between climate and seed morphology characteristics.- For the seed parameters F values were of 68.2, 70.3, 15.7, 173.2, and 236.3 for area, roundness, J index, upper gray and lower gray respectively. Sahara plants presented the lowest area values (Table 7).
Table 7 Mean values for seed area, roundness, J index and Gray for climatic regions and groups resulting from Scheffé test.
| Climatic region | Number of seeds |
Area (cm2) |
Roundness | J Index | Value gray (Upper) |
Value gray (Lower) |
|---|---|---|---|---|---|---|
| Humid and sub-humid | 223 | 1.14 b | 0.66 b | 89.3 a | 105 a | 95 a |
| Upper and inferior semi arid | 250 | 1.22 d | 0.65 a | 89.2 a | 117 b | 109 b |
| Upper and inferior arid | 800 | 1.18 c | 0.65 a | 89.3 a | 120 c | 111 c |
| Saharan | 125 | 1.06 a | 0.68 c | 90.0 b | 119 c | 113 c |
In addition, image analysis reveals higher values for roundness, J index and gray value for plants in the Saharan bioclimate. It may be remarked that higher values of gray value mean reduced intensity of color (Table 7).
Discussion
Our results show high phenotypical diversity of wild Tunisian Ricinus communis, essentially for seeds and fruits. Indeed, similar level of variability is showed by other authors. In Italy, Baldanzi et al. (2015) showed large diversity after study of 90 inbred lines. In Spain, 121 accessions are studied and hundred-seed weight showed a wide range of variation from 11.6 to 59.1 g (Velasco et al. 2015). In Egypt, Two morphological patterns of Ricinus communis seeds are described from 60 samples; in the first, seeds are gray with smooth surface; in the second, seeds are grayish with brown spots, and have a perforated surface (Shaheen 2002). In Nigeria, two varieties have been obtained based on seed size and named large seeded variety major (LSV) and small seeded variety minor (SSV). LSV exists in two colors, white and dark while the SSV exists mainly in dark color (Akande et al. 2012).
The study of 12 Indian populations by Goyal et al. (2014) shows high phenotypic variation in plant height, specific leaf area, seed size, seed weight, and leaf proline content. Conversely, in Iran, Goodarzi et al. (2011) studied genetic diversity on 12 accessions of castor bean, 32 agro-morphological traits are analyzed; their result showed low morphological variability. Large variation in phenotypic expression is explained essentially by the cross-pollinated of castor bean (Milani & Nóbrega 2013).
Phenotypic variability is observed mainly in seed characters. Khan et al. (2014) analyzed morphological diversity of seeds of wild Ricinus communis in Pakistan; they registered variation in color from red, white, grey, faint chocolate to purple. The length, width and thickness of seeds averaged to 13.85, 8.45 and 5.63 mm respectively with low variation; the seeds are fairly consistent in size and shape. Sphericity (%), volume (mm3) and area (mm2) are 62.8; 361.5 and 177.1; the maximum variation is exhibited by the surface area (10.6 %) and the volume (11.8 %).
For one year old plants, the populations of Souassi (P5) and Ghomrassen (P11) showed the highest seed yield (equivalent to 2 tone/hectare/year). A similar result was recorded by Plaza et al. (2011) in Colombia for a productive variety (2.2 tone/hectare/year) and showed high production of seeds for some Tunisian genotypes. Thus, we noticed that the population of Nefza (P1), which belongs to humid bioclimate is the least productive (0.5 tone/hectare/year). Probably, this population is not adapted to the climatic conditions of Gabes. It presented a low production and high percentage of aborted seeds (13 %). Anastasi et al. (2015) compared a Tunisian genotype of Medenine region (P10), with other Brazilian and Italian genotypes. They obtained 4.05 tone/hectare/year for one year old plants and 7.35 tone/hectare/year for two-year old plants and 1.5 to 5.9 tone/hectare/year for one and two years old plants respectively with Brazilian and Italian genotypes. In the world, Campbell (2013) indicated a seed yield from 0.2 to 1.2 tone/hectare/year for ten major producing countries. In Crete-Greece, Chatzakis et al. (2011) registered 4.5 to 6.2 tone/hectare. In Turkey, seed yield obtained by Öztürk et al. (2014) was 2.5 tone/hectare/year. In Texas (USA), Oswalt et al. (2014) obtained yields of 1.9, 3 and 3.4 tone/hectare/year for three cultivars (Al Guarany, Brigham and Hale respectively). All results showed interesting seed production for Tunisian genotypes in Mediterranean conditions. In addition, in Tunisia, Ricinus communis showed higher seed production than other biodiesel species as Jatropha curcas which showed a maximum seed production of 0.8 tone/hectare/year recorded by Saadaoui et al. (2015b) for the most productive accessions and for seven years old plants.
The population grown from Mateur (P2) was the first in flowering and fruiting with low seed yield (1.07 tone/plant/year). Indeed, this population has a winter blooming and differs from the other populations in a reduced size of the leaf. Also, P1, P7 and P8, the late populations in seeds maturity, presented low seed yield; their seed yield is 0.49; 0.87 and 0.97 tone/hectare/year respectively.
The percentage of aborted seeds varied between populations, the minimum is 0.3 % in Kebili population (Saharan climate) and the maximum in Nefza (Humid climate) of 13 %. The climatic conditions appear related to abortion of seeds. The variation in aborted seeds was studied in Brazil for six cultivars; Severino & Auld (2013) recorded a rate of aborted seeds which varies between 7.4 and 18.1 %. Thus, they have shown that seed weight and the probability of seed abortion were not associated with the position in the raceme.
The populations used in this study were grown in same field with seeds obtained from twelve geographic locations previously described (Martín-Gómez et al. 2016). Due to the low number of plants per population considered, it may be useful putting emphasis on the importance of the comparison by geographic regions. From this point of view, after a first generation of growth the seeds maintain some of the characteristics of their parentals; the comparison of four seed traits (area, J index, roundness and gray value) among geographic locations showed that some of the relationships observed in the parentals are retained in F1. Thus, in the former experiment, seeds grown in the desert were smaller and had higher values of roundness and gray intensity and lower values of J index (Martín-Gómez et al. 2016). After a first generation, seeds from the desert (P12; Kebili) were still smaller and had higher values of roundness and gray intensity. In contrast, J index values were superior to those obtained in seeds from other geographical locations. Mean J index values increased from 87 ± 2.2 in the parental generation to 89.3 ± 1.1 in the first generation. Lower values of J index were associated with reduced productivity in Jatropha curcas (Saadaoui et al. 2015a), and may have increased in the F1 due to better conditions of plant growth. It remains to be observed whether these values remain in future comparisons. Besides, the population of Kebili presented the lowest percentage of aborted seeds (0.3 %).
In Tunisia, Ricinus communis showed high genetic diversity and high seed yield. These characteristics are very interesting for the selection of efficient genotypes and favorite the castor bean cultivation. Other steps are crucial in the study of Tunisian R. communis, as molecular diversity and oil yield for each genotype.

