nueva página del texto (beta)
 Inglés (pdf)
 Artículo en XML
 Referencias del artículo
 Enviar artículo por email
 Citado por SciELO
  Similares en
SciELO
Similares en
SciELO 
 Permalink
Land use and cover change (LUCC) constitutes the greatest threat to tropical biodiversity and is a major cause of alterations in climate and biogeochemical cycles (Achard et al. 2002, Wright, 2005). Rates of loss of tropical forests are estimated to have increased from 5.6 million ha/year in the period 1990-2000 to 9.1 million ha/year in the period 2000-2005 (FAO 2012). As a consequence of this, old-growth forests are estimated to currently represent only 24 % of the total area covered by tropical forests whereas fragmented and degraded forests are estimated to cover 46 % and 30 %, respectively (Hansen et al. 2010).
Most studies of LUCC dynamics focus on analyzing their historic or recent patterns, an approach facilitated by an increased availability and resolution of satellite imagery. However, the analysis of LUCC dynamics requires also incorporating assessments of their potential future impacts (Chowdhury 2006). Simulation models focusing on qualitative and quantitative factors affecting LUCC dynamics open the possibility to generate contrasting future scenarios. These simulation models constitute a very valuable tool to inform policy makers about the possible magnitude forest degradation and deforestation can reach as the result of implementing (or failing to) different conservation or management strategies (Soares-Filho et al. 2010).
Mexico is a highly biodiverse country suffering the impact of LUCC as most of the tropics. The proportion of the country covered by tropical forests has reduced from 26.1 % in 1970 to a current 16.1 % (11.1 million ha of closed forests and 20.5 million ha of secondary forest; Challenger & Soberón 2008). This large-scale deforestation has been associated with a complex combination of factors such as oil extraction and government-promoted policies to support livestock and agricultural expansion (Geist & Lambin 2002).
The Mesoamerican Biological Corridor (MBC) is an initiative launched in 1997 to promote biodiversity conservation and sustainable development in Central America and southern Mexico, a region showing high levels of species richness and endemism but also extreme levels of poverty and inequality mainly impinging on indigenous populations (Toledo 2001). The portion of the MBC located in Mexico (MBC-M) started in 2001 as part of a multinational project funded by the Global Environment Fund (Miller et al. 2001). It covers 21.3 million ha (~10.8 % of Mexico’s area) and supports the largest remnant of tropical forests in the country as well as 75 % of the number of resident species of birds and ca. 60, 30 and 30 % of its mammals, amphibians and reptiles, respectively (CONABIO 2008a). Moreover, the MBC-M plays an important role in providing ecosystem services related to the maintenance of water quality and reduction of soil erosion (CONABIO 2008b).
Similar, methodological approaches, using simulation models to describe deforestation, have been applied in other tropical regions and some information about deforestation rates in the MBC-M exists (Díaz-Gallegos et al. 2010). However, our study area presents a particular combination of distinctive characteristic (occurrence of a major conservation initiative, high biodiversity, important presence of indigenous culture and overall accelerated population growth) which makes LUCC highly dynamic and limits the possibility to directly transfer results generated in other regions to our study area. Moreover, efforts to predict future impact of LUCC under different scenarios, in our study region are notoriously absent despite its ecological, economic and social importance.
In this study we analyze LUCC dynamics focusing on the portion of the MBC-M occurring in the state of Chiapas (MBC-Ch). The MBC-Ch stands out by its high biodiversity but also for supporting the highest human density among the different portions of the MBC-M. Therefore, it is more likely to be affected by LUCC. Our main goals are: 1) quantitatively describe recent LUCC dynamics in the MBC-Ch, 2) analyze the role that a set of spatial variables: elevation, slope, distance to rivers, distance to paved and unpaved roads, distance to rural localities and presence of natural protected areas play in the MBC-Ch LUCC dynamics, 3) correlate magnitude of forest loss with some variables reflecting human density and economic activity and, 4) generate potential scenarios of LUUC.
Materials and methods
Study area. The MBC-Ch covers 4.1 million ha, accounting for approximately 46 % of the total extent of the MBC in Mexico, and 4.1 % of the overall extent of the MBC. The MBC-Ch connects some of the most biological diverse areas in Mexico such as the biosphere reserves of Montes Azules, El Ocote, La Sepultura and El Triunfo (Figure 1). Together these protected areas encompass the largest extent of tropical forests in the country and support an estimated tree richness of ~1,400-1,500 species (approximately 80 % of the total tropical tree species richness of Mexico), as well as important remnants of globally threatened habitats such as the tropical mountain cloud forest (González-Espinosa et al. 2004). The natural richness occurring in the MBC-Ch represents a great asset from a biological point of view but also constitutes an important source of income for local and indigenous communities (Toledo 2001). Furthermore, within the MBC-Ch occurs the most important hydrological system of Mexico, constituted by the Grijalva and Usumacinta rivers, which provides 79 % of the total country’s runoff (CONABIO 2008b).
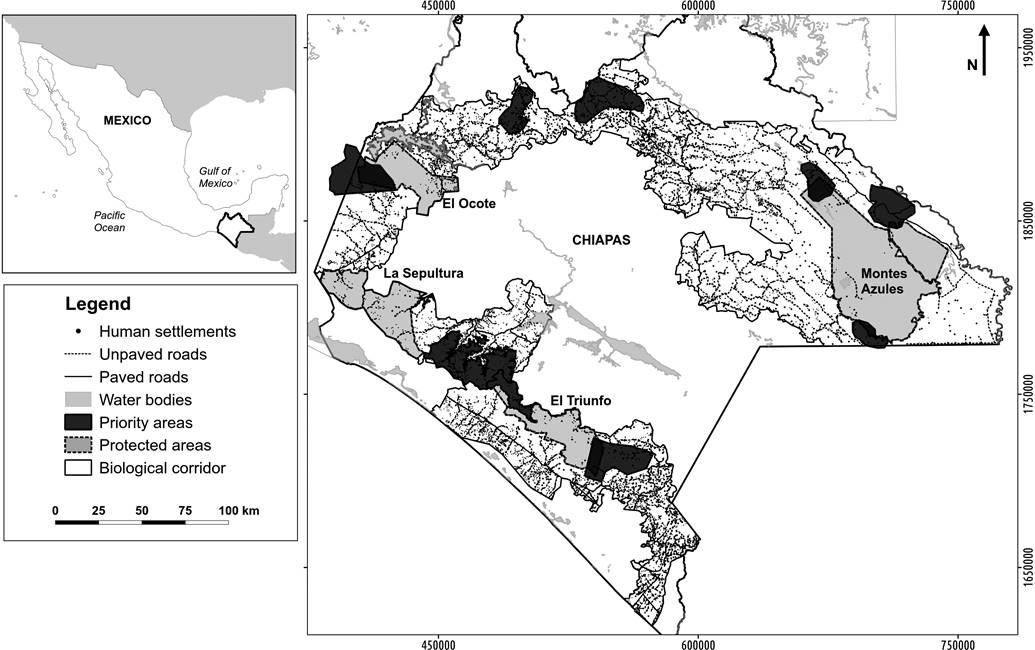
Figure 1 Location of the Mesoamerican Biological Corridor in Chiapas State, southeast Mexico.Biosphere Reserves: Montes Azules, El Ocote, La Sepultura, El Triunfo.
Approximately 1,720,270 people inhabit the MBC-Ch (density = 65 ind./km2) and its close vicinity (CONAPO 2010), including a great diversity of ethnic groups such as: lacandones, tzeltales, tojolabales, zoques and tzotziles (Toledo 2003). The region’s cultural and biological richness highly contrast with the predominating levels of social inequality, which place Chiapas among the states with the highest levels of poverty in the country (CONAPO 2010). Human impacts in the region started to become particularly evident during the second half of the twentieth century when extensive clearance of highly diverse rainforests, due to livestock, slash/burn based agriculture and timber extraction, was favored by governmental incentives (Díaz-Gallegos et al. 2010). However, it seems that conversion of natural habitats to productive areas in the region has not played a significant role in increasing local wealth (CeIBA 2010).
LUCC dynamics in the MBC-Ch. We compiled 1993, 2002 and 2007 land use and cover (LUC) maps at the 1:250,000 scale from the National Institute of Geography, Statistics and Informatics (INEGI). These maps were derived from visual interpretation of satellite images (Landsat and Spot) and validated in the field through ground-truthing conducted during years 1994, 2002 and 2007.The three maps use similar legends however, to make comparisons among them more straightforward we simplified their legends into the following six broader LUC categories: 1) closed temperate forests (TemF), 2) temperate secondary forests (TemSF), 3) closed tropical forests (TroF), 4) tropical secondary forests (TroSF), 5) agriculture, livestock and forestry (ALF), and 6) other land covers (OC). Tropical and temperate forests were distinguished based on its climatic affinity. Secondary forests included those with successional vegetation that have previously experienced human or natural disturbances and exhibited clear differences in forest structure and tree canopy cover when compared to closed forest.
We also compiled maps of paved and unpaved roads, human settlements, rivers and protected areas, all of them at scale 1: 250,000 (INEGI 1990, 2000, CONANP 2000). Finally, we derived a slope map from a digital elevation model (30 m resolution) that together with all of the vector maps were transformed to raster format and resampled, using ArcGIS 9.3 tools (ESRI), to get a common pixel size of 250 × 250 m, which corresponds to the minimum mapping unit (Mas et al. 2004, Velázquez et al. 2010).
We calculated annual rates of change for each land use and cover categories occurring in the MBC-Ch for 1993-2002 and 2002-2007 using the following equation (FAO 1996):
Where S1 is the extent of a given land use and cover category at time 1, S2 is the extent of the same land use and cover category at time 2, and n is the number of years between time 1 and 2.
Relationship between spatial variables and LUCC transition probabilities. To analyze land use and cover change in the MBC-Ch we used Dinamica EGO v.1.6, a software for the modeling of spatio-temporal dynamics of the landscape (Soares-Filho et al. 2002). Using Dinamica EGO we calculated transition probabilities among the different land use and cover categories between 1993 and 2002 applying the Markov´s chain method to describe transition probabilities from one state to another at discrete time steps. We built a transition matrix with the resulting probabilities, which was later transformed to an annual matrix to be used to make projections (Mas et al. 2014).
We examined the relationship between annual transition probabilities and the following spatial static variables: 1) terrain elevation, 2) terrain slope, 3) distance to rivers, 4) distance to paved roads, 5) distance to unpaved roads, 6) distance to rural localities, and 7) presence or absence of natural protected areas. Also, we assessed the relationship between transitions probabilities and several dynamic variables that were calculated and updated during each iteration of the model (i.e. each time step, corresponding to one year). These variables were the distances from a particular LUC category to the nearest cell of the following different categories: 1) closed tropical forests, 2) secondary tropical forests, 3) closed temperate forests, 4) secondary temperate forests, and 5) agriculture, livestock and forestry.
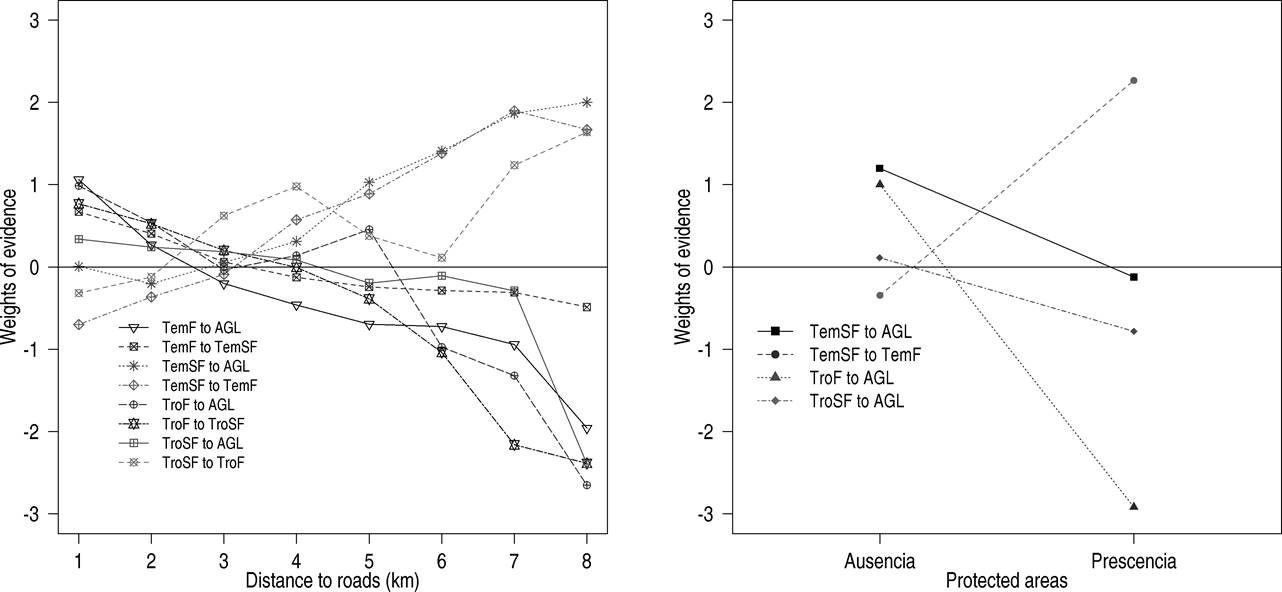
To assess the effect of each spatial variable (both static and dynamic) on the probability of a certain area to undergo a change in its land use or cover category (e.g. to become deforested) we applied the method of weight of evidence which relies on the calculation of Bayesian conditional probabilities (i.e. the probability that a specific transition of land use change occurs given the presence of certain trait) (Soares-Filho et al. 2006). When the presence of a certain trait favors transitions its weight is positive (W+), whereas when the presence of the trait inhibits the change its weight is negative (W-) (Bonham-Carter 2014). Then, we added up the weights associated to each of the different spatial variables to get an overall probability of change for each pixel in the map of the study area. Since the weight of evidence method is based on Bayesian conditional probability, the selection of variables to be added up and used in the modeling process should fulfill the assumption of conditional independence between pairs of variables. To test this assumption, we used the Cramer’s coefficient (V) to measure the correlation between pairs of maps of categorical variables (Bonham-Carter 2014). This was done by obtaining the values from a cross-tabulation between pairs of maps of the analyzed variables. The values of the Cramer’s coefficient vary between 0 and 1, where 0 indicates that the pairs of maps are completely independent, and values close to 1 indicate a strong correlation. We used a Cramer´s coefficient value of 0.45 as cutoff to distinguish between highly and moderately correlated variables (Almeida et al. 2005, Cuevas & Mas 2008, Pérez-Vega et al. 2012).
Using 1993-2002 annualized transition probability matrix and probability maps derived from the weight of evidence analysis we generated a new map with the expected distribution of land use and cover categories for year 2007. To this purpose, we used the cellular automata (CA) functor of Dinamica EGO which allow the representation of the landscape as a regular array of n-dimensional cells interacting with each other within a defined neighborhood (Soares-Filho et al. 2002, Almeida et al. 2005). The state of each pixel in this landscape depends on its previous LUC category and those of its neighbors and is updated in discrete time steps (White & Engelen 1994). To reproduce the spatial patterns of LUCC two CA functions are available in Dinamica EGO: ‘expander’ and ‘patcher’. In the first case, changes in the distribution and extent of LUC categories are caused by the expansion and contraction of already existing patches of a given category. In contrast, in the second function, patches of a given LUC category are created where they did not previously exist, using a seedling mechanism. In addition, to control the behavior of the CA functions, three parameters must be specified: 1) mean patch size, 2) mean patch variance, and 3) patch isometry. We estimated these parameters by measuring separately, for the ‘expander’ and ‘patcher’ functions, the mean patch size and variance of the changes occurred in the1993 to 2002 period. We used these values as input parameters to feed the CA functions for the simulation model.
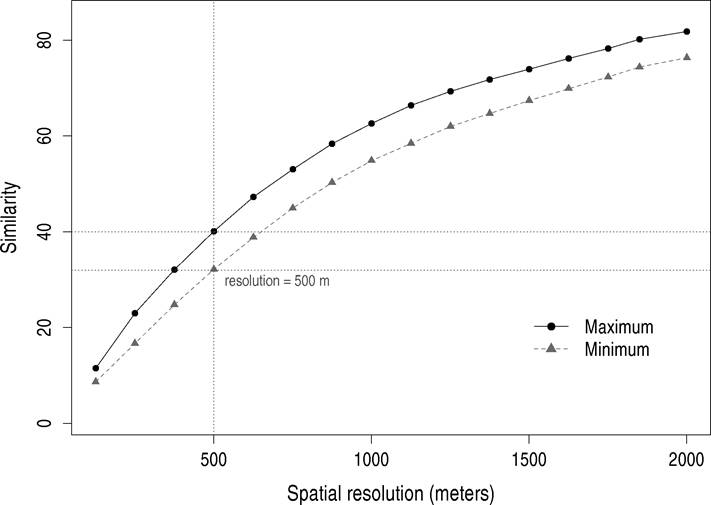
To evaluate the accuracy of the simulated map for year 2007 we compared it against the real 2007 LUC map from INEGI using the fuzzy-logic method implemented in Dinamica EGO (Soares-Filho et al. 2002). This approach allows incorporating a neighborhood context at the moment of comparing matches in the location of land use and cover categories between maps (see Hagen 2003). This method employs a distance decay exponential function based on the positional shift (spatial error tolerance) between the observed and simulated land use and cover patches. To measure the spatial agreement between the actual land use and cover map and the simulated map we used window sizes ranging from 1 to 31 pixels (corresponding to spatial resolutions between 500 and 15,500 m). To avoid overestimating the spatial fitness of the model, a two-way similarity analysis for both the constant and exponential decay functions was performed, allowing us to produce minimum and maximum similarity values (Soares-Filho et al. 2002).
Future scenarios of LUCC for the MBC-Ch.We projected three different scenarios of LUCC of the MBC-Ch for year 2030: 1) Agriculture and livestock (AGL) assumed that deforestation and degradation rates calculated for the period 1993-2002 continued (characterized by having the highest deforestation rates among the periods evaluated). Therefore, we used the annual transition probability matrix calculated for 1993-2002 as input for this model; 2) Business as usual (BAU) assumed that deforestation rates calculated for the period 2002-2007 remained constant. For this model we calculated the transition probability matrix and weights of evidence for the period 2002-2007; 3) Conservation (CON) scenario assumed that rates of deforestation and forest degradation decreased as a consequence of greater effectiveness of protected areas (PA’s) to mitigate LUCC and an overall positive impact of environmental friendly policies (e.g. payments for environmental services). To generate this scenario we increased the area under protection by assuming that all the zones in the region classified as a priority for their conservation and sustainable development by the Central American Commission for Environment and Development were formally implemented as federal protected areas (CBM & CCAD 2002).
Relationship between LUCC dynamics and demographic/economic variables. To further our assessment of LUCC dynamics, we assessed the correlation between forest loss (derived from 2002, 2005 and 2012 LUC maps at the 1:250,000 scale from INEGI) and the following socioeconomic variables, at the municipality level, for periods 2002-2007 and 2007-2012: 1) population density (population and housing statistics INEGI 2005, 2010), 2) money destined to subsidies for agricultural activities (government program PROCAMPO) (SIAP 2008, 2013), 3) planted area for agricultural purposes (SIAP 2008, 2013), and 4) value of agricultural production (SIAP 2008, 2013). For this purpose we calculated Spearman coefficients. It was not possible to analyze these relationships for the period 1993-2002 due to the fact respective socioeconomic data was only partially available and in some instances did not allowed straightforward comparisons with the data for later periods.
Results
LUCC dynamics in the MBC-Ch. There was a clear decline in the extent of the area covered by tropical and temperate forest between 1993 and 2007 (Figure 2a). In the period 1993-2002 deforestation rate of tropical forests was -2.57 %/yr resulting in a loss of 175 025 ha; whereas during the period 2002-2007 it reduced to -0.80 %/yr and produce a loss of 36 375 ha (Figure 2b). Temperate forest also experienced a high rate of deforestation (-4.29 %/yr) in the period 1993-2002 which caused the loss of 204 625 ha, whereas in the period 2002-2007 this rate was reduced to -2.23 %/yr, but still caused an additional loss of 61 600 ha (Supplementary Information, Table 1s). In contrast, during the same period the extent of the area covered by secondary forests increased from 19.6 to 21.4 % and from 9 to 15 % in tropical and temperate forest respectively. Agriculture, livestock and forestry activities increased their extent by 6.7 % between 1993 and 2007 (Supplementary Information, Table 1s). As a consequence of the observed changes, the largest remnants of closed tropical and temperate forests were confined to the biosphere reserves of Montes Azules, El Ocote, El Triunfo and La Sepultura.
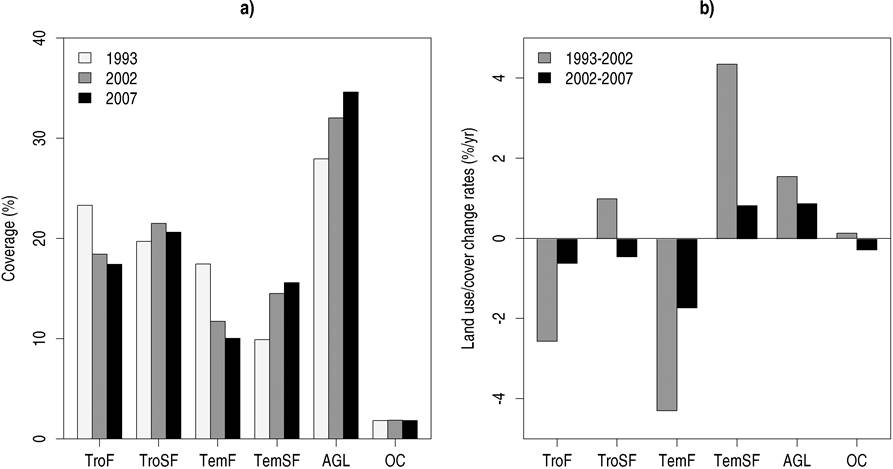
Figure 2 a) Extent of different land use and cover types in the Mesoamerican Biological Corridor-Chiapas in the different period evaluated, b) rates of change of the different land use and cover types in the Mesoamerican Biological Corridor-Chiapas for periods 1993-2002 and 2002-2007. TroF = Closed tropical forests, TroSF = Secondary tropical forests, TemF = Closed temperate forests, TemSF = Secondary temperate forests, ALF = Agriculture, livestock and forestry, OC = Other land cover.
We identified eleven major transitions among different categories of LUC for the calibration period 1993-2002 (Figure 3). Four of these transitions involved deforestation, two involved forest degradation (i.e. change from closed to secondary forest) and five regeneration of forest. Transitions involving change of both tropical and temperate closed forests to secondary forest had the highest transition probabilities followed by conversion of both forest types to land destined to agriculture, livestock and forestry. In contrast, transitions from agriculture, livestock and forestry to tropical and temperate secondary forests (i.e. regeneration) had the lowest probabilities. We detected regeneration from formerly agriculture, livestock and forestry areas to closed temperate forests but not to closed tropical forests, which only seemed to regenerate from secondary forests.
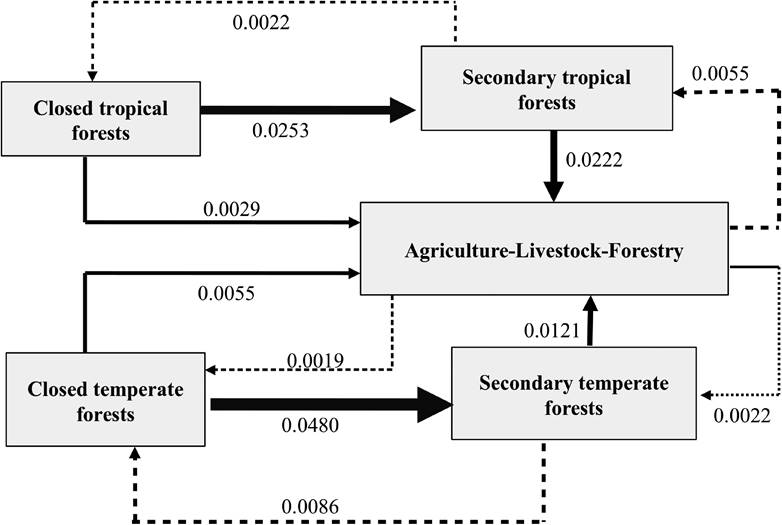
Figure 3 Observed transitions among different land use and cover types in the Mesoamerican Biological Corridor-Chiapas between 1993 and 2002. Solid lines indicate transitions towards deforestation and broken lines transitions toward regeneration. The thickness of the line indicates the transition probability: the thicker the line, the higher the transition probability. Values associated to each transition indicate their annual transition probability. Other land cover transitions were minimal and thus are not represented.
Tests on the conditional independence between pairs of variables showed low correlation coefficients (V < 0.40), with the exception of the relationship between the presence of PA’s and distance to unpaved roads (V = 0.53) and human settlements (V = 0.55). Despite this result, we decided not to exclude these variables from the modeling process due to the fact they have been widely used in other studies and therefore bear comparative value (Cuevas & Mas 2008).
Weight of evidence analysis showed presence of PA’s had a negative effect on the transitions towards degradation and deforestation of both tropical and temperate forests (Supplementary Information 1s). In contrast, the proximity to paved and unpaved roads had a positive weight on these same transitions but also on the transitions involving regeneration (i.e. the closer a road or a human settlement is, the higher the probability of regeneration to occur) (Supplementary Information, Figure1s). This might be explained by the fact that the potential areas for regeneration are the ones that have been previously deforested. Areas with low slopes between 0 and 3º had the highest probabilities to be deforested.
The parameters calculated to set the CA functions indicated that most of the observed changes were due to the expansion of already existing patches rather than the creation of new ones. This was particularly clear in the case of the five transitions involving regeneration in the 1993-2002 period in which changes mostly occurred in the vicinity of areas showing the same type of change.
When comparing the simulated map produced by our modeling effort with the 2007 land use and cover map from INEGI using a very fine spatial resolution (i.e. 1 × 1 km window size), we found a relatively low similarity (ca. 15 %)(Supplementary Information 2s). However, an increased window size (6 × 6 km) produced a notable increase in the similarity between the real and simulated maps (ca. 50 %).
Future scenarios of LUCC in the MBC-Ch.The AGL scenario exhibited the most drastic changes in the extent and configuration of LUC categories. This scenario showed reductions of 43 % and 41 % in the extent of closed tropical and temperate forests, respectively (Supplementary Information 3s). In comparison, the BAU scenario showed less drastic changes in the extent of closed tropical and temperate forests (19.5 and 30.1 %, respectively). The area covered by secondary forests increased by 4.3 % in the AGL scenario but decreased by 0.8 % in the BAU scenario. On the other hand, the extent of land destined to agriculture, livestock and forestry increased by 15 and 22 % in the BAU and AGL scenarios, respectively. The widespread change in the extent and distribution of LUC showed by the AGL scenario affected the border of PA’s such as Montes Azules and El Ocote mainly by the increase of the secondary forests area (Figure 4). Although changes in LUC observed in the CON scenario where minimal in comparison with those observed in the AGL and BAU scenarios, it was still possible to detect a decreased of 8.6 % in the extent of closed tropical forests and in increase of 6% in the area covered by agriculture, livestock and forestry activities.
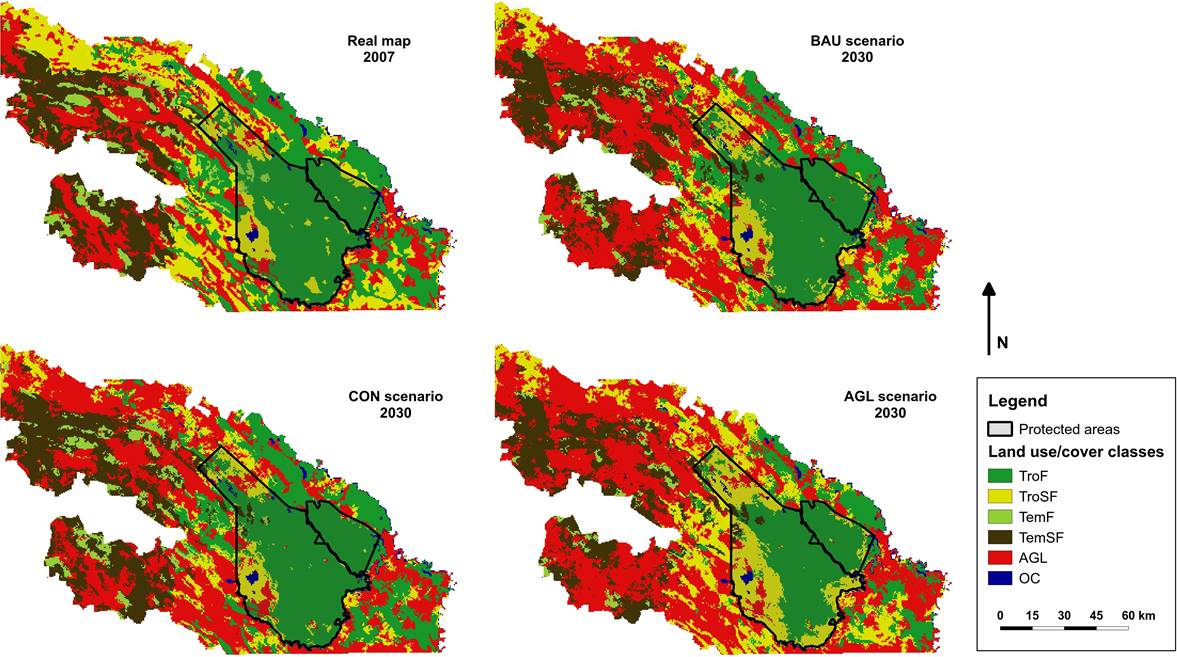
Figure 4 Land use and cover area observed in 2007 and projected to 2030 for three different scenarios. The example shown corresponds to the region of the Montes Azules Biosphere Reserve. TroF = Closed tropical forests, TroSF = Secondary tropical forests, TemF = Closed temperate forests, TemSF = Secondary temperate forests, ALF = Agriculture, livestock and forestry, OC = Other land cover.
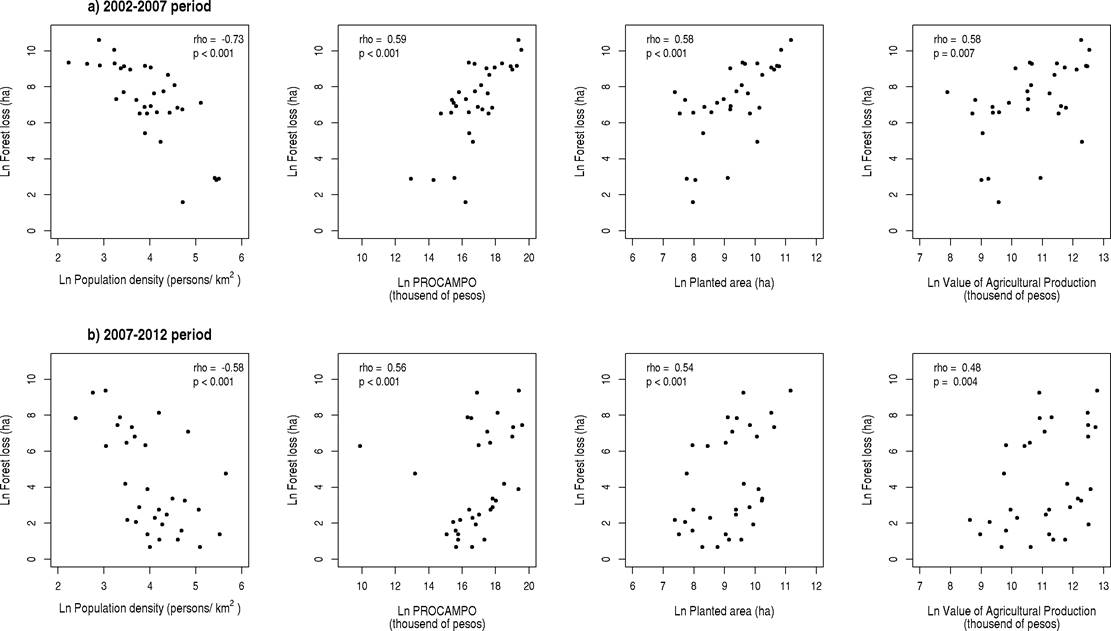
Relationship between LUCC dynamics and economic/demographic variables. The amount of money destined to subsidies for agricultural activities, the extent of planted area and the value of agricultural production had a positive and significant relationship with forest loss between 2002 and 2007 (Figure 5). In contrast, there was a negative and significant relationship between population density and forests perhaps due to the fact most populated areas were already deforested. For the 2007-2012 period correlation between the economic/demographic variables and forest loss were in all cases lower than the observed during the 2002-2007 period.
Discussion
LUCC dynamics in the MBC-Ch. Our study shows that LUCC in the MBC-Ch has been highly dynamic during the last years and it was characterized by an important loss of both tropical and temperate forests. By 2007 the extent of closed tropical and temperate forests in the MBC-Ch represented 67.3 % of the area they originally covered in 1993. However, during the second period of analysis (2002-2007) deforestation rates showed an almost 2-fold reduction for temperate forest, and higher than 3-fold reduction for tropical forest respectively. Most of the observed conversion of temperate forest during the overall study period (1993-2007) was due to degradation to secondary forest. A similar situation occurred in tropical forest areas. Tropical secondary forests might play an important role to mitigate the impacts of land conversion due to the fact it has been found they can sequester large amounts of carbon in their biomass (Bongers et al. 2015) and together with patches of remnant natural habitats are able to support significant levels of biological diversity (Edwards et al. 2012). Conservation status of these secondary forests should be evaluated; and also their potential use, to foster stabilization of primary forest cover (Chazdon 2014, Chazdon & Guariguata 2016).
Overall, LUCC dynamics resulted in an increase in the extent of lands dedicated to productive activities despite the observed reduction in deforestation rates in the period 2002-2007. Moreover, we found that dynamics of regeneration differed between temperate and tropical forests. Closed temperate forest seemed to regenerate not only from secondary forest but also directly from abandoned productive lands, whereas closed tropical forest primarily regenerated from secondary forest. This finding is in agreement with the existence of different management practices applied locally to tropical and temperate forests and with the existence of contrasting succession dynamics characterizing these two types of forest (Meli et al. 2017). Future research focused on distinguishing with further detail among different types of land uses will be of great help to set the basis for more specific management recommendations and assessments of LUCC impact.
Future scenarios of LUCC in the MBC-Ch.We found that under the BAU scenario important losses (19-30 %) in the extent of tropical and temperate forests are possible to occur by 2030. This clearly represents a sign of alarm due to the fact BAU scenario is based on LUCC trends observed in the most recent period analyzed. Moreover, it is possible to identify highly deforested areas such as the Montes Azules and El Ocote Biosphere reserves. As would be expected forest losses (41-43 %) in the AGL scenario were clearly higher than the observed in the BAU scenario. It is important to highlight that even tough forest loss expected under the AGL is very high, it is not unrealistic due to the fact transitions are based on real trends observed in the study region.
The CON scenario shows that an effort to improve efficiency of already decreed PA’s could have a significant impact to decrease forest loss. This result is particularly timely due to existing concern among the national conservation community that cuts in federal funding brought about by the global economic recession might directly affect economic resources destined to support PA’s staff and their operational budgets (Prieto-Torres et al. 2016).
Overall, modeled scenarios helped to illustrate the potential impacts that different approaches might have on the MBC-Ch region in terms of the relationship between the area covered by natural habitats and that destined to productive activities. In this sense it represents a very useful resource to help managers and stakeholders to visualize more clearly the possible consequences of favoring the implementation of specific strategies and to make more evident the contradictions involved in federal agencies financing activities such as extensive cattle rising (e.g. PROCAMPO) at the same time and in the same region they favor conservation with programs such as the payment for environmental services (Meli et al. 2015).
The impact of LUCC on the natural ecosystems included in the MBC-Ch has been significant and despite the apparent decrease in deforestation rates, the rate of habitat loss continue to be high enough as to produce a severe diminution in the area covered by closed forest. Habitat loss shown in the BAU affected the buffer and core zones of biosphere reserves located in the MBC-Ch thus representing an important threat to the maintenance of forest connectivity throughout the corridor. Yet, this scenario could be still seen as “conservative” due to the fact that it doesn’t incorporate the expansion and construction of new infrastructure or the potential synergies of climate change with environmental hazards such as forest fires (Silvestrini et al. 2011).
On the other hand, the CON scenario shows that an improvement in the effectiveness of protected areas can have a clear impact in helping to mitigate LUCC changes in the MBC-Ch region. However, it is important to consider that law enforcement needed to give functionality to PA’s can have negative social impacts if local stakeholders are not involved in the process (Agrawal & Redford 2009). Community forest management can complement protected areas to help to preserve biodiversity in the MBC-Ch region (Silva-Flores et al. 2016).
Our LUCC model allowed us to explore the dynamic of change in the MBC-Ch in a spatially explicit way yet, it can be improved by directly incorporating socioeconomic factors that might help to further our understanding of the factors driving forest loss in the MBC-Ch. One limitation we found was that not all the relevant information existed in a spatial format or was amenable to be compared in a straightforward way. As more of this information becomes available, more sound simulation models can be undertaken.
LUCC dynamics and social variables association. Forest loss was directly correlated to the amount of money destined to subsidies for agricultural activities, the extent of planted area and the value of agricultural production. It is important considering that in some particular regions of the MBC-Ch people consider government to be indirectly responsible for deforestation due to the fact, institutional initiatives such as PROCAMPO and PROGAN promote deforestation (Meli et al. 2015). This highlights the urgency to evaluate the unintended effects or outcomes of these and other similar governmental programs.
Conclusion
Our study shows that the MBC-Ch has already suffered an important impact in terms of the extent of its area covered by closed forest. Moreover, our modeling approach helped to show the contrasting paths that LUCC can have in the MBC-Ch depending on what balance between activities involving conversion of forest and conservation is achieved. The MBC-Mx will most likely continue to play a key role for promoting development strategies within the region. Making more optimistic scenarios a reality requires the urgent implementation of a series of comprehensive actions to help to reduce pressure on natural habitats. A key factor in these measures would be to use an integrative approach to link biodiversity conservation and actions that positively impact the social and economic wealth of local communities.