


 text new page (beta)
 English (pdf)
 Article in xml format
 Article references
 Send this article by e-mail
 Cited by SciELO
  Similars in
SciELO
Similars in
SciELO 
 Permalink
Tree phenology has been related to abiotic and biotic factors that trigger and regulate phenological patterns. In tropical dry forest, phenology has been associated with seasonal drought, amount of precipitation threshold, soil moisture, plant water status (Reich & Borchert 1984, Borchert 1994, Holbrook et al. 1995, Singh & Kushwaha 2005, Lopezaraiza-Mikel et al. 2014), and an increase in photoperiod (Rivera et al. 2002, Sloan et al. 2007), but also with biotic interactions with herbivores, pollinators and frugivores (Aide 1988, Sloan et al. 2007). Phenological studies in a number of tropical dry forests allow us to make a reliable generalization: overall, trees lose their leaves in the dry season, and in most species leaf flushing and flowering also occurs during the dry season, mostly just before the rains begin. Fruiting occurs mostly during the rainy season, but also from the end of the dry season to the beginning of the rainy season (e.g. Frankie et al. 1974, Borchert 1994, Murali & Sukumar 1994, Griz & Machado 2001, McLaren & McDonald 2005, Singh & Kushwaha 2005, Sloan et al. 2007, Valdez-Hernández et al. 2010, Lopezaraiza-Mikel et al. 2014, Dutta & Devi 2015).
Tropical dry forest are heterogeneous communities with a mosaic of habitats where tree species with different successional status are suited to conditions such as seasonally closed canopy or canopy gaps (Williams-Linera & Lorea 2009, Pezzini et al. 2014, Quesada et al. 2014, Hernández-Lezama 2016). Changes in vegetative and reproductive phenology as a function of successional status within a community have not received much study for dry forest. However, there is evidence that the timing and intensity of phenophases may differ between earlyand late-successional species (Quesada et al. 2009, 2014, Lopezaraiza-Mikel et al. 2014, Pezzini et al. 2014).
Seed dispersal is fundamental for maintenance of species distribution and diversity in a community. Tree seed dispersal mode and phenology have been studied for several dry forests and linked to seasonality. In anemochorous species, the peak in fruiting has been observed during the dry season when the loss of leaves increases wind circulation thereby facilitating seed dispersal (Griz & Machado 2001, Quesada et al. 2009, de Vasconcelos et al. 2010, Jara-Guerrero et al. 2011). Autochorous tree species show peaks of fruiting during both dry and rainy season (Murali & Sukumar 1994), or show no pattern of seasonality (Griz & Machado 2001, Carvalho & Sartori 2015). In contrast, in zoochorous species the fruiting peak, including development time and fruit ripening, was observed in the rainy season when animal dispersal agents are more active (Murali & Sukumar 1994, Griz & Machado 2001, Jara-Guerrero et al. 2011).
The objective of this study was to determine phenological patterns and their relationship to climate for sixteen tree species of a tropical dry forest, and groups of species classified according to successional status (late-, early-successional tree species) and seed dispersal mode (anemochory, autochory, zoochory). We predicted that vegetative phenology is related to climatic variables but peaks differed within ecological groups. We also predicted that flowering and fruiting of early successional, anemochorous, and autochorous species would occur in the dry season when the forest canopy is leafless whereas late successional and zoochorous species would do during the rainy season.
Materials and methods
In central Veracruz, Mexico, tropical dry forest has been practically destroyed by overexploitation and conversion to agricultural land. The remaining forest represents 7 % of the original dry-forest cover, although one third of this area is secondary vegetation, important remnants of native forest still persists in the region (López-Barrera et al., 2014). At the regional level, the dominant tree species are Bursera cinerea Engl., B. fagaroides (Kunth) Engl., B. simaruba (L.) Sarg., Calyptranthes schiedeana O. Berg, Heliocarpus donnellsmithii Rose, Stemmadenia obovata K. Schum. and Tabebuia chrysantha (Jacq.) G. Nicholson (Williams-Linera & Lorea 2009). The climate is warm sub-humid with summer rain (Awo in Köppen’s classification, Soto & García, 1989). Total annual precipitation is 957 mm and mean temperature is 25 °C. The rainy season extends between June and October and the dry season from November to May (Figure 1a). The study was conducted in one of the last undisturbed remnants (19° 16’ N, 96° 29’ W, elevation 97-117 m, surface 21 ha). In the studied fragment, observed richness was 17 tree species recorded in 0.1 sampled ha (site 1; Williams-Linera & Lorea 2009).

Figure 1 Monthly climate and phenophases from November 2007 to September 2010 in a tropical dry forest in central Veracruz, Mexico. A) 300 Monthly precipitation (bars), and maximum and minimum temperatures (lines). Phenophase intensity index for B) vegetative phenology, and C) reproductive phenology; values are monthly means of 16 tree species and error bars represent the standard error.
Phenological observations were carried out along a narrow trail (< 1 m width, ca. 2 km lenght) starting 30 m from the edge of the forest into its interior. We randomly chose one tree near the trail (we used random numbers to select a compass bearing and number of steps to the starting tree), and then we tagged the nearest neighbor of each consecutive tree toward the interior of the forest until we had compiled a list of the common tree species in the studied forest fragment. This procedure lead to tag uncommon species encountered along the trail including early successional species (Table 1). Different number of individuals of each species were recorded because we selected them as they were found along the trail. Tagged trees represented 50 % of reported species (site 1; Williams-Linera & Lorea 2009), and eight additional tree species. Voucher specimens were deposited in the XAL Herbarium of the Instituto de Ecologia.
Table 1 Tree species, family, and number of individuals observed (N) along a trail in a seasonally dry forest of central Veracruz, Mexico. Status is successional status. Dispersal is seed dispersal mode. *5 female and 5 male trees

Tree species were classified into ecological groups according to their successional status as late successional (mature forest species) and early successional (observed in forest light gaps and secondary forests) based on our field experience and literature (Castillo-Campos & Medina-Abreo 2002, Williams-Linera et al. 2011, Hernández-Lezama 2016). Also, tree species were grouped by their seed-dispersal mode based on the diaspore morphology, examined in the field or herbarium specimens, into zoochorous (seeds dispersed by animals), anemochorous (propagules with winds or hair dispersed by wind), or autochorous (mechanically self-dispersed) (van der Pijl 1972, Castillo-Campos & Medina-Abreo 2002, Table 1).
Phenological observations were made during the second week of each month from the ground with the aid of binoculars from October 2007 to September 2010, when Hurricane Karl stroke the site at the end of September 2010. To assess phenological events two types of data were obtained: number of trees in a phenophase and intensity of each phenophase. Intensity of each phenophase was observed in a scale of 0 to 100 %; we visually estimated in each tagged tree the percentage of the crown that was leafless or producing leaves, flowers or fruits using the following categories: 0 (0 %), 1 (1-25 %), 2 (25-50 %), 3 (51-75 %), and 4 (76-100 %) (Fournier 1974, Williams-Linera 1997). These values were averaged over individuals for each species by month and year and used as a phenological index of intensity for further analysis. During the same period that phenology was recorded, precipitation and temperature monthly data were directly obtained from the nearest meteorological station located at 8.1 km from the study site at Loma Fina, Station No. 30093 of the National Meteorological System of Mexico (19° 10’ N, 96° 18’ W, altitude 30 m).
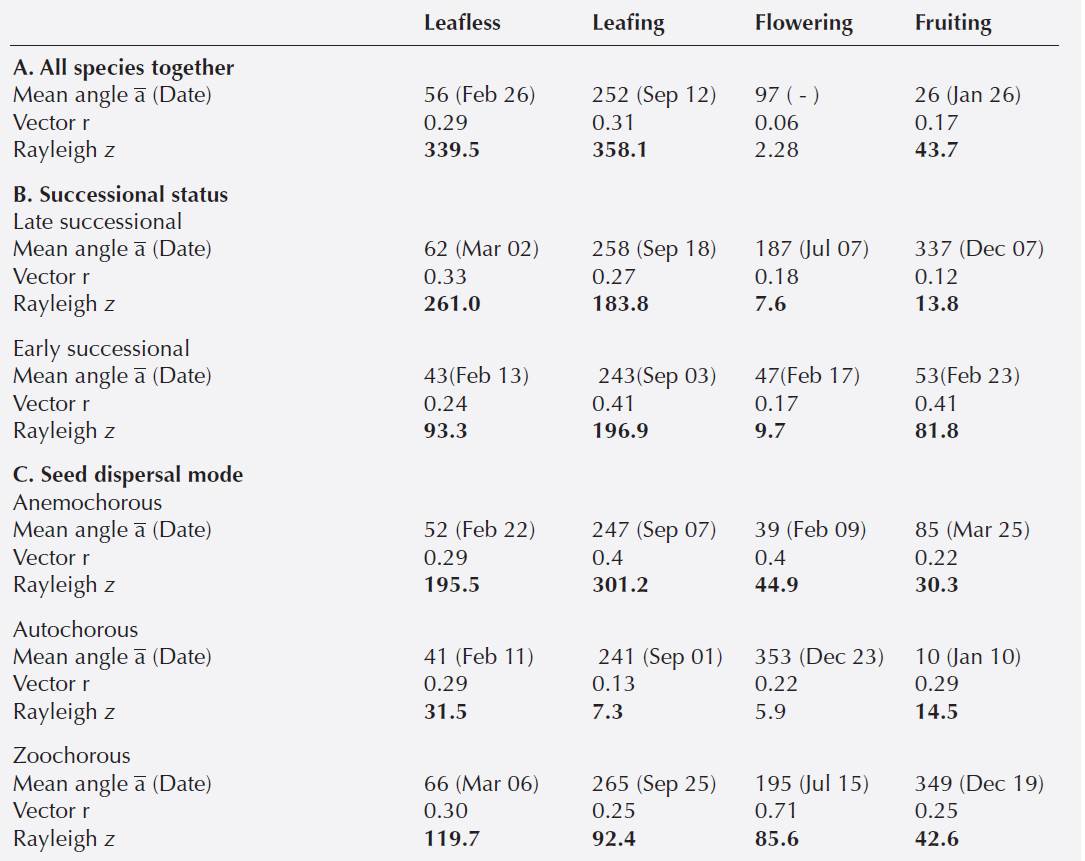
Statistical analysis. Months of the year in sequence represent circular scales of measurement and were analyzed using circular statistics (Morellato et al. 2010, Zar 2010). Months were converted to angles, from 15° = January to 345o = December, with 30o intervals. For each angle, we used the number of trees in each phenophase to test seasonality (significant mean direction) for all species together, species grouped by successional status and by seed dispersal mode, and species separately. We calculated the mean angle (ā), the mean vector (r) and significance of the angle using Rayleigh’s test (z) to detect deviations from a circular uniform distribution (Zar 2010). The mean angle μ and corresponding date do not necessarily point to the time of peak activity, but indicate the central tendency of the data. Vector length reflects the seasonality of the event and can vary from 0 for perfectly continuous to 1 for perfectly seasonal when all the data are concentrated at the same direction or angle (Morellato et al. 2010). Two-sample and three-sample Watson-Williams F-tests were used to test for differences in mean angle between species grouped by successional status and seed dispersal mode, respectively (Zar 2010). We used the package circular version 0.4-7 (Agostinelli & Lund 2013) in the R languaje version 3.1.1 (R Core Team 2014).
Monthly phenophase intensity (phenological index for leaf fall, leafing, flowering and fruiting) during 36 months and precipitation and temperature for the same and the preceding month (lag time reponse) were related using Spearman’s ρ correlation coefficients. Coefficients were calculated for all species together, and groups of successional status and seed-dispersal mode. Significance values were adjusted for multiple comparisons using the Bonferroni correction to control Type I error.
Results
All species together. Overall, the phenophases displayed a significant cyclic annual pattern, except flowering (Table 2). The central tendency of mean angles showed that the entire community is leafless in February and with leaves in September (Table 2, Figure 1b ). Flowering did not show a single peak for the whole community, and although fruiting appears extended over the year showed a significant angle in January (Table 2, Figure 1c).
Table 2 Results summarizing the main descriptive variables of the circular statistics for leaf fall, leafing, flowering and fruiting at A. All species together, B. Species grouped by successional status, and C. Species grouped by seed dispersal mode. Mean angle (ā) or central tendency and between parentheses the date corresponding to the mean angle when significant, r is the mean vector, z is the Rayleigh test for the null hypothesis of uniform distribution. Boldface type denotes that P < 0.001, italics type denotes that P < 0.01
Groups of species. Species grouped into successional status and seed dispersal mode exhibited the same vegetative phenological trends with leafless peaks in February-March (Figures 2a, 3a) and full leafing during September (Figures 2b, 3b; Table 2).
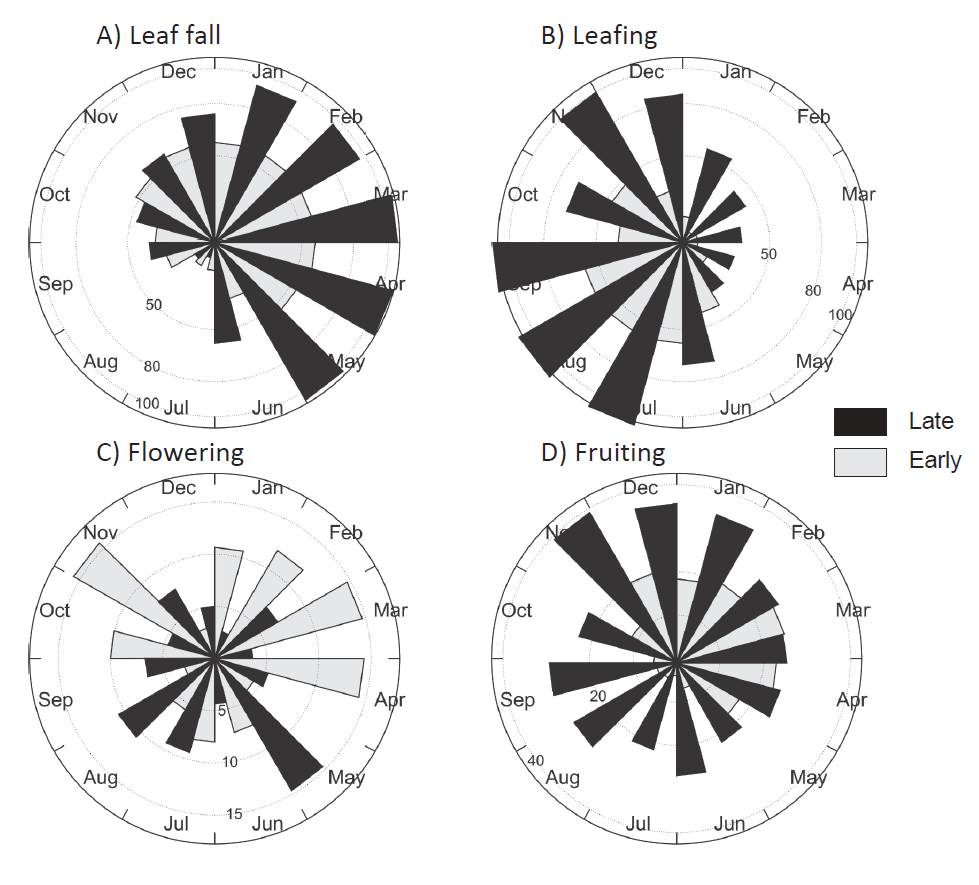
Figure 2 Circular histograms of number of trees recorded in a month during three years in a vegetative and reproductive phenophases in a tropical dry forest in Veracruz, Mexico. Trees were grouped according to their status into lateand early-successional species. Bars indicate the number of trees displaying a phenophase in a given month for A) leaf fall, B) leafing, C) flowering, and D) fruiting.

Figure 3 Circular histograms of number of trees recorded in a month during three years in a vegetative and reproductive phenophases in a tropical dry forest in Veracruz, Mexico. Trees were grouped according to their seed dispersal mode into anemochorous, autochorous and zoochorous. Bars indicate the number of trees displaying a phenophase in a given month: A) leaf fall, B) leafing, C) flowering, and D) fruiting.
Flowering and fruiting were seasonally different for late- and early-successional species (FWatson-Williams = 302.9, 162.5, P < 0.0001, respectively) as well as for species grouped into seed-dispersal mode (FWatson-Williams = 806.9, 142.7, P < 0.0001, respectively). In late-successional species a flowering peak occurred in July (rainy season) whereas early-successional species presented a peak in February (dry season) (Figure 2c; Table 2). Late-successional species dis played a fruiting peak in December whereas the early-successional species peaked in February (Figure 2d; Table 2).
Zoochorous species flowered in July and the other two groups displayed flowering peaks from December to February (dry season) (Figure 3c; Table 2). Fruiting was extended, however, zoochorous and autochorous species displayed peaks in December and January whereas the anemochorous species peaked in March (Figure 3d; Table 2).
Species level. Most species (12 out of 16) were leafless during January-February. Calyptranthes schiedeana and Trichilia trifolia retained their leaves longer than the other species and were not leafless until April. Species leafing started with the rains and the trees were fully covered with leaves in September, whereas species as C. schiedeana, Guazuma ulmifolia, Luehea candida and T. trifolia continued with leaves showing significant mean angles until October-November (Appendix 1).
Flowering had a significant mean angle for 12 species during the dry season and for four species during the rainy season. However, a gradual shift in species flowering peak was evident throughout the year. Ipomoea wolcottiana and Tabebuia chrysantha peaked at the dry season in January. Other species flowered during March (Cochlospermum vitifolium, Gliricidia sepium, Gyrocarpus jatrophifolius) and April-May (Ceiba aesculifolia, Senna atomaria, Bursera cinerea, B. simaruba); some species peaked during the rainy season (Guazuma ulmifolia, Maclura tinctoria, Luehea candida, Calyptranthes schiedeana, Trichilia trifolia), and others at the beginning of the dry season (Heliocarpus donnellsmithii, Leucaena lanceolata) (Appendix 1).
Fruiting occurred throughout the year, with some species producing fruits during the dry season (Guazuma ulmifolia, Heliocarpus donnellsmithii, Ipomea wolcottiana, Leucaena lanceolata, Tabebuia chrysantha, Trichilia trifolia), or late in the dry season just before the onset of the rains (Gliricida sepium, Cochlospermum vitifolium). Fruiting peaked in other species during the rainy season (Maclura tinctoria, Ceiba aesculifolia, Gyrocarpus jatrophifolius), and still others started fruiting at the end of the rainy season or at the beginning of the dry season (Calyptranthes schiedeana, Luehea candida) (Appendix 1).
Interaction with climate. Vegetative phenology showed a strong relation with climate. Leaf fall was negatively whereas leafing was positively correlated with precipitation and maximum temperature both for the same and the preceding month at all levels (community level, successional status, and seed dispersal modes) (Table 3). The only exception was for the zoochorous species and maximum temperature of the same month (Table 3).
Table 3 Spearman correlation coefficients of leaf fall, leafing, flowering and fruiting and climatic variables for the same month and the preceding month at A. All species together, B. Species grouped by successional status, C. Species grouped by seed dispersal mode. Data were monthly measurements from November 2007 to September 2010 in a tropical dry forest of central Veracruz, Mexico. Pp is monthly precipitation and Tmax is mean maximum temperature. Boldface type denotes that P < 0.001, italics type denotes that P < 0.01

Reproductive phenology was not consistently related with climate. Flowering at community level was not correlated neither to precipitation nor to temperature, but groups of species were, indicating that different groups may flower or fruit in different periods of a year. Flowering for late successional species was correlated for maximum temperature of the same month whereas for early-successional species flowering and fruiting were negatively correlated to the same month precipitation and the preceding month temperature (Table 3).
Flowering for zoochorous (positively) and autochorous (negatively) groups was correlated to precipitation, whereas for anemochorous were only negatively correlated to a month-lag temperature. Fruiting, at community level and for early species, was negatively correlated to precipitation and to maximum temperature. Fruiting of the anemochorous was negatively correlated to precipitation and the zoochorous to temperature (Table 3).
Discussion
In the tropical dry forest of central Veracruz, Mexico, trees dropped their leaves during the dry season, and remained leafless until May-June. Leaf flush increased at the end of the dry season coinciding with the onset of the rainy season, thus leaf fall was negatively correlated with precipitation and maximum temperature, whereas leafing was positively correlated with these variables. These vegetative phenological patterns have been widely documented for dry forests (de Vasconcelos et al. 2010, Frankie et al. 1974, Kushwaha & Singh 2005, Valdez-Hernández et al. 2010, Dutta & Devi 2015). For example, in tropical dry forests of Mexico, Costa Rica and Brazil, the highest proportion of individuals with no leaves was observed during the drier months followed by leaf production immediately after rainfall started with the rainy season (Lopezaraiza-Mikel et al. 2014). In Brazilian deciduous shrub land vegetation, increased leaf flush was observed at the community level at the end of the dry season with a peak in the first months of the rainy season (de Vasconcelos et al. 2010). However, the timing of rainfall as well as the duration of the period without any rain, and the rainfall accumulated in the first and last month of the wet season may play a more important role in phenology than total annual precipitation (Borchert 1994, Holbrook et al. 1995, Lopezaraiza-Mikel et al. 2014, Reich & Borchert 1984, Valdez-Hernández et al. 2010).
Vegetative phenology of ecological groups of species had similar central tendency of peak activity (mean angles) but there were some differences in the intensity. Early-successional species had a higher level of deciduousness than late successional species, and leafing occurred one month later. Then species such as Calyptranthes schiedeana and Trichilia trifolia (late-successional and zoochorous species) showed semi-deciduous or leaf-exchanging behavior (Singh &Kushwaha 2005, Valdez-Hernández et al. 2010), and for which leaf fall lasted less than 3 mo, though unlike all the other species, they were not observed completely leafless. Also, two species were not significantly cyclic in leafing (Leucaena lanceolata and Senna atomaria) because they presented bimodal or multimodal leaf production along the years.
Overall, flowering showed no seasonality, which is related to the fact that different groups of species displayed peaks at different times of the year (Quesada et al. 2014, Carvalho & Sartori 2015, Dutta & Devi 2015). Late-successional and zoochorous species produced peaks of flowers during the rainy season, whilst early successional, anemochorous and autochorous species displayed a flowering peak during the dry season. Contrary to our results, several studies report an extended flowering through the dry season, or peaks at the end of the dry season or beginning of rainy season (Frankie et al. 1974, de Vasconcelos et al. 2010, Lopezaraiza-Mikel et al. 2014, Quesada et al. 2014). During the dry season, leaf and flower production coincide with peak irradiance, and this may support an alternative hypothesis that leaf production and flower production have been selected to coincide with minimum herbivorous insect abundance and maximum irradiance (Aide 1988, Sloan et al. 2007, van Schaik et al. 1993). Accordingly, during the rainy season, flowering of zoochorous species may be related to the presence of pollinators (van Schaik et al. 1993, Lopezaraiza-Mikel et al. 2014).
Overall, fruiting occurred during the dry season and was negatively associated to precipitation. In general, late-successional and zoochorous species had a fruiting peak towards the start for the dry season, whilst early successional, anemochorous and autochorous species tended to produce fruit at the end of the dry season. However, fruiting occurred over an extended period and thus, at least three species showed a significant peak in the rainy season. The species fruiting at the rainy season, independently of the dispersal mode, were late successional species (zoochorous: Maclura tinctoria; anemochorous: Gyrocarpus jatrophifolius and Ceiba aesculifolia). In several tropical dry forest, it has been reported that most species fruit during the dry season (Frankie et al. 1974, Tadwalkar et al. 2012, Lopezaraiza-Mikel et al. 2014) but there are reports of fruiting peaks at the beginning of the rainy season (McLaren & McDonald 2005).
In our tropical dry forest, most of the trees monitored were anemochorous and autochorous, with the result that the observed community pattern was biased toward those groups. In several dry forests, it has been reported that anemochory is the most frequent dispersal mode with most seeds falling during the dry season (Griz & Machado 2001, Quesada et al. 2009, 2014), and autochory is displayed by Fabaceae trees which is one of the most abundant families in our forest (Williams-Linera & Lorea 2009). An association between seed dispersal syndrome and fruiting phenology has been reported for several dry forests. Similar to our results, in the tropical dry forest of southern Ecuador, and Brazil, the largest proportion of anemochorous species fruited during the dry season (Griz & Machado 2001, Jara-Guerrero et al. 2011). Contrary to our observations, zoochorous and autochorous species in those forests fruited during the wet season (Griz & Machado 2001, Jara-Guerrero et al. 2011). In Northern India, Murali & Sukumar (1994) found that anemochorous and autochorous showed extended fruiting and no seasonality, but zoochorous showed seasonal fruiting during the wet months.
We conclude that vegetative phenology is similar at all the levels studied, though there are species that behave differently, however, reproductive phenology differed between tree ecological groups. Our results support the hypothesis that in tropical dry forest vegetative phenology is more strongly related to climate than reproductive phenology is since leaf fall occurred during the dry season and leaf production coincided with the onset of the rainy season. For all species together and most groups of species flowering and fruiting peaked at different times during the dry season. In contrast, late successional and zoochorous tree species produced flowers in the rainy season. Studying the patterns of phenology in dry forest allows us to understand how they are related to climatic variables and gives us a glimpse into how some groups might be more susceptible to a changing environment.


