


 text new page (beta)
 English (pdf)
 Article in xml format
 Article references
 Send this article by e-mail
 Cited by SciELO
  Similars in
SciELO
Similars in
SciELO 
 Permalink
Knowledge of the genetic diversity as well as the natural range of wild relatives of domesticated species is crucial for germplasm conservation (Rao & Hodgkin 2002), as this will allow adequate procedures for sampling design and development of effective management strategies for conservation of endangered populations (Hamrick 1983, Hedrick 2001). Also, knowing the genetic structure of wild relatives of domesticated species is essential to generate basic information about the sites of domestication of crops, because, in combination with archeological and historical evidence, it can provide insight into the geographic and temporal details of domestication to reveal where, when, and how many times a crop was domesticated (Luo et al. 2007, Kwak & Gepts 2009, Meyer et al. 2012).
Lima bean (Phaseolus lunatus L.) is one of five species of the genus Phaseolus that was domesticated at least 6,000 years ago (Kaplan & Lynch 1999). Phaseolus lunatus consists of two botanical varieties: P. lunatus var. silvester Baudet, which comprises only wild populations; and P. lunatus var. lunatus, which includes only cultivated populations (Baudet 1977). Recent molecular evidence indicates that the primary gene pool of Lima bean is composed of three main genetic groups: the Andean group (AI); the Mesoamerican MI group and the Mesoamerican MII group (Serrano-Serrano et al. 2010, 2012, Andueza-Noh et al. 2013, 2015). Within each of these groups there are both wild and cultivated populations, and there is evidence of independent domestication events in each of these groups (Debouck et al. 1987, Gutiérrez-Salgado et al. 1995, Fofana et al. 1997, Maquet et al. 1997, Caicedo et al. 1999, Andueza-Noh et al. 2013).
For Phaseolus lunatus var. silvester from Mexico, the MI group is distributed in the western part of the country, while the MII group is found in the Gulf and southeastern coast of Mexico, across Central America and South America, reaching Argentina (Serrano-Serrano et al. 2012, Andueza-Noh et al. 2013). Martínez-Castillo et al. (2014) indicated the existence of two groups within MI (MIA and MIB), as well as evidence that the Isthmus of Tehuantepec in southern Mexico could be the area where MI and MII diverged. Though the west central Mexico and the region between Guatemala and Costa Rica are potential areas of domestication for MI and MII, respectively, the exact areas of domestication are still unknown for both groups (Serrano-Serrano et al. 2012, Andueza-Noh et al. 2013).
Microsatellites (SSR, Simple Sequence Repeats) are codominant molecular markers, often highly polymorphic and discriminating, which are distributed along the genomes (Tautz & Renz 1984). These markers have proved a useful tool for determining the genetic structure in many plant species (Mattioni et al. 2013, Lavor et al. 2014, Noormohammadi et al. 2014, Shivaprakash et al. 2014). In wild Phaseolus lunatus, SSRs have been used to determine the genetic structure in populations of Costa Rica and Mexico, showing high genetic differentiation between wild populations of P. lunatus and clustering patterns based on geographical isolation and low levels of gene flow (Ouédraogo et al. 2005, Martínez-Castillo et al. 2006, 2014).
Despite the great efforts made to collect wild populations of Phaseolus lunatus from Mexico (Martínez-Castillo et al. 2014), further collection from its wide geographical distribution is needed to accurately examine the genetic structure of this species. Knowing the genetic diversity of wild populations of P. lunatus in Mexico is relevant because this country has been identified as an important center of genetic diversity for this species (Martínez-Castillo et al. 2004, 2008, 2014), as well as one of its centers of domestication (Serrano-Serrano et al. 2012, Andueza-Noh et al. 2013, 2015). The main goal of this work is to contribute to the knowledge of the genetic organization of wild populations of P. lunatus in Mexico, using a molecular study of newly collected populations in the state of Chiapas. Although Chiapas is located in the region where possibly genetic differentiation occurred between MI and MII groups (Martínez-Castillo et al. 2014), previous studies had included only two wild accessions. So it was necessary to increase the number of samples from this region of Mexico to increase the understanding of the genetic differences between these two groups.
Materials and Methods
Plant material. Analysis included nine wild accessions of Phaseolus lunatus from the State of Chiapas, Mexico (Figure 1, Table 1); seven were new accessions collected in situ by Jaime Martínez-Castillo, and two accessions were obtained from the CIAT (International Center for Tropical Agriculture) seedbank. One CIAT accession does not have information about the exact collection site.

Figure 1 Geographic distribution of 16 wild accesiones of Phaseolus lunatus used in the present study. Red squares, accessions of Chiapas; Green circles, accessions of MII; Blue circles, accessions of MIA; Blue triangles, accessions of MIB. Numbers and capital letters of each accession correspond to Table 1.
Table 1 Geographic data of nine wild accessions of Phaseolus lunatus from Chiapas, Mexico, and seven accessions analized by Martínez-Castillo et al. (2014) used as a outgroup.
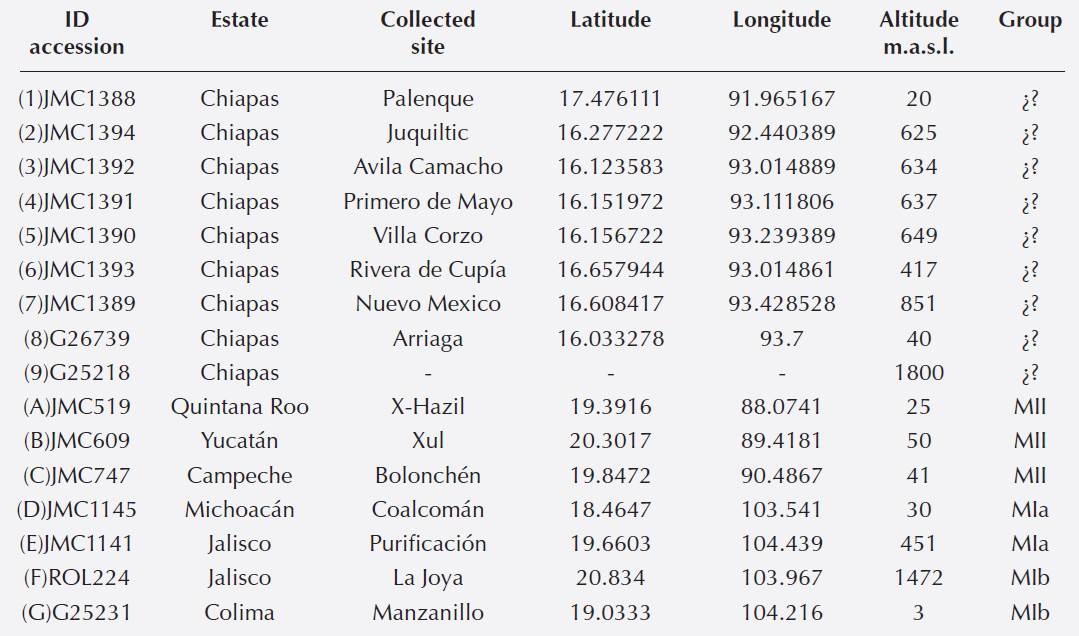
To know to which genetic group (MIA, MIB or MII) belong the Chiapas accessions, we included as outgroups three wild accessions of MII group, two wild accessions of MIA group and two wild accessions of MIB. Molecular data of CIAT accessions collected in Chiapas and those of the accessions of the outgroups were obtained from Martínez-Castillo et al. (2014). Taking advantage of the existence of the original gels reported in Martínez -Castillo et al. (2014), these analyzed them again, and banding patterns observed in these gels were compared with those found in the new gels, thus standardizing the criteria for reading.
DNA extraction. DNA was extracted from 10 seeds per accession, except for the JMC1391 accession, for which only 5 seeds were considered, due to germination problems (Table 1). Germination was conducted in trays under greenhouse conditions and the DNA was extracted from young leaves according to the protocol of CTAB (Doyle & Doyle 1987). The quality of extracted DNA was verified by gel electrophoresis 1 % agarose stained with ethidium bromide, and the DNA quantification was performed in a NanoDrop 1000 spectrophotometer (Thermo Scientific).
Microsatellite methods. Eight SSR loci reported as polymorphic to Phaseolus lunatus (Table 2) by Martínez-Castillo et al. (2014) were used for the molecular characterization. DNA amplification was done in 20 μl volume Polymerase Chain Reaction (PCR), consisting of 10X PCR buffer, 50 mM of MgCl2, 10 mM of dNTP mix, 10 mM of primers, 5u/μl of Taq polymerase and 50 ng of DNA. The PCR program consisted of 35 cycles, each consisting of a denaturation step of 15 seconds at 94 °C, a step of alignment of 15 seconds at a temperature of alignment depending on the primers employed, an extension step of 15 seconds at 72 °C and a final extension of 5 minutes at 72 °C. The PCR amplification was done in a thermocycler GeneAmp PCR System 9700 (Applied Biosystems, Foster City, USA). A volume of 5 μL of formamide containing 0.45 % bromophenol blue and 0.25 % xylene cyanol was added to the PCR product and was denatured for a period of 5 min at 94 °C, then 5 μL of this reaction product was loaded on 5 % polyacrylamide gels (19:1 acrylamide-bisacrylamide) containing 5 M urea and 0.5X Tris-borate EDTA (TBE) buffer.
Table 2 Characteristics of the eight microsatellite loci used in the molecular characterization of seven wild populations of Phaseolus lunatus from Chiapas, Mexico.

Note: Tm, annealing temperature in degrees Celsius; BP, fragment size found in base pairs.
Electrophoresis was performed at 60 W constant power for 45 min to 1 h (SQ3 sequencer, Hoeffer Scientific Instruments, San Francisco, CA). The amplification products were visualized with the silver staining technique (Bassam et al. 1991). The size of the fragment was determined visually in base pairs (bp), using as reference a 10 bp molecular marker.
Population genetics analyses. Genetic relationships between the wild populations from Chiapas and MI and MII groups.Genetic relationships were inferred using three procedures: 1) Assignment tests of individuals were made with STRUCTURE version 2.3.4 (Pritchard et al. 2000). We used the admixture model with correlated allele frequencies, 100,000 as a period of burn-in and 200,000 iterations after burn-in to allow the Markov chain to reach stationarity. To determine the optimal number of existing populations (K optimal), a total of ten independent simulations were run for each value of K, ranging from K = 1 to K = 16 (nine accessions from Chiapas plus seven accessions of the outgroups). With the output files generated by STRUCTURE, the optimal value of K was obtained using the method of Evanno (Evanno et al. 2005) and the STRUCTURE HARVESTER program (Earl and vonHoldt 2012). The graph generated by STRUCTURE was edited with PowerPoint 2013 (Microsoft, Redmond, Washington, USA). 2) A dendrogram was generated using the Neighbor Joining (N-J) method, the genetic distance of Goldstein (Goldstein et al. 1995) and 1000 bootstraps, as implemented in the Populations program version 1.2.31 (Langella 1999). Dendrogram was visualized and edited using MEGA 5 (Tamura et al. 2011). 3) We also applied a Principal Coordinates Analysis (PCoA), which allows exploring clustering patterns of the samples without an a priori data, using each allele as an independent variable. This analysis was made using GenAlex 6 program (Peakall & Smouse 2012). Genetic structure and inbreeding.Genetic structure was analyzed calculating FST between pairs of populations and a Mantel test (Mantel 1967, Sokal 1979) to determinate if there is a significant linear relationship between genetic distance and geographic distance among populations. These analyses were made with Arlequin ver. 3.5 (Excoffier et al. 2005). We estimated the inbreeding coefficients (FIS) for each accession and if these values were different from zero (α= 0.05) using FSTAT program ver. 2.9.3.2 (Goudet 1995). Also, we did assignment tests of individuals and selection of optimal K using the same programs and specifications mentioned in the section of genetic relationships. For these analyses, we included only the populations of Chiapas, so STRUCTURE was only run from K =1 to K = 9. The assignment tests were also used to evaluate recent gene flow (ancestry) among populations of Chiapas.
Genetic diversity.Genetic diversity was estimated considering two levels: all Chiapas and each accession. The estimates were percentage of polymorphic loci (%P), observed heterozigosity (HO) and expected heterozigosity (HE). These values were calculated with a level of polymorphim of 95 %, with Arlequin version 3.5 (Excoffier et al. 2005). Considering the existence of accessions with different sample sizes, we calculated the average number of alleles per locus (A) and the average number of unique alleles per locus (AU) using a rarefaction method implemented in the HP-Rare program ver. 1 (Kalinowsky 2005). Also, in order to evaluate the existence of a reduction in genetic diversity as a result of genetic bottlenecks, the Garza-Williamson (G-W) index (Garza & Williamson 2001) was calculated with Arlequin version 3.5 (Excoffier et al. 2005). Low values of this index suggest a higher probability of a recent genetic bottleneck in the population.
Results
Genetic relationships of populations from Chiapas with MI and MII groups. Evanno method indicated an optimum value of K = 3 for the 16 accessions analyzed. The assigment test of individuals based on K = 3 (Figure 2) grouped separately the three accessions of MII; the seven accessions of Chiapas that were collected in situ; and the accessions of MI together with the two accessions of Chiapas obtained from CIAT (G26739 y G25218).
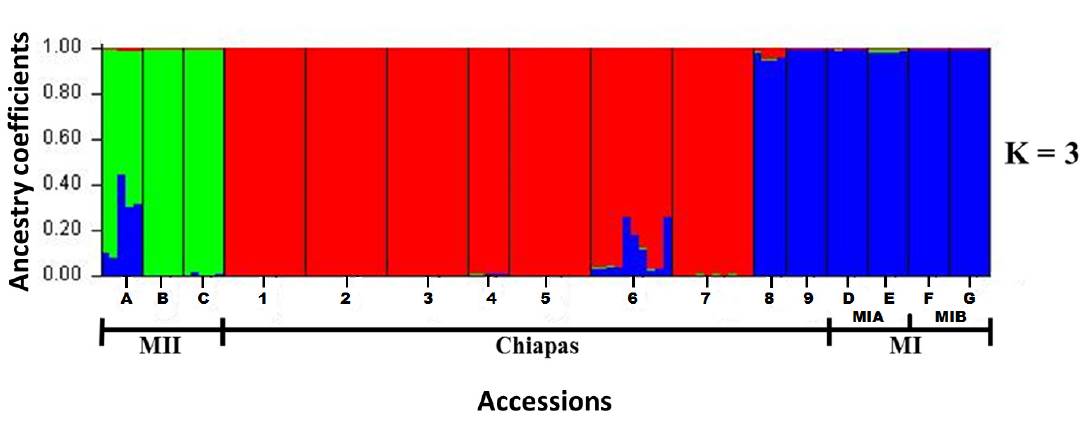
Figure 2 Assigment test of individuals of nine wild accessions of Phaselous lunatus from Chiapas and seven wild accessions used as outgroups, usinf optimal K value and the STRUCTURE program. Numbers and capital letters of accessions correspond to Figure 1 and Table 1.
The Neighbor Joining dendrogram showed two main groups (Figure 3): one group comprising six accessions of Chiapas and the three accessions of MII group (these ones formed a separate subgroup); the other group was integrated for the accessions of MI group (MIA y MIB) plus the two accessions of Chiapas obtained from CIAT; accession JMC1390 collected in Villa Corzo, Chiapas, did not show a clear assignment to either of the two main groups. All bootstrap values were below 50 %.

Figure 3 Neighbor Joining based on the genetic distance of Goldstein (1995) of nine wild accessions of Phaselous lunatus from Chiapas and seven accessions used as outgroups, using eight SSR loci. Colors of the branches, numbers and capital letters into parentheses correspond to those observed in Figures 1 and 2, and Table 1.
The PCoA showed a general pattern of grouping based on the existence of Chiapas accessions, MI and MII groups, with a greater dispersion within MII (Figure 4). For this analysis, axes 1 and 2 comprised 33 % and 27 % of the total variation, respectively.
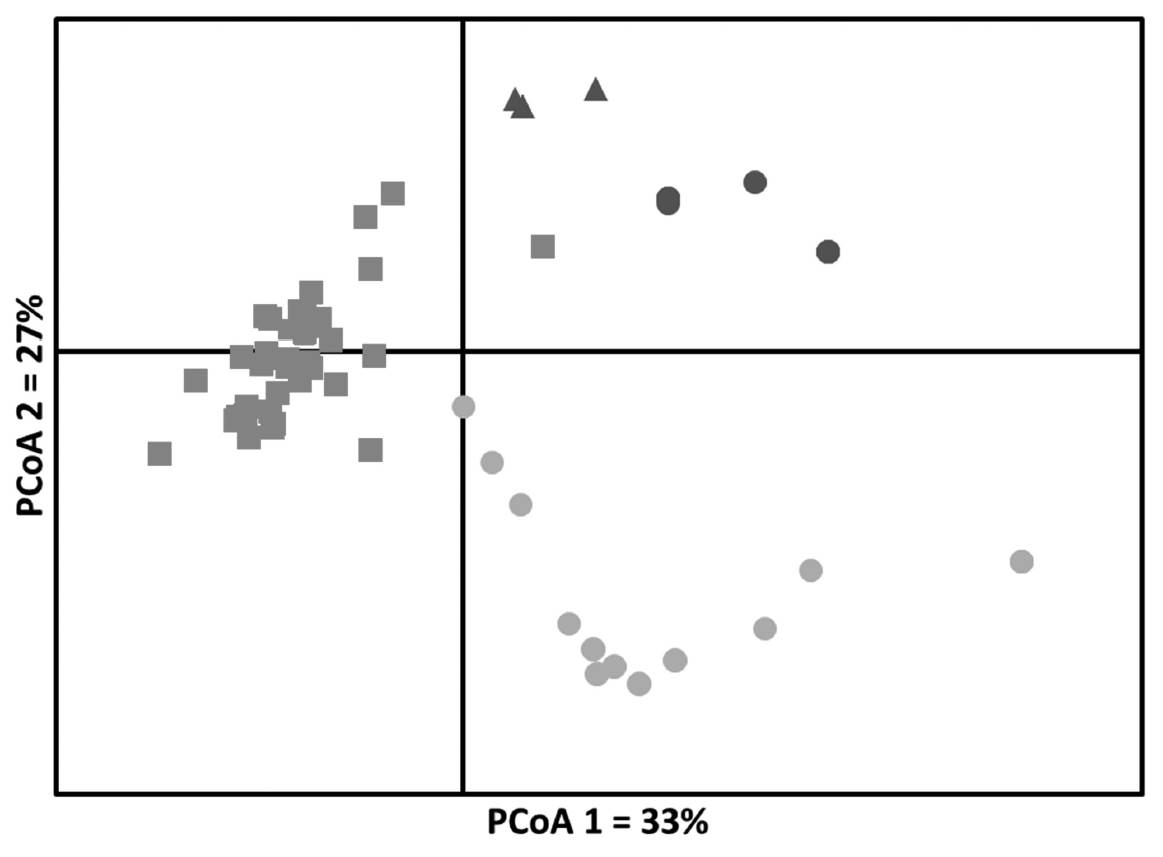
Figure 4 Principal Coordinates Analysis (PCoA) of nine wild accessions of Phaseolus lunatus from Chiapas and seven wild accessions from outgroups, using eight microsatellite loci. Red squares, accessions of Chiapas; Green circles, accessions of MII; Blue triangles, accessions of MIa; Blue circles, accessions of MIb. Symbols correspond to those showed in Figure 1. Color of the symbols correspond to those showed in Figures 1, 2 and 3.
Genetic structure and inbreeding in wild Phaseolus lunatus from Chiapas. We found a high genetic differentiation between populations as paired FST values among samples ranged from 0.42 to 0.96 (Table 3). A Mantel test does not indicate the existence of a strong geographic isolation among accessions (r = 0.343, P = 0.08). Five of the nine accessions analyzed had positive values of FIS and significantly different from zero (P ≤ 0.05) (Table 4), suggesting inbreeding in P. lunatus wild populations from Chiapas.
Table 3 Paired FST values of nine wild accessions of Phaseolus lunatus from Chiapas, Mexico, using 8 SSR loci.
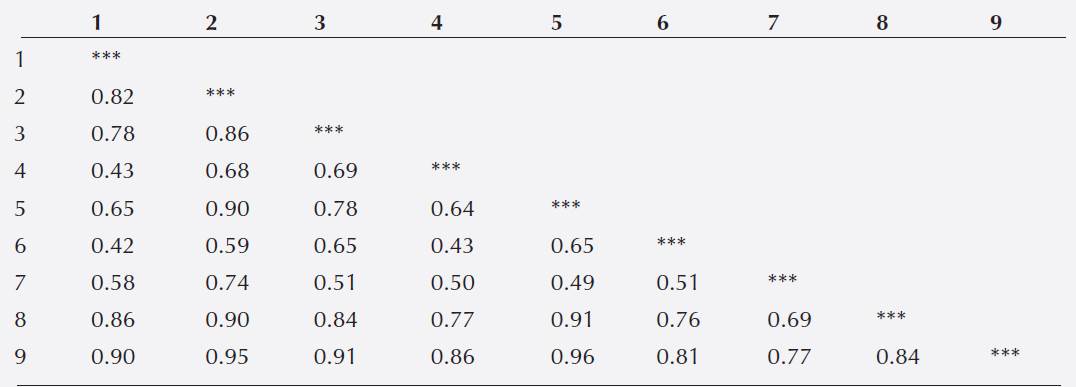
Note: 1, JMC1388; 2, JMC1394; 3, JMC1392; 4, JMC1391; 5, JMC1390; 6, JMC1393; 7, JMC1389; 8, G26739; 9, G25218. The order of accessions corresponds to Table 1 (accessions from Chiapas only).
Table 4 Estimates of genetic diversity and inbreeding coefficients of nine wild accessions of Phaseolus lunatus from Chiapas, Mexico, using 8 SSR loci.
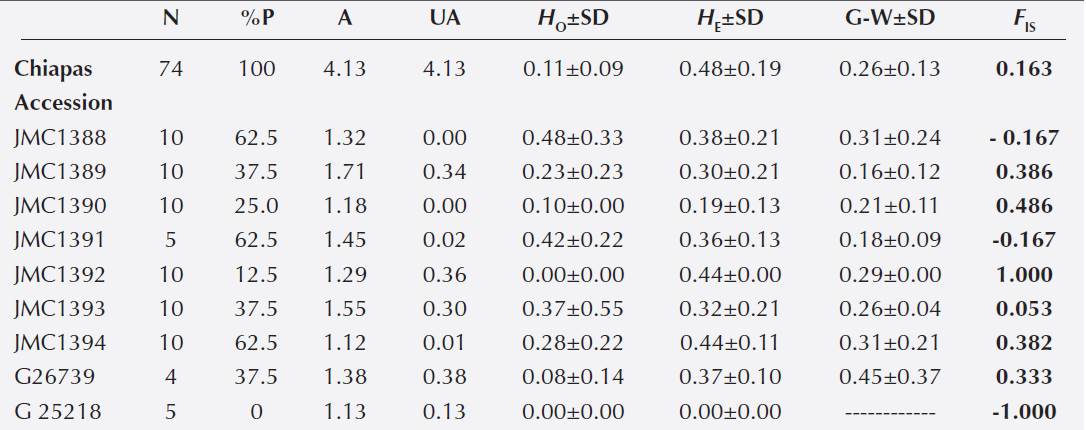
Note: %P, percentage of polymorphic loci at 95 %; A, allele richness; UA, unique alleles; HO, observed het erozigosity; HE, expected heterozigosity; G-W, Garza-Williamson index (lower values of this index suggest a higher probability of a recent genetic bottleneck in the accession); FIS, inbreeding coefficient [significant values are shown in Bold (P ≤ 0.05); for G25218 accession, just one locus showed a FIS value of -1.0 and the other seven loci did not did not return any value]; SD, Standard Deviation.
Evanno method indicated an optimum value of K = 4 for the nine accessions of Chiapas. Figure 5 shows the graph generated with STRUCTURE using K = 4. Based on the percentage of ancestry for each accession, four genetically distinct populations are integrated as follows: red population (accessions JMC1388, JMC1390 and JMC1391); green population (accession JMC 1394); yellow population (accessions JMC1392 and JMC1389) and blue population (accessions G26739 and G25218). The JMC1393 accession was not assigned to a specific population as this presented ancestry from 3 different populations in very similar percentages, as shown by the three colors present in this accession. Figure 5 also suggests that the genetically “purest” accessions were JMC1394, JMC 1392, G26739 and G25218. The other accessions showed some level of ancestry from other accessions, as shown in JMC1391 having a relatively high percentage of ancestry from the JMC1392 and JMC1389, and JMC1389 having a percentage of ancestry relatively high from the JMC1388 and JMC1390 accessions.

Figure 5 Assigment test of individuals of nine wild accessions of Phaselous lunatus from Chiapas, usinf optimal K value and the STRUCTURE program. The order of accessions corresponding to Tables 1 and 4. Number of accessions correspond to Figures 1, 2 and 3.
Genetic diversity in wild populations from Chiapas. We found a total of 28 alleles in the nine studied accessions, with an average number of alleles of 3.1 per locus. Loci BM143 and BM211 showed the highest number of alleles (seven and six, respectively). The following estimators of genetic diversity were found to Chiapas: percentage of polymorphic loci = 100, mean number of alleles per locus and mean number of unique alleles per locus = 4.13, observed heterozygosity = 0.11, and expected heterozygosity = 0.48 (Table 4). Accessions showing the highest values of percentage of polymorphic loci were JMC1388, JMC1391, JMC1394, all with 62.5. The accession with the highest value of mean number of alleles per locus was JMC1389 with 1.71. The accession with the highest value of mean number of unique alleles per locus (0.38) was G26739. The accession that had the highest value of observed heterozygosity (0.48) was JMC1388. Accessions with the highest values of expected heterozygosity (0.44) were JMC1392 and JMC1394 (Table 4). Accession G25218 showed the lowest values for all estimators evaluated, except for the mean number of unique alleles per locus. The two accessions that showed the lowest values of Garza-Williamson index were JMC1389 and JMC1391, with 0.16 and 0.18, respectively, suggesting a high probability of a recent genetic bottleneck for these accessions (Table 4).
Discussion
For many years it was accepted that the genetic diversity of Lima bean was organized into two major groups: the Andean and Mesoamerican (Debouck et al. 1987, Gutiérrez-Salgado et al. 1995, Fofana et al. 1997, Maquet et al. 1997, Caicedo et al. 1999). However, these findings were supported by a very limited sampling, particularly of wild populations. In the last five years our group has collected more than 100 wild populations of Phaseolus lunatus in several regions of Mexico. This new material was integrated in recent molecular studies (Serrano-Serrano et al. 2012, Andueza-Noh et al. 2013, 2015, Martínez-Castillo et al. 2014), which demonstrated the existence of two sub-groups, MI and MII, within the Mesoamerican group, and that their divergence could have occurred in the region around the Isthmus of Tehuantepec, Mexico. However, the state of Chiapas, which is located in this region, was subrepresented in the aforementioned studies. This current work analyzed for the first time, individuals from seven wild populations of P. lunatus of Chiapas.
Genetic relationships between wild populations from Chiapas with the MI and MII groups. We found an optimal K = 3, implying the existence of only three genetically distinct populations among the 16 accessions analyzed. When STRUCTURE was run with K = 3, it was possible to see the existence of three groups: 1) the MII group, 2) a second group composed by seven accessions of Chiapas in situ collected and, 3) a third group consisting of MI and two accessions CIAT (Figure 2). This grouping was similar to that generated by the PCoA (4), which showed also the existence of the same groups detected by STRUCTURE, although with a large dispersion within each of these groups, in part due to fact that PCoA was conducted at the level of individuals (Figure 4). The results obtained by the Neighbor Joining analysis showed two main groups (Figure 3), with the wild accessions of MII included within the Chiapas group. This could be an expected result considering that MII accessions were collected at sites that are geographically closer to Chiapas accessions (Figure 1). However, the bootstrap values obtained were low and thus do not provide strong support to this grouping pattern. Since low bootstrap values can result from the use of small sample sizes (Nei et al. 1983, Takezaki & Nei 1996) this could have been the case in the present study, where we used accessions with low number of individuals (between 4 and 10 individuals per accession) and only 10 SSR loci. Low bootstraps values obtained may also be due to the existence of recent gene flow between populations, which may be reflected in the admixed populations found, specially from Chiapas (Figure 5). Another explanation could be that maybe not enough time has passed for these populations to diverge by genetic drift.
The three methods used here to detect genetic patterns (STRUCTURE, PCoA and N-J) showed that the two accessions obtained from CIAT always grouped with the MI group. This could indicate that Chiapas wild populations are genetically closer to this group. However, this conclusion must be taken with caution because both CIAT accessions contained only 5 individuals, and one of these accessions had no complete information regarding origin of the samples. However, if we consider the result of the N-J, then the wild populations of Phaseolus lunatus of Chiapas are genetically closer to the MII group, implying that the genetic divergence of MI and MII may have occurred in the northern part of the Isthmus of Tehuantepec. An alternative explanation may be that the genetic divergence of MI and MII groups is still in process around of the Isthmus of Tehuantepec, the region that includes the state of Chiapas. Existence of admixed populations in MI and MII groups reported by studies that have used different molecular evidence (Serrano-Serrano et al. 2012, Andueza-Noh et al. 2013, 2015, Martínez-Castillo et al. 2014) support this idea.
Genetic structure and inbreeding in wild Phaseolus lunatus from Chiapas. The observed genetic differentiation between wild accessions of P. lunatus from Chiapas was higher than that reported for the Yucatan Peninsula region using also SSR markers (FST = 0.27, Martínez-Castillo et al. 2006). It is important to highlight that, compared with the Yucatan Peninsula, the territory of Chiapas is much more heterogeneous, with mountains, valleys, different climates and soils that favors the existence of geographical barriers that limit gene flow. Although historical gene flow (Nm) was not directly assessed in this study, the natural dispersion of P. lunatus wild populations by dehiscence of the sheath limits the radius of maximum dispersal of seeds (six meters) favoring low Nm values (Baudoin et al. 2004). Several studies have reported low Nm values (less than 1) for wild populations of this species (Ouédraogo & Baudoin 2002, MartínezCastillo et al. 2006).
The value of FIS for the Chiapas state was positive (0.163, P = 0.00625), suggesting an excess of homozygosity than expected from random mating, that it is usually the result of inbreeding, either by self-pollination or crosses among relatives. In Phaseolus lunatus, selfing is favored by the synchronized maturation of pollen grains and stigma and by their proximity within the flower bud (Webster et al. 1979). The FIS value found in Chiapas contrasts with the value reported by Martínez-Castillo et al. (2006) for the Yucatan Peninsula (FIS= -0.31). These differences in FIS between both regions of Mexico appear to correspond to the difference in the size the populations and the levels of endogamy, and it can be another factor to explain the greater differentiation in the P. lunatus wild populations from Chiapas.
Also, wild populations of Phaseolus lunatus have a metapopulation behavior (Barrantes et al. 2008), implying the existence of extinction and recolonization processes that may affect their genetic structure. It has been noted that the founder effect associated with recolonization increases the differentiation between subpopulations (Wright 1977). Although all these factors can lead to isolation by distance, our Mantel analysis was not significant and thus did not indicated the existence of such geographical isolation, which has previously been reported for the species (Martínez-Castillo et al. 2006, Serrano-Serrano et al. 2010). One possible explanation for this result is the existence of admixed accessions, namely accessions possessing ancestry derived from more than one accession as a result of recent gene flow. Although it is common to find reports of low levels of historical gene flow (Nm), new assignment tests of individuals based in Bayesian methods had reported admixed accessions in P. lunatus (Martínez-Castillo et al. 2014, Andueza-Noh et al. 2015). Examples of such accessions in the present study are JMC1391, JMC1393, JMC1389 (Figure 5).
Genetic diversity in wild Phaseolus lunatus from Chiapas. The genetic diversity observed in wild P. lunatus of Chiapas was high (HE = 0.48), although lower than previously reported for the Yucatan Peninsula (HE= 0.69, Martínez-Castillo et al. 2006) and all Mexico (HE= 0.61, Martínez-Castillo et al. 2014).The genetic diversity found in Chiapas was higher than that reported for the Central Valley of Costa Rica. This valley has a large number of wild populations of P. lunatus and is the only region, apart from Mexico, where there are studies of wild populations of this species (for a summary of these studies, see Baudoin et al. 2004). Ouédraogo and Baudoin (2002) conducted a preliminary analysis of the genetic diversity of P. lunatus using four SSR loci and 10 wild populations from the Central Valley of Costa Rica. They reported a low HO, 0.031. Ouédraogo et al. (2005), using 10 SSR loci and nine wild populations of the Central Valley of Costa Rica, reported %P = 48.89, A = 1.644, HO = 0.012, and He = 0.143. All these values are lower than those found for Chiapas in the present work (Table 4). One possible explanation for these differences in genetic diversity between the two regions is that the Central Valley of Costa Rica is subject to intensive commercial agriculture and the growth of urban areas, both factors affecting the wild populations of P. lunatus (Baudoin et al. 2004, Martínez-Castillo et al. 2006). The levels of genetic diversity found in Chiapas were slightly lower than averages reported for other plants that, as P. lunatus, are short-lived perennials (SSR, HE = 0.55) or have mixed mating systems (SSR, HE = 60) (Nybom 2004).
The results of the bottleneck analysis showed no relation to the size of sample of accessions. Some accessions containing four or five individuals showed higher values of the G-W index than other accessions with 10 individuals and viceversa (Table 3). Interestingly, JMC1391 accession (N = 5) showed the second lowest value of this index, but had high values of %P, A and HO compared to accessions that had higher values of this index (Table 4).
Conclusions
The results of this study support the hypothesis that the genetic divergence of MI and MII groups of wild Phaseolus lunatus is an ongoing process centered around the Isthmus of Tehuantepec. Our results also strengthen the hypothesis that Mexico is an important center of genetic diversity for this species. Currently, our group continues collecting wild populations of P. lunatus throughout Mexico to complete this sampling in 2016-2017. Also, we are currently conducting massive sequencing of SNP (Single Nucleotide Polymorphism) markers in order to expand the genomic sampling and thus characterize in detail the phylogeographic structure of P. lunatus var. silvester in Mexico. With this broader sampling at the population and genomic level, we plan to define priority areas of conservation for wild populations of P. lunatus and to provide data to define the exact sites of domestication of this especies.

