


Servicios Personalizados
Revista
Articulo
 Inglés (pdf)
 Artículo en XML
 Referencias del artículo
 Enviar artículo por email
Indicadores
-
 Citado por SciELO
 -
 Accesos
Links relacionados
-
 Similares en
SciELO
Similares en
SciELO
Compartir

 Permalink
Botanical Sciences
versión On-line ISSN 2007-4476versión impresa ISSN 2007-4298
Bot. sci vol.92 no.3 México sep. 2014
Genética
Evaluation of genetic diversity in Alcea (Malvaceae) using SRAP markers
Evaluación de la diversidad genética en Alcea (Malvaceae) con el uso de marcadores SRAP
Nasibeh Badrkhani1, Fatemeh Rahmani1'3 and Mozhgan Larti2
1 Department of Biology and Biotechnology Research Center, Urmia University, Urmia, Iran.
2 Agriculture and Natural Resources Research Center, Urmia, Iran
3 Corresponding author: f.rahmani@urmia.ac.ir.
Received: May 28th, 2013
Accepted: October 30th, 2013
Abstract
In this work, sequence-related amplified polymorphism (SRAP) marker was employed to assess the genetic diversity and genetic similarity relationships among14 species of Alcea collected from northwest of Iran. Seventeen SRAP primer combinations generated 104 fragments, of which 97 (93%) were polymorphic, with an average of 5.7 polymorphic fragments per primer. Percentage of polymorphism ranged from 50% (ME2-EM6) to a maximum of 100%, and mean polymorphism information content value obtained was 0.3. The lowest genetic similarity (0.17) was observed between A. sophiae and A. flavovirens, while the highest was found between A. digitata and A. longipedicellata (0.68). Two main clusters were detected using UPGMA, which did not correspond to geographical origin of the species. The study indicates that SRAP markers could be good candidates for assessing genetic variation in Alcea.
Key words: Alcea, genetic relationship, molecular marker, polymorphism.
Resumen
En este trabajo se usó el marcador de polimorfismo de amplificado de secuencias relacionadas (SRAP) para evaluar la diversidad genética y las relaciones de similitud genética en 14 especies de Alcea distribuidas en el noroeste de Irán. La combinación de 17 primers de SRAP generaron 104 fragmentos, de los cuales 97 (93%) fueron polimórficos, con un promedio de 5.7 fragmentos polimórficos por primer. El promedio de polimorfismos varió entre 50% (ME2-EM6) y 100%, y el contenido de información de polimorfismo fue de 0.3. Las semejanzas genéticas más bajas (0.17) se observaron entre A. sophiae y A. flavovirens mientras la más alta se encontró entre A. digitata y A. longipedicellata (0.68). Usando UPGMA se encontraron dos grupos principales sin relación al origen geográfico de las especies. El estudio indica que el marcador SRAP podría ser un buen candidato para evaluar la variación genética en Alcea.
Palabras clave: Alcea, diversidad genética, marcadores moleculares, polimorfismos.
The genus Alcea, a member of Malvaceae family, is perennial herb of Mediterranean with main centers of diversity in the Western Mediterranean Basin and the Middle East. Alcea contains only a few species in Europe (Escobar et al., 2009). Riedl (1976) has reported 39 species in Iran, but the number has been reduced to 34 due to taxonomic rearrangement (Pakravan, 2008). The mucilage that containing the plants of the Malvaceae family are sources of carbohydrates, which are used in medicine (Azizov et al., 2007). The species of this family, especially Alcea rosea has been used as diuretic, demulcents, emollient, aperients, and in the treatment of burning sensation, skin disease, and constipation (Shaheen et al., 2010).
Comparison of plant phenotypes is the simplest approach for the detection of mislabeled genotypes and assessment of genetic diversity. However, the environment also affects the phenotypes (Chakrabarti et al., 2001). Moreover, phenotypic characters are small in number and might be epistatically controlled (Sensoy et al., 2007). Alcea has a complicated taxonomy due to the very small number of diagnostic morphological characters, such as leaf sequence and configuration of the carpels (Pakravan, 2008).
DNA markers offer many advantages over morphological characters since are less influenced by the environment and provide a direct detection at the DNA level (Pradeepkumar et al., 2003; Joy et al., 2007). The polymerase chain reaction (PCR) amplification of the DNA has proven to be a rapid, simple and inexpensive way to assess the structure and genetic diversity (Liu et al., 2012). Sequence-related amplified polymorphism (SRAP), is a new molecular approach, introduced by Li and Quiros (2001). SRAP shows dominant molecular markers similar to Random Amplified polymorphism DNA (RAPD) markers, but with preferential random amplification of coding regions in the genome (Li and Quiros, 2001). The technique has been successfully applied in gene tagging (Song et al., 2010; Mishra et al., 2011; Inan et al., 2012), genetic linkage, map construction and genetic diversity analysis (Li and Quiros, 2001; Ferriol et al., 2003; Guo and Luo, 2006; Ding et al., 2008).
Actuality, no report has been published on genetic diversity of Alcea in the world. In this study, we report the first SRAP-based assessment of genetic diversity of Alcea species selected from six geographical locations in Iran. The objectives of the present work were: (1) to evaluate the level and distribution of genetic diversity of Alcea in North West of Iran, and (2) to analyze the genetic relationship of almost half number of species grown in this country.
Materials and methods
Plant materials. A total of 14 species of Alcea, collected from 6 regions of North West Iran, were chosen to represent a wide geographic range according to the distribution map of Alcea in Iran (Figure 1). Fresh leaves were randomly collected from 3-5 plants for each species and stored at -80 °C prior to DNA extraction. Voucher specimens were deposited at the Herbarium laboratory of Urmia Agriculture Research Center. Locality and Herbarium number of the Alcea species are indicated in Table 1.
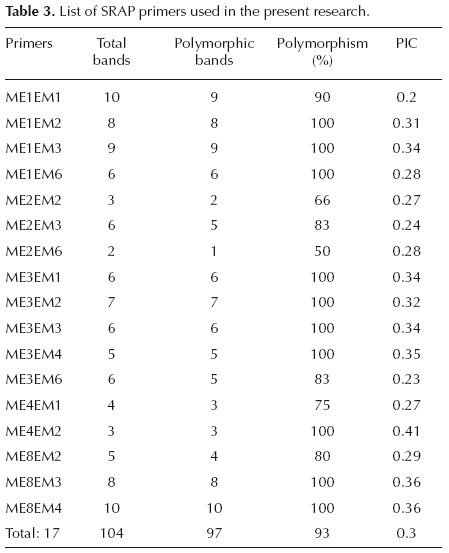
DNA extraction and SRAP amplification. Genomic DNA was isolated from fresh leaves tissue based on a modified CTAB procedure (Doyle and Doyle, 1987). The quantity and quality of DNA were assessed using Biophotometer (Eppendorf, Germany) and 1% agarose gel electrophoresis, respectively. Twenty five different SRAP primer combinations were employed using 5 forward and 5 reverse primers (Cinnagen, Iran; Table 2), of which 17 pairs produced clear and reproducible bands. These combinations were selected for the subsequent experiments (Table 3). Each 25 μl PCR reaction mixture consisted of 2.5 μl 10X PCR buffer, 1 μl of MgCl2 (50mM), 3 μl of template DNA (10 ng/μl ), 0.75 μl of dNTP (10mM), 0.5 μl of primers (100μM), 0.5 μl of Taq DNA polymerase (5U/μl ), and 16.25 μl of ddH2O (Cinnagen, Iran). PCR amplification was performed under the following conditions: 3 min of denaturing at 94 °C, 5 cycles of three steps: 1 min of denaturing at 94 °C, 1 min of annealing at 35 °C and 1 min 30 s of elongation at 72 °C. In the following 30 cycles, the annealing temperature was increased to 50 °C, with a final elongation step of 10 min at 72 °C. PCR products were analyzed on 3% agarose gel with 0.5X TBE buffer. By staining with ethidium bromide, the gels were visualized under UV transilluminator (Carestream Gel Logic 212 Pro Imaging System, USA) and photographed.
Data analysis. SRAP amplifications were repeated twice and only clear bands recorded for all samples. For each primer combination, the presence (1) or absence (0) of bands in each plant was visually scored. Data were set in a binary matrix and analyzed using the Numerical Taxonomy and Multivariate Analysis System (NTSYS-pc) 2.02 version software package (Rohlf, 2000). polymorphism information content (PIC) values were estimated according to the formula: PIC = 1 - Σ (Pij) 2, where Pij is the frequency of the ith marker revealed by the jth primer summed across all markers revealed by the primers (Botstein et al., 1980). The PIC was used to obtain the Jaccard genetic similarity (Jaccard, 1908), and to construct an unweighted pair group method with arithmetic mean (UPGMA) dendrogram (Rohlf, 2000) using the SIMQUAL module (part to the NTSYS package). The dendrogram was evaluated by comparing the Cophenetic Correlation Coefficient for the dendrogram with the similarity matrix using Mantel matrix correspondence test (Mantel, 1967). Bootstrap analysis was also used to evaluate the degree of support for clusters within the dendrogram with 1000 replicates using WINBOOT module (part to the NTSYS package). Principal Coordinate Analysis (PCoA) was obtained with the use the Jaccard coefficient to confirm associations among 14 species. A three dimensional plot (3D) was constructed using the first three PCs.
Results
Genetic diversity. Seventeen SRAP primer pairs showing polymorphic and reproducible bands, generated a total of 104 bands. Percentage of polymorphism ranged from 50% (ME2-EM6) to a maximum of 100% (nine other combinations), with an average of 93% (Table 3). The number of bands varied from two (ME2-EM6) to ten (ME1-EM1 and ME8-EM4) with an average of 6.11 per primer combination (Table 3). Amplicons were produced in a range of 100 to 3000 bp. The extent of polymorphism, revealed by the ME8-EM3 primer combination, is shown in figure 2. The number of polymorphic bands per primer ranged from one to ten, with an average of 5.7 per primer combination (Table 3). All primer combinations, except ME2-EM2 and ME2-EM6, showed more than 75% polymorphism. The PIC values for 17 primer combinations ranged from 0.2 (ME1- EM1) to 0.41(ME4-EM2), with an average of 0.3 (Table 3). Varying degrees of genetic similarity were revealed among Alcea species. Lowest similarity (0.17) was observed between A. sophiae and A. flavovirens, followed by 0.18 between A. sophiae and A. ghahremanii. The A. digitata and A. longipedicellata appeared to have the highest similarity (0.68).
Genetic relationship. Cluster analysis grouped 14 species of Alcea into two distinct clusters (Figure 3). Cluster I was further divided into two subclusters. The subcluster Ia comprised of four species including Alcea sophiae, A. kurdica, A. mozaffarianii, and A. hohenackeiri. The subcluster Ib consisted of A. xanthochlora, A. glabrata, A. wilhelminae, and A.tholozani. Cluster II was also further split into two subclusters. Subcluster IIa manifested of five species including A. rosea, A. digitata, A. longipedicellata, A. fasciculifolora, and A. ghahremanii. The A. flavovirens formed a single sub cluster (sub cluster IIb). The three branching points that differentiated Alcea species had bootstrap values of 75, 51, and 56, respectively. The rest of the branching points presented bootstrap values lower than 50. Bootstrap percentages above 50 were indicated (Figure 3). Cophenetic Correlation Coefficient of 0.71 was obtained between the similarity data matrix and the dendrogram. The separation of the species was also estimated using Principal Coordinate Analysis (PCoA). Based on genetic similarity, PCoA data accounted for 27.9%, 10.7%, and 9.7% of total variations, respectively (Figure 4). The result distinctly categorized 14 Alcea species into three clear groups. The A. xanthochlora, A. glabrata, A. wilhelminae, and A. tholozani shared genetic similarity and formed one group. Alcea sophiae, A. kurdica, A. mozaffarianii, and A. hohenackeiri species were also grouped together. These two groups corresponded to clusters Ia and Ib of the dendrogram. Species of A. rosea, A. digitata, A. longipedicellata, A. fasciculifolora, A. ghahremanii and A. flavovirens formed the third group. These species corresponded to cluster IIa and IIb of the dendrogram. PCoA analysis of whole collection obviously showed that results of PCoA are in good accordance with the clusters revealed by the dendrogram (Figures 3, 4).
Discussion
Knowledge of genetic relationship among plant taxa belonging to different species and genera is very important. Discovering new relationship provides a direction and sequential scale for plant evolution (Savolainen and Chase, 2003). In this work, SRAP marker was employed to assess genetic profile and pattern of genetic relationship within 14 species of Alcea. SRAP technique has been known as a powerful tool to identify genetic distance among different species. Budak et al. (2004) compared revealing genetic diversity power of four DNA markers including SRAP, SSR, ISSR, and RAPD. They reported SRAP as the most powerful DNA marker. This could be explained by the fact that SRAP markers preferentially detect polymorphism in coding sequences which are usually conserved among closely related species and varieties with low mutation rate (Mishra et al., 2011).
In our study, 17 primer combinations could amplify 104 discrete bands of which 97 were polymorphic (93% polymorphism). This value appeared to be relatively high, similar to the other SRAP based studies, e.g. orchid (80.52%; Cai et al., 2011), Salvia miltiorrhiza (90%; Song et al., 2010), and coffee species (93%; Mishra et al., 2011). This result implies that SRAP markers are efficient for analyzing polymorphism level in Alcea. Occurrence of high polymorphism could be explained for species in different climatic zones with varying selection pressure during the course of evolution (Mishra et al., 2011). Genetic diversity is affected by a number of evolutionary factors including mating system, gene flow and seed dispersal, geographic range, as well as natural selection (Hamrick and Godt, 1989). The geographic range of species appears to influence the levels of genetic diversity greatly. Generally, small geographic range of species leads to less genetic diversity than geographically widespread species (Hamrick and Godt, 1989). Based on this assumption, a high level of genetic diversity within species is expected in Alcea. Our genetic similarity analysis revealed a wide degree of variation from 0.17 to 0.68, which reflects sufficient amount of diversity among Alcea species in Iran.
The PIC value estimates the discriminatory power of a marker and, markers with higher PIC value possess higher identification power. Based on this point of view, values between 0.25-0.5 classify loci as middle diversity loci (Botstein et al., 1980). Our SRAP analysis produced a PIC value of 0.3 on average. The ME1-EM1 and ME4-EM2 primer pairs produced the lowest (0.20) and highest (0.41) PIC value, respectively.
To date, only a few studies looked at genetic variation in Alcea. Based on RAPD markers analysis, Kazemi et al. (2011) showed 93% polymorphism level with high variation in genetic similarity (0.31 to 0.75) within A. rosea populations in Iran. Ozturk et al. (2009) analyzed genetic profile of 18 Alcea species using RAPD markers and reported wide differentiation (0.13 to 0.69) among them.
According to SRAP dendrogram, most of the species were grouped in cluster I. Alcea sophiae and A. flavovirens appeared to have the least similarity (0.17). The A. longi-pedicellata and A. digitata, both collected from Silvana region, showed maximum similarity (0.68) and placed close to each other in the dendrogram. The UPGMA dendrogram (Figure 3) and PCoA plot (Figure 4) revealed no geographic tendency in the present study. The first three principal axes accounted for 48.3% of total variation, indicating the complex multidimensional nature of SRAP variation. However, both multivariate approaches used in the analyses of genetic similarity relationships among Alcea species produced comparable results (Figures 3, 4).
Despite of high level of distance observed among species, the statistical support for UPGMA clustering was low and only three branching events exhibited bootstrap support greater than 50%. The branch point that grouped Alcea sophiae and A. kurdica had the highest value (75%). These two species have the same geographical origin. This lack of support could be explained by insufficient number of SRAP markers tested.
Iranian Alcea species have only been characterized with morphological data, so far. However, the genus has a complicated taxonomy due to small number of characters. Based on study of Pakravan (2008) on Alcea, only examination of the leaf sequence and configuration of the carpels would represent valuable characters. For example, A.flavovirens and A. glabrata differ only in the size of the carpel and width of wing (Pakravan, 2008). Our results grouped these two species into two different clusters.
DNA markers hold useful information in comparison to morphological data (Chakrabarti et al., 2001; Pradeepkumar et al., 2003; Joy et al., 2007; Celka et al., 2010). The present study demonstrates that PCR based ingerprinting techniques, such as SRAP, are informative for estimating the extent of genetic diversity, as well as to determine the pattern of genetic relationships. our results indicated suficient amount of genetic distance (0.32 to 0.83) among different species of the genus in Iran. We also propose simultaneous use of different types of molecular markers in generating future information (Mishra et al., 2011). The primers used in our study will be useful in genetic analysis of Alcea in germplasm holding programs. observed polymorphism level was suficient to establish informative ingerprints with relatively few primer sets. We hope this research could be a good start to preserve pharmaceutical value of these species.
Acknowledgment
This research was financially supported by the Ministry of Sciences and carried out in the Biotechnology Research Center of the urmia university.
Literature cited
Azizov U.M., Mirakilova D.B., Umarova N.T., Salikhov S.A., Rakhimov D.A. and Mezhlumyan L.G.2007. Chemical composition of dry extracts from Alcea rosea. Chemistry of Natural Compounds 43:508-511. [ Links ]
Botstein D., White R.L., Skolnik M. and Davis R.W. 1980. Construction of a genetic linkage map in man using restriction fragment length polymorphism. The American Journal of Human Genetics 32:314-331. [ Links ]
Budak H., Shearman R.C., Parmaksiz I., Gaussoin R.E., Riordan T.P. and Dweikat I. 2004. Molecular characterization of Buffalograss germplasm using sequence-related amplified polymorphism markers. Theoretical and Applied Genetics 108:328-334. [ Links ]
Cai X., Feng Z., Zhang X., Xu W., Hou B. and Ding X. 2011. Genetic diversity and population structure of an endangered Orchid (Dendrobium loddigesii Rolfe) from China revealed by SRAP markers. Scientia Horticulturae 129:877-881. [ Links ]
Celka Z., Szczecinska M. and Sawicki J. 2010. Genetic relationship between some of Malva species as determined with ISSR and ISJ markers. Biodiversity and Research Conservation 19:23-32. [ Links ]
Chakrabarti S.K., Pattanavak D. and Naik PS. 2001. Fingerprinting Indian potato cultivars by random ampliied polymorphic DNA (RAPD) markers. Potato Research 44:375-387. [ Links ]
Ding G., Zhang D., Ding X., Zhou Q., Zhang W. and Li X. 2008. Genetic variation and conservation of the endangered Chinese endemic herb Dendrobium officinale based on SRAP analysis. Plant Systematics and Evolution 276:149-156. [ Links ]
Doyle J.J. and Doyle J.L. 1987. A rapid DNA isolation procedure for small quantities of fresh leaf tissue. Phytochemical Bulletin 19:11-15. [ Links ]
Escobar G.P., Schönswetter P., Fuertes A.J., Nieto F.G. and Schneeweiss G.M. 2009. Five molecular markers reveal extensive morphological homoplasy and reticulate evolution in the Malva alliance (Malvaceae). Molecular phylogenetics and Evolution 50:226-239. [ Links ]
Ferriol M., Pico B. and Nuez F. 2003. Genetic diversity of a germplasm collection of Cucurbita pepo using SRAP and AFLP markers. Theoretical and Applied Genetics 107:271-282. [ Links ]
Guo D.L. and Luo Z.R. 2006. Genetic relationships of some PCNA persimmons (Diospyros kaki Thunb.) from China and Japan revealed by SRAP analysis. Genetic Resources and Crop Evolution 53:1597-1603. [ Links ]
Hamrick J.L. and Godt M.J.W. 1989. AllozμMe diversity in plant species. In: Brown A.H.D., Clegg M.T., Kahler A.L. and Weir B.S. Eds. Plant Population Genetics, Breeding, and Germplasm Resources, pp. 43-63, Sinauer Associates, Sunderland. [ Links ]
Inan N., μldiz M., Sensoy S., Kafkas S. and Abak K. 2012. Efficacy of ISSR and SRAP techniques for molecular characterization of some Cucurbita genotypes including naked (Hull-Less) seed pumpkin. Journal of Animal and Plant Sciences 22:126-136. [ Links ]
Jaccard P. 1908. Nouvelles recherches sur la distribution florale. Bulletin de la Société Vaudoise des Sciences naturelles 44:223-270. [ Links ]
Joy N., Abraham Z. and Soniya E.V. 2007. A preliminary assessment of genetic relationships among agronomically important cultivars of black pepper. BMC Genetics 8:42. [ Links ]
Kazemi M., Aran M. and Zamani S. 2011. Evaluation of genetic diversity of Iranian wild Alcea rosea population using RAPD. World Applied Sciences Journal 13:1234-1239. [ Links ]
Li G. and Quiros C.F. 2001. Sequence-related amplified polymorphism (SRAP), a new marker system based on a simple PCR reaction: its application to mapping and gene tagging in Brassica. Theoretical and Applied Genetics 103:455-461. [ Links ]
Liu L., Yang Z., Wei S., Ouyang Z., Wu K. and Peng Z. 2012. iSSR and SRAP markers in the genetic relationship analysis among Pinellia in China. Journal of Medicinal Plants Research 6:3596-3602. [ Links ]
Mantel N. 1967. The detection of disease clustering and a generalized regression approach. Cancer Research 27:209-220. [ Links ]
Mishra M.K., Nishani S. and Jayarama. 2011. Molecular identification and genetic relationships among Coffee species (Coffee L.) inferred from ISSR and SRAP marker analyses. Archives of Biological Science, Belgrade 63:667-679. [ Links ]
Öztürk F., Babaoglu S., Uzunhisarcikli M.E., Acik L., Vural M. and Gürcan I.S. 2009. Genetic differentiation of Turkish Althaea L. and Alcea L. species. Advances in Molecular Biology 1:47-56. [ Links ]
Pakravan M. 2008. A new species and a new combination in Iranian Alcea (Malvaceae). Annales Botanici Fennici 45:133-136. [ Links ]
Pradeepkumar T., Karihaloo J.L., Archak S. and Baldev A. 2003. Analysis of genetic diversity in Piper nigrum L. using RAPD markers. Genetic Resources and Crop Evolution 50:469-475. [ Links ]
Riedl I. 1976. Malvaceae. In: Rechinger K.H. Ed. Flora Iranica 120, pp 1-86, Akademische Druck und Verlagsanstalt, Graz. [ Links ]
Rohlf F. J. 2000. NTSYS-pc: Numerical Taxonomy and Multivariate Analysis System (version 2.1). Exeter Publishing Ltd, Setauket. [ Links ]
Savolainen V. and Chase M.W. 2003. A decade of progress in plant molecular phylogenetics. Trends in Genetics 19:717-724. [ Links ]
Sensoy S., Büyükalaca S. and Abak K. 2007. Evaluation of genetic diversity in Turkish melons (Cucumis melo L.) based on phenotypic characters and RAPD markers. Genetic Resources and Crop Evolution 54:1351-1365. [ Links ]
Shaheen N., Khan M.A., Yasmin G., Hayat M.Q., Munsif S. and Ahmad K. 2010. Foliar epidermal anatomy and pollen morphology of the genera Alcea and Althaea (Malvaceae) from Pakistan. International Journal of Agriculture and Biology 12:329-334. [ Links ]
Song Z., Li X., Wang H. and Wang J. 2010. Genetic diversity and population structure of Salvia miltiorrhiza Bge in China revealed by ISSR and SRAP Genetica 138:241-249. [ Links ]

