


 texto em
  Inglês (pdf)
 Artigo em XML
 Referências do artigo
 Enviar este artigo por email
 Citado por SciELO
  Similares em
SciELO
Similares em
SciELO 
 Permalink
Introduction
Optimizing the use of irrigation water is a strategy to reduce the great problem of its scarcity for agricultural use in the Comarca Lagunera and in more than 50 % of the country (Comisión Nacional del Agua [CONAGUA], 2019). For this reason, in recent years, efforts have been made to achieve maximum yields per unit volume of water applied, instead of per surface area, leading to improved crop water productivity in agriculture. This has consequently caused the study of irrigation management strategies, such as deficit irrigation, where water supply is lower than the crop's water needs, generating a slight shortage during the development stages, where the crop is less sensitive to a water deficiency (Galindo et al., 2018). Other strategies employed are partial root drying (PRD) or stressing the crop with different levels of water potential. These strategies have been successful in crops such as sunflower (Karam et al., 2007; Mila et al., 2017), being tolerant to water stress generated by deficit irrigation or under different water potential levels, as well as being able to produce high yield in response to irrigation inputs (Sezen et al., 2011). The plasticity of sunflower is recognized in terms of adapting leaf area development to water availability (Ren et al., 2018).
The importance of sunflower consists in the production of edible oils with health benefits, due to its high content of polyunsaturated fats. Another important product obtained from sunflower is the paste, which contains between 40 and 50 % protein, with favorable amino acids for livestock and poultry feed (Escalante-Estrada et al., 2007). Ren et al. (2018) report that sunflower has the ability to reduce its water consumption by up to 20 % without significantly affecting its yield. However, sunflower is sensitive to water stress at critical stages, such as early flowering and seed filling (Ebrahimian et al., 2019).
Karam et al. (2007) point out that irrigation limitation at early flowering and mid-flowering should be avoided, while it can be tolerated at seed formation. These authors found that deficit irrigation at early flowering and mid-flowering reduces grain yield by 25 and 14 %, respectively, relative to a control without moisture restriction. In addition, they found that deficit irrigation at the beginning of grain filling increases yield to 5.50 t·ha-1.
Steduto et al. (2012) indicate that the total available water in the root zone should not exceed 40 % to obtain higher yields; this especially during late vegetative periods, flowering and seed formation. Liu et al. (2018) evaluated grain yield of sunflower without moisture restriction (IP) and with deficit irrigation (with irrigation at flower bud initiation [IF] and with irrigation when flower buds start to open [FA]), and a control under rainfed conditions. The IP, IF and FA treatments produced a higher leaf area index, plant cover, inflorescence diameter and yield compared to rainfed sunflower. Moreover, yield decreased by 6 and 15 % in the IF and FA treatments, respectively, compared to the IP.
García-López et al. (2016) concluded, with three years of study, that sunflower maintains its maximum production when irrigated with 60-80 % of the optimum water volume. Thus, these authors obtained grain yields of 2.6 t·ha-1 when adding 589.7 mm of water in 2012, 3.3 t·ha-1 when adding 1 019 mm in 2013, and 2. t·ha-1 with 652.4 mm applied in 2014. Howell et al. (2015) reported grain yields of 3.08 t·ha-1, with a water use efficiency (WUE) of 0.49 kg of dry sunflower seed per m3 of water consumed. They also obtained a seed oil concentration of 30 to 40 %, a crop development coefficient of 0.15 at initial growth, a maximum evapotranspiration rate of 1.22 and higher vegetative cover.
López-Urrea et al. (2014) reported, for 2009 in the sunflower crop, a total water consumption of 619 mm, while for 2011 the consumption was 576 mm. The sunflower development coefficient was 1.10 and 1.20 for the years mentioned, respectively, and both values coincided with the higher sunflower plant cover.
Therefore, the objective of this study was to determine the grain yield of sunflower at different levels of soil moisture depletion, to estimate the WUE of the crop under different water conditions and to look for alternatives to maximize grain yield per m3 of water consumed.
Materials and methods
The study was carried out at the experimental field of the Instituto Nacional de Investigaciones Forestales, Agrícolas y Pecuarias, CENID-RASPA, located at 25° 31’ 57’’ N and 103° 25’ 57’’ W, at 1 139 m a. s. l. in the ejido Las Huertas in Gómez Palacio, Durango, Mexico. The climate of the area is classified as BW(h’)hw(e), which corresponds to very arid-warm with mean annual temperature of 22 °C and mean temperature of the coldest month of 18 °C, according to the Köppen climate classification modified by Enriqueta García (García, 2004). Average precipitation ranges from 200 to 300 mm per year in the irrigated agricultural zone, and from 400 to 500 mm in the western mountainous zone, with average annual evaporation of 2 600 mm. The frost-free period is from April to October, with hailstorms in May. With rainfall in summer, and winter rainfall of 5 to 10 % of the total.
The soil was characterized by sampling at three depths (0-30, 30-60 and 60-90) and four replicates. Regarding chemical characteristics, the soil showed low nitrate availability (Kjeldahl method), moderately low phosphorus availability (Duval method) and high potassium availability (spectrophotometry), and low contents of soluble salts, sodium and organic matter (Castellanos et al., 2000). Due to its pH of 8.4, the soil is considered alkaline, so it could have assimilation problems of Fe, Mn and Zn, but it is a soil with high productivity when irrigated and without significant deficiencies of these microelements.
The physical characteristics of the soil were low organic matter content (Walkley and Black's method), clay loam texture (sand, silt and clay at 19, 45 and 30 %, respectively) (Robinson's pipette method), field capacity of 30 %, permanent wilting point of 15 % (pot and pressure membrane method, respectively) and bulk density of 1.27 g·cm-3 (graduated cylinder) (Richards, 1977).
Madero 91 was the sunflower variety used in this study. Sowing was carried out on July 1, 2018, at a density of 62 000 plants·ha-1, and harvest was on October 4 of the same year, resulting in an experimental period of 106 days. Based on the initial soil sampling, fertilization was done with the formula 120-60-0 (N-P-K). Half of the fertilizer was applied at the time of sowing, and the remainder at the first auxiliary irrigation (15 days after sowing).
Seven combinations of soil moisture depletion (ASM) were analyzed, which resulted from the San Cristobal treatment matrix for two 4x4 factors (Villasmil et al., 1974). These ASM combinations were applied in two periods: 1) from emergence to the beginning of flowering (vegetative stage) and 2) from the beginning of flowering to physiological maturity (reproductive stage). The selected levels of each factor were 40, 60, 80 and 100 % of the ASM in each phenological stage; thus, the seven treatments were 40-40, 40-80, 60-60, 60-100, 80-40, 80-80 and 100-60. The treatments were randomly distributed under a randomized block experimental design with four replicates. The experimental unit was 4 x 5 m (20 m2 per plot).
The time domain reflectometry (TDR) method was used to determine soil moisture depletion in each treatment. For this purpose, a sensor (Model Trime-Pico T3/IPH44 from IMKO) was placed in a probe that was inserted into access tubes at different soil depths. This method can achieve an accuracy of 0.3 % of volumetric moisture. The equipment was previously calibrated in the experimental soil and the gravimetric method was used as the standard method, with augers type vehimeyer type (Inzunza-Ibarra et al., 2012).
For irrigation purposes, a pressurized pipeline was installed from the supply source to the experimental area. The conduction pipe was 152.4 mm in diameter, with hydrants every 36 m, for the irrigation of the surrounding melgas of the experimental area. Another 38.1 mm diameter pipe was connected to it, with connections for the union of a hose provided with a calibrated volumetric meter, to precisely apply the required volume of water to the experimental plots.
During the development of the crop, soil moisture was sampled continuously. The first sampling was to measure the initial moisture before pre-planting irrigation. Subsequent samplings were made during the experiment to monitor soil moisture depletions in each treatment. Three readings were taken per stratum and the average was recorded. The same was carried out for the other soil depths, up to 90 cm if the crop height was greater than 80 cm. When reaching the level of available soil moisture by the crop established for each treatment, auxiliary irrigation was applied to recover the soil moisture until the field capacity was reached in the 90 cm soil profile. At the beginning of crop development, a variable irrigation depth was considered according to root growth; this was obtained by exploring the plants of the adjoining plots with a growth equal to that of the plants in the experiment.
The variables evaluated were grain yield (Y; t·ha-1), water consumed (WC; cm), water use efficiency (WUE; relating grain yield to water consumed [kg·m-3]) and maximum evapotranspiration of sunflower (mm).
Data were analyzed with an ANOVA and Tukey's comparison of means (P ≤ 0.05). Regression analysis and optimization of variables were carried out based on the theory of maxima and minima of differential calculus, and with the stepwise technique (SAS Institute, 2011).
Results and discussion
Climate conditions
Figure 1 shows the differences in average temperature during the growing season and the historical average (1975-2011) in the same period. In this figure, differences of more than 2 °C were observed from July 10 to mid-August, but in the remaining period the differences were minimal. In general, there was an average difference of 1.3 °C during the sunflower development cycle.
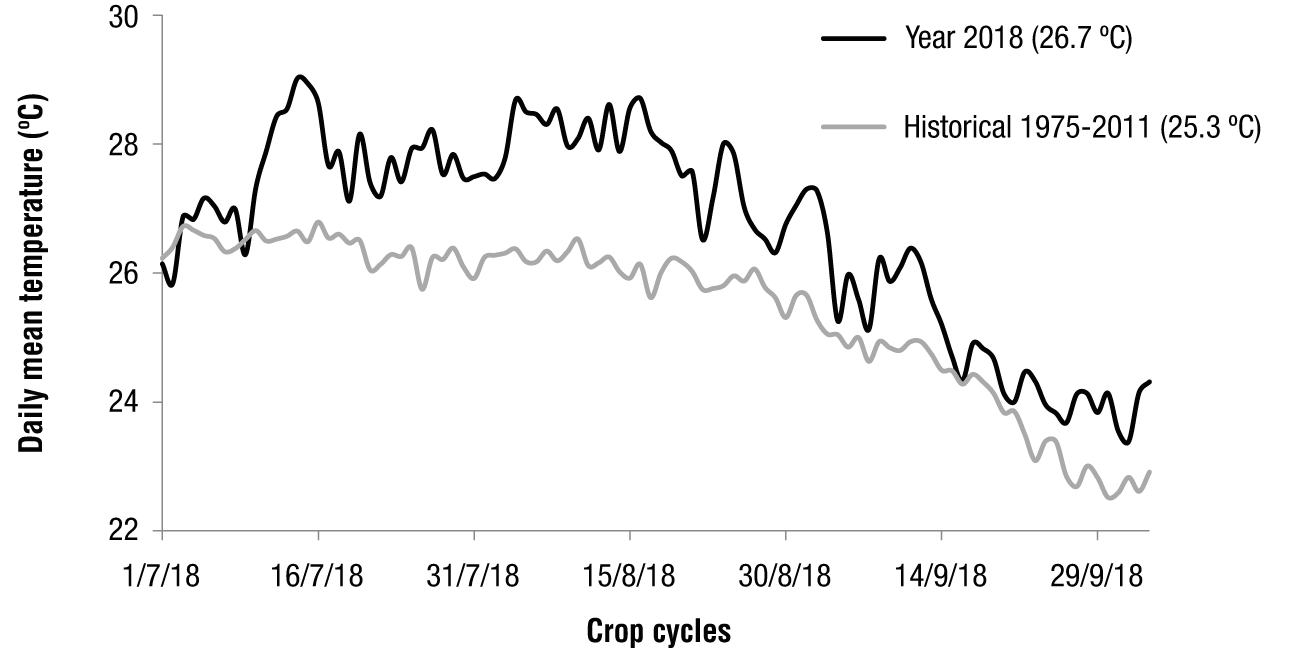
Figure 1 Comparison of the average temperature during sunflower development and the historical temperature (1975-2011).
Figure 2 shows the precipitation during the crop cycle and the historical rainfall (1975-2011). This figure shows that, although the average rainfall during the year of the study was 18 % lower than the historical rainfall, precipitation during sunflower development was 57 % higher than the historical precipitation. Most of the events were less than 1 mm; only in August and September there were six rainfall events between 4 and 5 mm. These rainfall events were considered in the soil moisture balance, and only delayed the pre-set moisture level of the treatment, without affecting the homogeneity of the treatments.

Moisture content in treatments
ASM values in the field were close to those planned in the treatments, where the differences between that projected and that obtained in the field were insignificant (Table 1). The ASM ranged between 41.9 and 100 % throughout the cycle. The lowest values were obtained with the 40-40 treatment (43.3 and 41.9 %, respectively), and the highest with 100-60 (99.6 and 60.7 %) and 60-100 (57.7 and 100 %).
Table 1 Moisture contents, yields and water use efficiency of sunflower grown under different water conditions.
| Treatment | #R1 | #R2 | ASM1 (%) | ASM2 (%) | WC1 (cm) | WC2 (cm) | WCT (cm) | Y (t·ha-1) | WUE (kg·m-3) |
|---|---|---|---|---|---|---|---|---|---|
| 40-40 | 4 | 6 | 43.3 | 41.9 | 35.10 | 33.60 | 68.7 | 4.42b | 0.642b |
| 40-80 | 4 | 3 | 43.3 | 82.1 | 35.10 | 25.19 | 60.29 | 3.80b | 0.630b |
| 60-60 | 2 | 4 | 58.8 | 60.5 | 31.14 | 28.12 | 59.26 | 5.46a | 0.922a |
| 60-100 | 2 | 1 | 57.7 | 100 | 31.14 | 22.16 | 53.3 | 2.40c | 0.452c |
| 80-40 | 2 | 4 | 79.8 | 44.4 | 28.16 | 32.09 | 60.25 | 3.94b | 0.655b |
| 80-80 | 2 | 3 | 83.3 | 81.4 | 28.16 | 26.21 | 54.37 | 4.09b | 0.752b |
| 100-60 | 1 | 3 | 99.6 | 60.7 | 24.36 | 33.45 | 57.81 | 2.78c | 0.475c |
#R1 and #R2 = number of irrigations in the first and second stages, respectively; ASM1 and ASM2 = available soil moisture at vegetative and reproductive stages, respectively; WC1, WC2 and WCT = irrigation consumed at vegetative, reproductive and total stages, respectively; Y = sunflower grain yield; WUE = water use efficiency.
In the case of the water consumed (WC), the highest consumption in the first and second period was presented in the 40-40 treatment, which has the wettest conditions, while the lowest consumption at vegetative stage was in the 100-60 treatment (24.36 cm), which had the lowest moisture content in that stage, and the lowest consumption in the reproductive stage was obtained in the 60-100 treatment (22.16 cm). This latter treatment showed the lowest water consumption in the entire vegetative cycle of sunflower (53.3 cm).
In general, the crop responded differently according to the timing and water applied in irrigation. Transpiration rates decrease at higher ASM and, in this case, daily crop rates responded to progressive soil drying (Kiani et al., 2016). Reducing transpiration rate and thus minimizing water loss in response to water deficit in sunflower is an aspect of drought tolerance. This is achieved by reducing the rate of leaf area expansion or transpiration per unit leaf area (stomatal conductance) (Khaleghi et al., 2020).
Grain yield and water use efficiency
Y and WUE, as a response to soil moisture conditions in each treatment, had a similar trend (Table 1 and Figure 3). For both parameters, the ANOVA analysis showed highly significant differences among treatments (P ≤ 0.01). The 60-60 treatment was significantly higher (P ≤ 0.05) in terms of Y and WUE (5.46 t·ha-1 and 0.922 kg·m-3, respectively) (Table 1). The above is attributed to the application of irrigation at 58.8 and 60.5 % of ASM; that is, when the soil has a stress of -0.48 and -0.461 MPa to extract moisture in the first and second periods, respectively. Paul et al. (2020) indicate that the classical lower limit of permanent crop wilting is -1.5 MPa. Khaleghi et al. (2020) reported, in controlled sunflower treatments, that the threshold values below, where the rate of leaf expansion and transpiration start to decrease is close to 60 % of ASM for leaf expansion and 40 % of ASM for daily transpiration. This indicates that the results found are consistent with those in the literature.

Figure 3 Response of sunflower grain yield (Y) under different irrigation conditions. ASM1 and ASM2 = available soil moisture at vegetative and reproductive stages, respectively.
The highest average WUE value, reported in this study, is similar to values found by other authors who applied different irrigation management strategies. Sezen et al. (2011) reported values up to 1 kg·m-3 using the partial root drying technique, and Farhadi-Machekposhti et al. (2017) found values close to 1 kg·m-3 by mixing up to 30 % seawater in freshwater.
On the other hand, the highest WUE value is higher than that reported by Karam et al. (2007) (0.83 kg·m-3), with deficit irrigation technique, and by El-Bially et al. (2018) (0.75 kg·m-3), who used ascorbic acid to alleviate the adverse effects of water deficit in sunflower plants. In general, WUE values were found to be higher in stressed treatments than in abundantly irrigated treatments (García-López et al., 2016). Regarding the above, stressing the sunflower crop and letting the ASM reach 60 % can be an alternative to increase water use efficiency, furthermore, it is an ideal practice in areas that suffer from frequent periods of water deficit.
The lowest Y and WUE values were found with treatments 60-100 (2.4 and 2.8 t·ha-1, respectively) and 100-60 (0.452 and 0.445 kg·m-3, respectively). These combinations had in common water stress conditions close to the permanent wilting point in some of the stages studied. Comparison of means indicated that these treatments were statistically lower in Y and WUE than the rest of the treatments, but equal to each other (Table 1). The above indicates a non-linear response of sunflower Y and WUE by soil moisture conditions at the time of irrigation. That is, an increasing and decreasing effect of Y and WUE was observed due to the different levels of moisture depletion studied (Figure 3).
The moment and when to apply irrigation to sunflower is more important than the amount of water in the response of Y and WUE. This is evidenced by comparing the highest Y and WUE treatment (60-60 with 5.46 5.46 t·ha-1 and 0.922 kg·m-3, respectively), with the lowest Y and WUE treatment (60-100 con 2.46 t·ha-1 y 0.452 kg·m-3, respectively).
Grain yield production model with soil moisture regime
The observed data of Y (dependent variable) and ASM (independent variable) in two phenological periods of sunflower were fitted by regression analysis. The function found is presented in Equation 1.
where Y is the grain yield (t·ha-1), ASM 1 and ASM 2 are the available moisture used at vegetative and reproductive stages, respectively (%), R 2 is the coefficient of determination and CV is the coefficient of variation. The regression coefficients of each of the linear effects (quadratic and interaction) were highly significant, so they help in the model to explain the response of the crop to the treatments.
According to the statistical parameters (R2 and CV), the model obtained satisfactorily explains the phenomenon that occurred (Figure 3). The optimum levels of ASM were determined and it was found that the highest Y (5.5 t·ha-1) was found under a soil moisture regime of 60.5 and 61.6 % ASM at vegetative and reproductive stages of the crop, respectively. These results agree with those reported by García-López et al. (2016), who concluded that the optimum yield is found between 60 and 80 % ASM. When analyzing the proximity of the maximum marginal productivity of the model, it is estimated that when plants are exposed to a soil water deficit of 70 and 70 % ASM, grain yield only decreases 2.4 %, which is not significant compared to the yield referred previously.
Model of grain yield and water consumed
When relating Y and WC of each treatment, we found that there is a quadratic relationship between these variables. The function obtained, after performing the regression analysis between both variables, is shown in Equation 2.
Where WC 1 y WC 2 is water consumed at vegetative and reproductive stages, respectively (cm).
The previous fitted model has a satisfactory predictive ability for this type of complex biological relationships, where several plant, soil and environmental factors are involved (Figure 4). Model optimization was performed according to differential calculus, and it resulted that sunflower grain yield is maximized at 5.5 t·ha-1 by consuming 33.1 and 29.7 cm of water at vegetative and reproductive stage, respectively. However, when applying the irrigation deficit criterion, the neighborhoods to the optimum were analyzed and it was deduced that, if sunflower consumes 29 and 29 cm in the mentioned stages, Y has a non-significant reduction of 6.1 %, which would allow a saving of 500 m3·ha-1.

Conclusions
The highest water use efficiency of sunflower (0.922 kg·m-3) was found when 31.4 and 28.12 cm of irrigation, with soil water levels of 58.8 and 60.5 % of available soil moisture at vegetative and reproductive stage, respectively, which corresponded to the 60-60 treatment.
The developed model, which relates grain yield and soil moisture levels, maximizes sunflower production at 5.5 t·ha-1, under soil water stress of 60.5 and 61.6 % of available soil moisture at vegetative and reproductive stages, respectively. However, the function estimates that it is possible to apply a water deficit of up to 70 and 70 % of the usable moisture in the mentioned stages, with a non-significant decrease in grain yield (2.4 %).
The optimization of the function that related grain yield to the amount of water consumed showed that the maximum yield occurs when the crop consumes 33.1 and 29.7 cm of water at vegetative and reproductive stages, respectively. In a similar way, this model estimated that, when applying an irrigation deficit of 29 and 29 cm in the stages under study, an insignificant decrease of 6 % in grain yield is reached.
According to the information provided by the different soil water conditions, grain yield and water productivity show a non-linear response to both water stress and water consumption.

