


 texto en
  Inglés (pdf)
 Artículo en XML
 Referencias del artículo
 Enviar artículo por email
 Citado por SciELO
  Similares en
SciELO
Similares en
SciELO 
 Permalink
Introduction
Soil water erosion refers to the processes of detachment, transport and deposition of soil particles by water (Nájera et al., 2016). The energy needed to carry out this process is provided by the kinetic energy of raindrops as they impact the soil surface and by the shear energy of the flow as it moves over the soil surface (Angulo-Martínez & Begueria, 2013). In arid and semi-arid regions, torrential rainfall events are of high intensity and short duration of time, which causes runoff with high erosive potential. Soil loss generated by rainfall events with an intensity range between 40 and 70 mm·h-1 is more related to erosive energy of runoff than to erosion produced by rainfall per se (Reza-Vaezi et al., 2017).
Soil cover (whether with vegetation, plant residues or organic mulch) mitigates water erosion caused by runoff (Ruíz-Colmenero et al., 2013). It has been reported that mulching improves soil structure and reduces soil compaction, increases organic carbon content, and favors infiltration rates (Mankin et al., 2007). Vegetative cover decreases the energy of overland flow or runoff through barriers formed on the soil surface, which mitigates the erosive impact caused by runoff (O'Farrell et al., 2009; Seitz et al., 2019). The process of soil particle detachment in interrill areas for overland flow is determined by the structural condition of soil aggregates and the absence of cover capable of reducing the erosive velocity of runoff (Velásquez-Valle et al., 2006).
Tillage practices, such as fallow, increase topsoil roughness and can temporarily reduce runoff (Luo et al., 2020). However, soil cover with plant residues has been found to be more effective in reducing runoff than surface roughness caused by tillage (Ramos et al., 2016). In contrast, sparse surface cover facilitates the detachment, transport, and deposition of soil particles by rainfall and surface runoff (Martínez et al., 2017).
Topsoil cover with plant residues acts as a filter to reduce runoff, nutrient loss, and sediment production, which reduces erosion and promotes ecosystem restoration (Feng et al., 2018; Wang et al., 2020). The use of 6 m grass barriers or strips has been reported to reduce field soil losses by more than 90 % after the third year (Le Bissonnais et al., 2004).
Besides conventional methods to quantify the process of water erosion at different spatial scales, from runoff plots (Carfagno et al., 2018) to watersheds (Warren et al., 2019), there are alternative methods by which spatial patterns of soil erosion can be estimated. One this method is to produce maps at different temporal scales that reflect a difference in ground surface elevation. In this case, it is assumed that the difference in surface relief is due to erosion or deposition of sediment or soil particles (Gillan et al., 2016; Erskine et al., 2017). Therefore, the objective of this study was to determine the behavior of different soil covers in the erosion and sediment deposition processes caused by overland flow.
Materials and methods
Geographical location of the experimental site
The study was carried out in the municipality of Mapimí, Durango, Mexico, located at 25° 52’ 26’’ N and 103° 43’ 29’’ W, at 1 168 m a. s. l. (Figure 1). The maximum temperature recorded in the study area was 44 °C and the minimum -10 °C, with an annual average of 19.4 °C. Average annual precipitation of 304.8 mm (Medina-García et al., 2005). The soils of the region are limestone, alluvial, dark light brown in color, clay texture with gravel and a slope of the land that ranges from 0.5 to 8 % (García-Gutiérrez et al., 2006).

Figure 1 a) Geographical location of the municipality of Mapimí, Durango, in the north-central of Mexico, b) view of the rangeland field and experimental area at the beginning of the experiment, c) access ditch to the experimental area with stadia for measurement and d) experimental area with the study established already.
Description of the experimental site
According to the physical-chemical analysis, the soil of the experimental site is sandy loam, with 56, 28 and 16 % of sand, silt, and clay, respectively, wilting point (WP) of 9.6 % and field capacity (FC) of 19.7 %. The soils of this region are poor in macro and micro elements, although with good levels of potassium (68.4 mg·kg-1) and calcium (33.7 meq·L-1), correspond to alkaline soils with a pH of 8.3.
Experimental and treatment design
A randomized block experimental design with three replications was used. The surface soil cover treatments were: 1) application of 10 t·ha-1 of maize harvest residues (MHR), 2) sowing of 10 kg·ha-1 of buffel grass seed (Cenchrus ciliaris L.) (Z), 3) application of 10 t·ha-1 of maize harvest residues combined with 10 t·ha-1 of buffel grass seed (MHR + G) and 4) control (C), without any type of cover. Each experimental unit (treatment) was 5 x 5 m in size. The experimental area was of 300 m2 (10 x 15 m), with all treatments and with a slope average of 0.7 %.
The study was carried out from July to September 2017 in an area without vegetation cover. Prior to the experiment, the soil of the experimental area was prepared with a harrow to a depth of 5 cm in dry soil. For treatments with grass, the broadcast seeding method was used, ensuring that the seed was evenly distributed, and covered with a light layer of soil passing with the harrow for a second time so that the seed was not left exposed. Dry maize harvest residues were used as a cover, it was placed immediately after sowing in the corresponding treatments.
Variables measured
Precipitation in the experimental area during the study period was quantified every minute using a microclimatic station (Heavy Weather Pro WS 2800, La Crosse Technology®, USA). Runoff was determined by the approximation method, which was used to calculate the volume of water from the stream that entered the experimental plot in each rainfall event. For this purpose, the height (cm) of the water level was measured every 5 min at two sites in the channel, from the beginning to the end of the runoff event (Allen, 2007; Linsley et al., 1998). One measurement site was 200 m from the entrance of a rangeland area, and the second site was located 100 m from the experimental area, corresponding to a water outlet in the middle of the rangeland surface, so that the water arriving to the experimental area was homogeneous approximately.
According to Figure 2, runoff data were obtained with Equations 1 to 3.

Figure 2 Trapezoidal ditch: a) at the entry to the rangeland and b) at the entry to the experimental area.
Flow rate or volume per unit of time was calculated using the following equation (Weight & Sonderegger, 2001):
where Q is the discharge (m3·s-1), V is the representative flow velocity (m·s-1) and A is the hydraulic cross-sectional area of the channel (m2), which is perpendicular to the direction of V, calculated using Manning's formula:
where r is the hydraulic radius of the section (m), s is the slope of the section (m·m-1) and n is the roughness coefficient (dimensionless). To obtain r, the measurements in the hydraulic section include the wetted perimeter (Wp) and the height of the water level (h) (Equation 3):
Estimating the load-discharge curve
Based on Equation 1, the hydraulic section was gauged at different heights, changing them every 2 cm, to obtain the load-discharge curve with the objective of deriving the equation to fit the behavior of the curve data (Table 1).
Table 1 Variation of hydraulic section heights and calculation of flow rate (Q i ) for site 1 (rangeland area) and site 2 (experimental area).
| Heights (h, m) | Site 1 (Qi, m3·s-1)* | Site 2 (Qi, m3·s-1)* |
|---|---|---|
| 0.02 | 0.0028 | 0.0026 |
| 0.04 | 0.0089 | 0.0081 |
| 0.06 | 0.0172 | 0.0155 |
| 0.08 | 0.0275 | 0.0246 |
| ⁞ | ⁞ | ⁞ |
| 0.40 | 0.3412 | 0.2383 |
| 0.42 | 0.3667 | 0.2571 |
| 0.44 | 0.3928 | 0.2762 |
*Calculated with Equation 1 (Q = A x V).
Based on the values obtained for Q i from each site, the discharge (Q) curves shown in Figure 3 were generated, corresponding to values of Q = 1.4994h 1.589 (R2 = 0.99) and Q = 1.1955h 1.548 (R2 = 0.99), for sites 1 and 2, respectively.
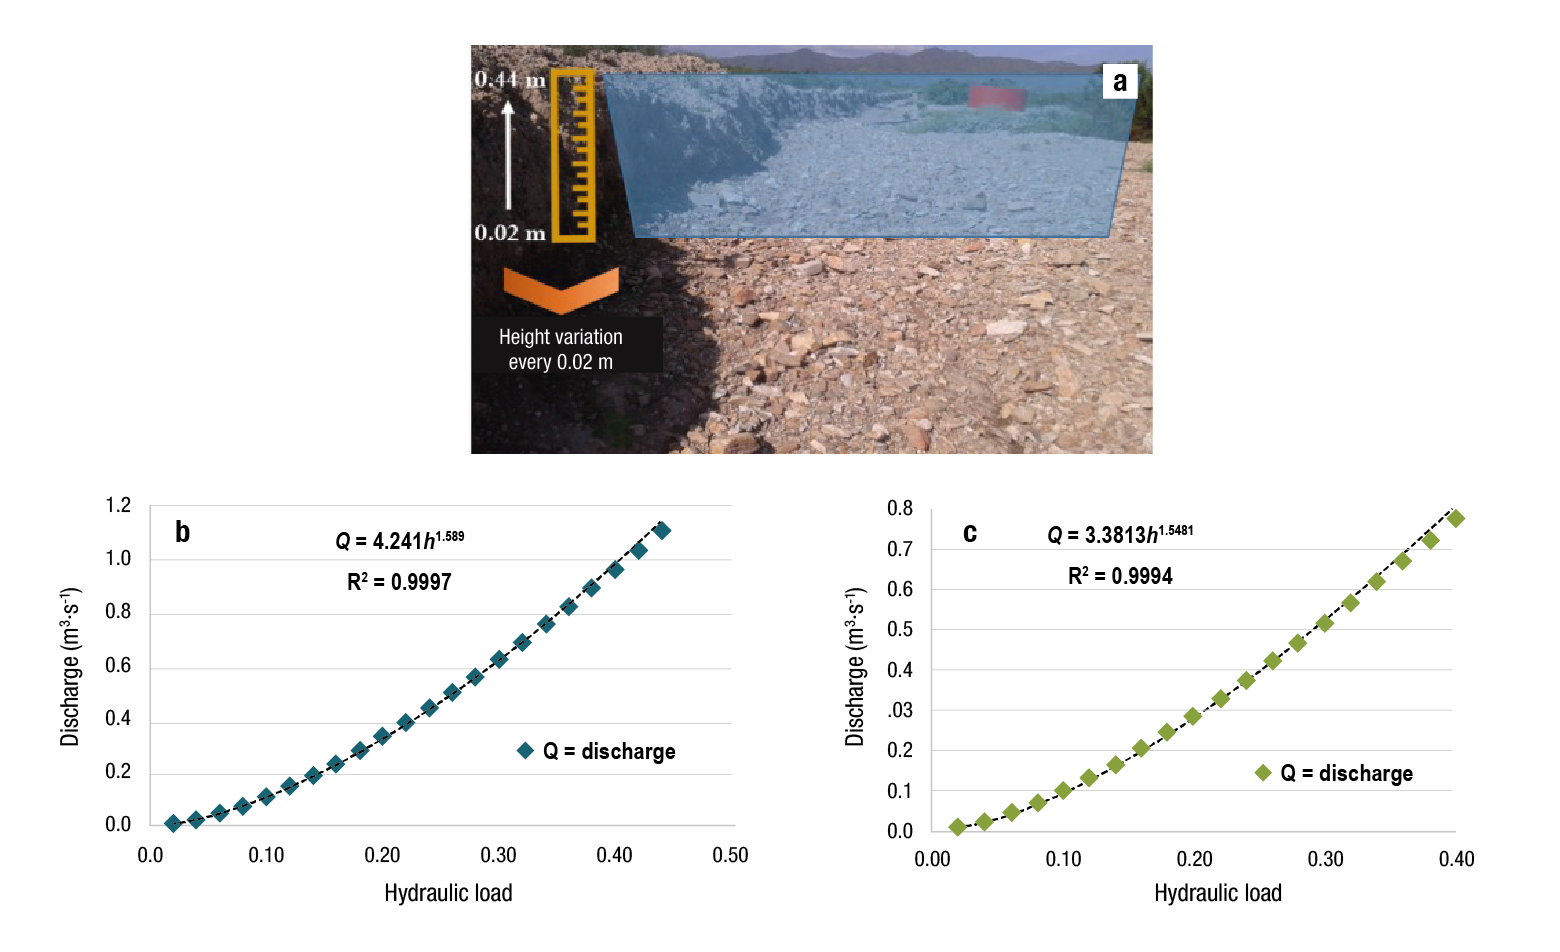
Figure 3 Load-discharge rate with regression trend line fitted to Q data: a) experimental site, b) entry to the rangeland field and c) entry to the experimental area.
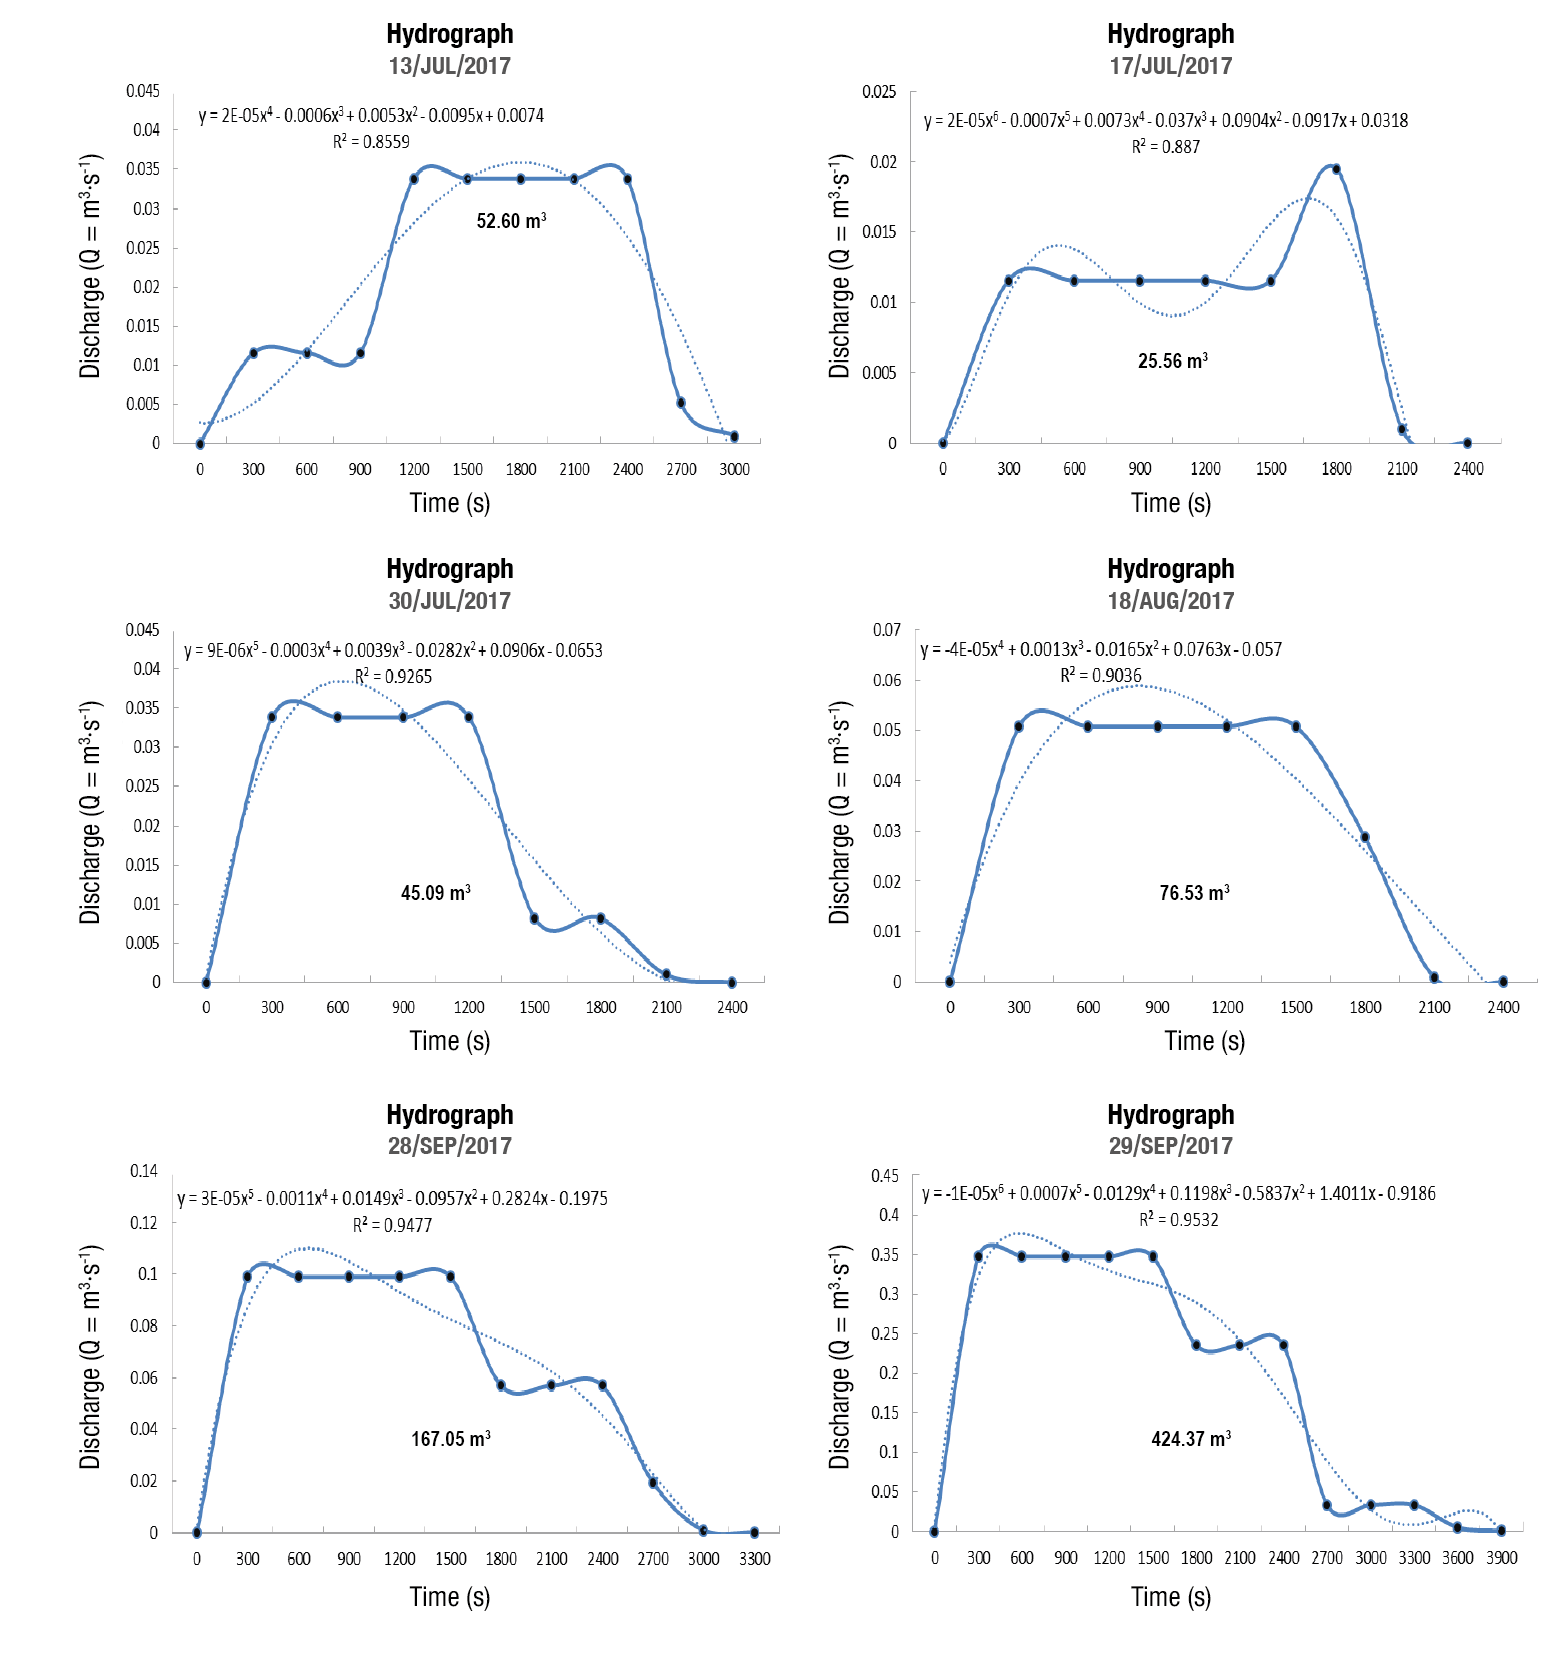
Six hydrographs were obtained as a product of the precipitation that occurred at the site during the study period. With the data obtained and the analytical approximation, the volume of each hydrograph was determined. This approximation consists of the exact solution obtained by integrating the mathematical function that describes it. This function was found using the CurveExpert 1.40 computational package, which allowed fitting observed data to different polynomial functions (Sánchez-Cohen et al., 2015).
The polynomial model describing the hydrograph (𝑥) and the total volume (V) is as follows:
Overland flow estimate
According to the volume given by each hydrograph in the gauging section at the entry of the experimental area, the sheet runoff was calculated with Equation 5 (Bolaños-González et al., 2001):
where LR is the sheet runoff, V is the runoff volume (m3) and A is the area of the plot (m2). The irrigation sheet per hectare applied in each rainfall event is shown in Table 2.
Table 2 Calculation of runoff according to the hydrographs recorded for each event during 2017.
| Avenue | Date of event | Precipitation (mm) | Volume (m3)y | Volume (m3)z | Runoff (cm·ha-1) |
|---|---|---|---|---|---|
| 1 | 13/07 | 14.8 | 52.60 | 45.02 | 0.52 |
| 2 | 17/07 | 10.3 | 25.56 | 22.56 | 0.25 |
| 3 | 30/07 | 17.7 | 45.09 | 41.77 | 0.45 |
| 4 | 18/08 | 13.9 | 75.53 | 69.15 | 0.75 |
| 5 | 28/09 | 15.5 | 167.05 | 158.31 | 1.67 |
| 6 | 29/09 | 47.8 | 424.37 | 404.4 | 4.24 |
| Total | 7.88 |
yVolume under the curve using the model values of each hydrograph (analytical approximation). zVolume obtained with the direct value in the quantification of voussoirs (indirect method).
Measurement of erosion processes and deposition of soil particles at the points of interest was carried out after the runoff events in each of the evaluated treatments. Measurements to estimate soil loss were carried out from July to September 2017, period in which the runoff events occurred. To measure the soil layer eroded or deposited on the surface reference layer, a similar method to the metodo de los clavos con rondanas (Anaya, 1991) was used, which consists of quantifying the movement of soil particles as erosion (mm) and deposition (mm) on a 0.20 x 0. 20 m metal plate (Figure 4).
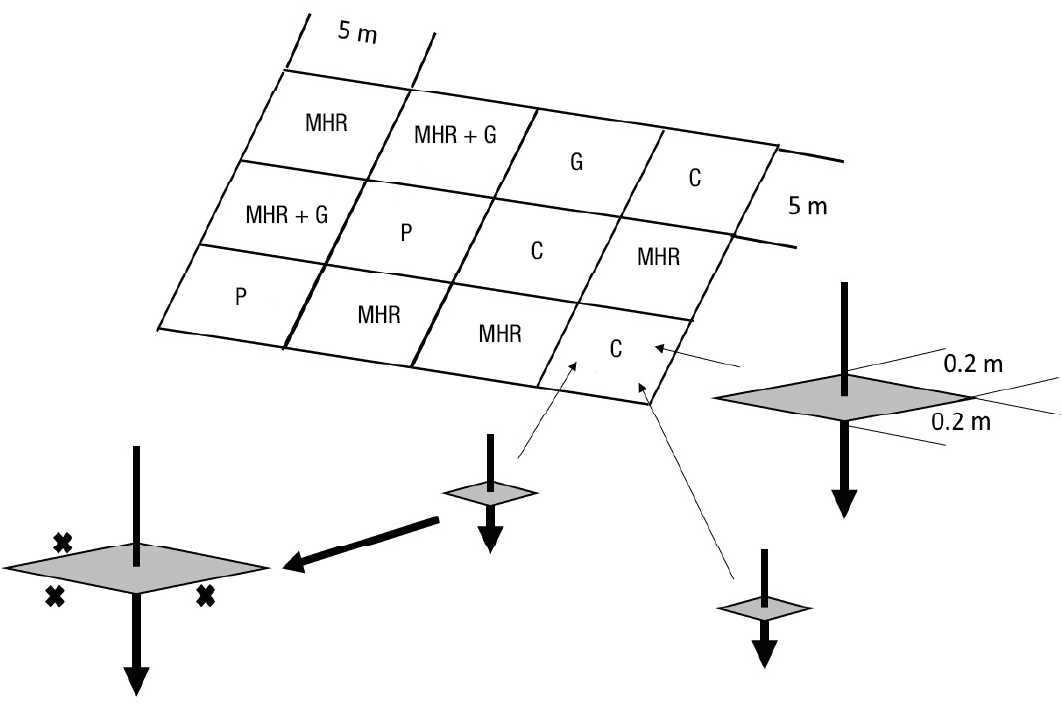
To obtain the magnitude of soil movement on three sides of the plate after a runoff event, the thickness of the eroded or deposited soil layer was measured. Three plates were placed randomly for each treatment. Erosion was measured in the small depression formed between the metal plate and the soil. To determine deposition, the height of soil accumulated or deposited on the metal plate was measured.
The conversion from mm to t·ha-1 of the thickness of the eroded layer of soil or deposited sediment was carried out with the following equation (Pizarro-Tapia & Cutiño-Martínez, 2002):
where Y is the eroded or sedimented soil (t·ha-1), X is the height of the eroded or sedimented soil (m), Da is the bulk density of the soil (t·m-3) and 10 is a constant according to the area of the plate. In the case of the experimental site, a Da of 1.3 t·m-3 was applied due to the characteristics of the soil profile.
Statistical analysis
The data obtained were analyzed using an ANOVA and Tukey's mean comparison (P ≤ 0.05), with the Statistical Analysis System (SAS, 1991). Furthermore, linear regression and Pearson correlation techniques were used to identify the relationship of variables.
Results and discussion
Precipitation
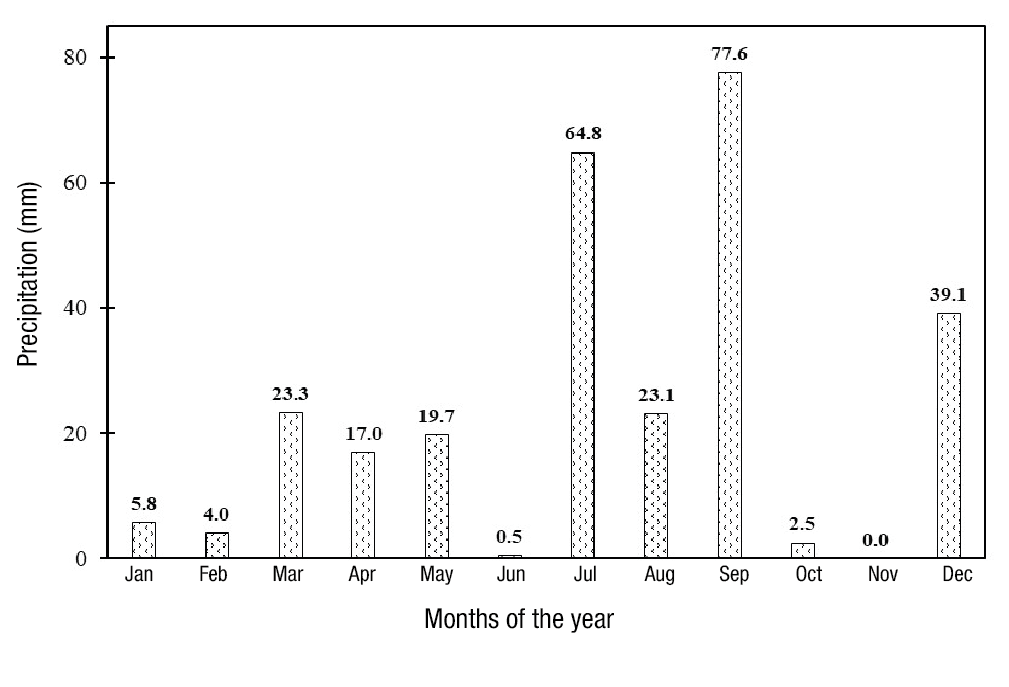
Precipitation in 2017 was 274.4 mm, which can be considered a regular rainfall year, since the historical annual average in the region is 304.8 mm (Medina-García et al., 2005). Rain was recorded practically throughout the year, except for June and November. The period with highest rainfall was from July to September, with a quarterly total of 165.5 mm (Figure 5). The above data coincide with the torrential nature of rainfall in the region, with the consequent risks of water erosion of soils (Velásquez-Valle et al., 2017).
Runoff
During the study period, six runoff events occurred. The highest runoff was recorded on September 21 and 28, 2017, with a water height in the channel of 20 and 44 cm, respectively. The rest of the events were less than 10 cm. Figure 6 shows the hydrographs recorded from the stream avenue gauging information. Table 2 shows the results of the calculation of the volume and runoff per event. The hydrographs show that the first two stream avenues that occurred in July were due to torrential rains with different intensities in the basin of origin of the runoff, while the rest of the runoff from the stream avenues was the result of individual high intensity storms.
Soil erosion and deposition
Soil erosion was significantly higher (P ≤ 0.05) when soil surface had no cover (control), with an estimated value of 58.6 t·ha-1 (Table 3). Soil cover with MHR + G significantly (P ≤ 0.05) reduced erosion, showing a value of 26.3 t·ha-1. These results confirm that the presence of crop residues on soil surface reduces flow velocity, which decreases particle removal (Ramos et al., 2016). Covering the soil with crop residues acts as a physical obstacle that decreases the velocity of runoff displacement and its critical sheer stress, in addition to favoring infiltration (Hillel, 1998). Treatments G and MHR had intermediate values to those mentioned above. Concerning the soil deposition process, statistical differences were found between the MHR + G and, G (with values of 47.6 and 51.7 t·ha-1, respectively), in relation to the control (26.1 t·ha-1) (Table 3).
Table 3 Average erosion, deposition, and net soil erosion by effect of different vegetation covers on degraded soils in Mapimí, Durango, Mexico (2017).
| Treatment | Eroded soil (t·ha-1) | Deposited soil (t·ha-1) | Net erosion* (t·ha-1) |
|---|---|---|---|
| MHR + G | 26.3 bz | 47.6 a | -21.2 |
| MHR | 37.3 ab | 33.4 ab | 3.8 |
| G | 44.0 ab | 51.7 a | -7.6 |
| C | 58.6 a | 26.1 b | 32.5 |
| Mean | 41.1 | 39.9 | 1.3 |
*Values obtained from the difference between erosion and sediment deposition. MHR + G = application of 10 t·ha-1 of maize harvested residues on the soil surface as well as the sowing of 10 kg ha-1 of buffelgrass seed; MHR = application of 10 t·ha-1 of maize harvested residues; G = sowing 10 kg·ha-1 of buffelgrass; C = control (no soil cover application). zMeans with the same letter within each column do not differ statistically (Tukey, P ≤ 0.05).
The net erosion obtained by the difference between erosion and deposition per treatment (Khanbilvardi & Rogowski, 1986) shows that, under the conditions in which the study was carried out, in the treatments with buffelgrass sowing there was a sediment trapping or deposition effect (Dadkhah & Gifford, 1980; Liu et al., 2018). Meanwhile, treatment MHR significantly reduced net erosion to 3.8 t·ha-1, while the control had a value of 32.5 t·ha-1 (Table 3).
Erosion-deposition process of soil particles
Figure 7 shows the behavior of the values of runoff and the thickness of the eroded and deposited soil layer for each treatment. The effectiveness of treatments evaluated to reduce or avoid the transport of soil particles (erosion) by overland flow is similar in all of them. In the case of soil particle detachment and transport, it is observed that at higher runoff (4.24 cm) the eroded soil layer is very similar in all treatments.
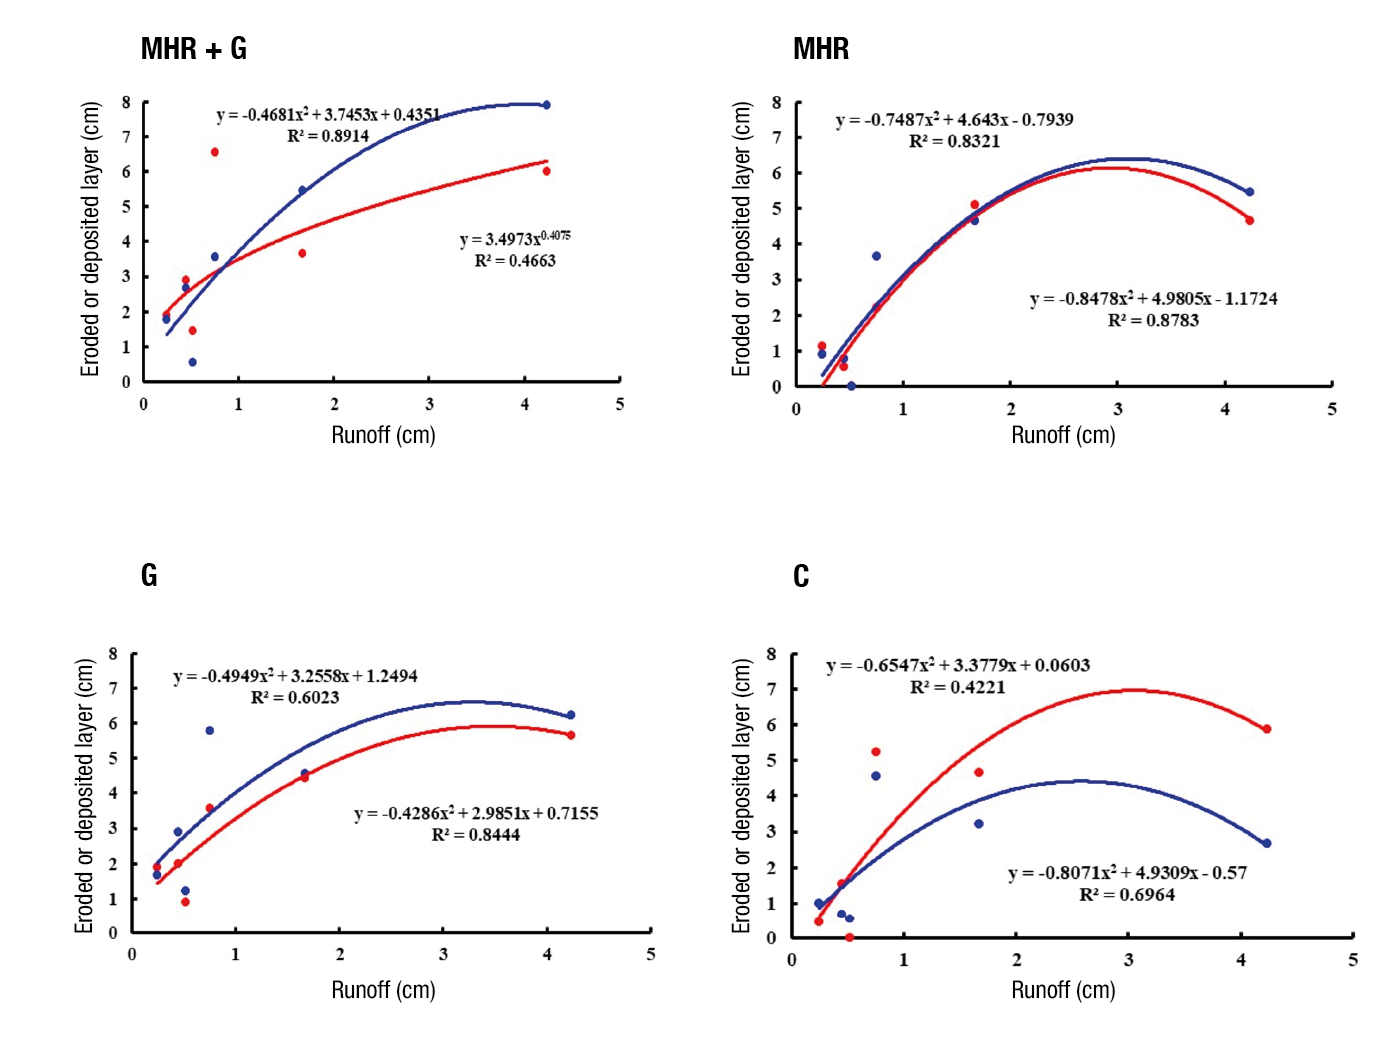
Figure 7 Relationship between runoff and thickness of eroded (red line) and deposited (blue line) soil layer with different soil cover treatments. MHR + G = application of 10 t·ha-1 of maize harvest residues on the soil surface as well as sowing 10 kg·ha-1 of buffel grass seed; MHR = application of 10 t·ha-1 of maize harvest residues; G = sowing 10 kg·ha-1 of buffel grass; C = control (no soil cover).
The results obtained with the MHR + G treatment suggest that the reduction of the eroded layer was due to a decrease in runoff velocity in the plots (Ramos et al., 2016). However, the control shows that from low runoff events (<1 cm of hydraulic load), the thickness of the eroded soil layer shows a trend of high values (>4.5 cm), which suggests that, under conditions of low vegetation cover, the occurrence of an overland flow on soil, however minimal, will cause detachment and transport of soil particles.
In the case of soil particle deposition, it is observed that at the maximum estimated runoff (4.24 cm) the thickness of the deposited layer ranges from one treatment to another (MHR + G = 7.9 cm, R = 5.4 cm, G = 6.2 cm and C = 2.7 cm) (Figure 7). It is observed that the best treatments for soil retention correspond to the sowing of grass and improves if combined with the application of plant cover such as maize stubble (G and MHR + G). This suggests that, with the use of this type of soil cover, a barrier is formed that affects velocity and critical shear stress of the flow, which determines the amount of soil particles in movement or transport (Hillel, 1998).
According to Figure 7, it can be observed that the greater the increase in the runoff, the greater the deposition of soil particles. This behavior is because at the point of measurement the sediment load is greater than the capacity to transport them, so deposition occurs (Lane & Nearing, 1989). In addition, the presence of grasses on the soil surface is a factor that acts as a physical barrier that prevents the dragging of soil particles to the lower parts of the soil.
O’Farrell et al. (2009) report that the management of vegetation on the soil surface influences hydrological processes such as increased infiltration, as well as decreased runoff and conservation of the soil. Martínez et al. (2017) indicate that, in small plots, the differences in runoff and sediment production, compared to long plots, are basically caused by the soil/vegetation ratio that exists within it, without considering the non-uniform patterns of soil areas without cover.
Therefore, in this type of studies, a multidisciplinary basic research approach is required to have a better understanding of the dynamic relationship between the factors and processes involved. In overland flow conditions, it is necessary to characterize soil, sediment (Le Bissonnais et al., 2004), vegetation, cover (Mankin et al., 2007; Martínez et al., 2017), depth, hydraulic radius and flow velocity (Ding & Li, 2016; Wang et al., 2018), as well as changes in micro-topography or surface roughness (Luo et al., 2020), to understand more precisely the temporal and spatial behavior of the sediment erosion-deposition process, and how each of these factors influences the detachment, transport and deposition of soil particles.
Conclusions
The calculation of the volume of concentrated flow in small irrigation ditches by the approximation method was adequate to obtain the runoff on a plot scale. Vegetative cover on soil surface either with grass established by sowing or by applying maize harvest residues reduced soil erosion by 44 % (26.3 t·ha-1), compared to the control (58.6 t·ha-1). In addition, the soil layer deposited in the aforementioned treatments showed a differential behavior between the thickness of the layer removed and the layer deposited under runoff conditions, which is important for decision making and validation of technologies based on the present results.

