


 texto en
  Inglés (pdf)
 Artículo en XML
 Referencias del artículo
 Enviar artículo por email
 Citado por SciELO
  Similares en
SciELO
Similares en
SciELO 
 Permalink
Introduction
Actual crop evapotranspiration is commonly estimated by considering reference evapotranspiration (ETo) and crop coefficient. The former can be evaluated using the Food and Agriculture Organization of the United Nations (FAO) manual 56, where the FAO-56 Penman Monteith (FAO-56 PM) method is the most used for accuracy under different climatic conditions and regions (Allen et al., 1998).
The FAO-56 PM method requires several meteorological input variables, which are usually not available at the required frequency and quality. Therefore, variants of that methodology have been proposed to estimate ETo, such as the use of alternative equations to estimate it with limited meteorological data (Jabloun & Sahli, 2008), the use of empirical models based on machine learning algorithms (Huang et al., 2019; Mattar, 2018), among others. However, an emerging alternative that eliminates the need for a robust network of weather stations is the use of reanalysis data or gridded weather data. These data are commonly available for free on web platforms or published in regular gridded formats (with a time-lag of days from the present) and can be used to obtain continuous data from a site or to fill geospatial gaps in weather data (Bai et al., 2010).
Reanalysis data are produced from the combination of measurement and simulation data using data assimilation techniques to obtain the most realistic description of climate occurrences. Reanalysis data have been used in applications where their performance, advantages and disadvantages are analyzed, such as in crop simulation models to estimate yields (Monteiro et al., 2018; Camargo-Rodriguez & Ober, 2019; Starr et al., 2020; Tyagi et al., 2019), ETo estimation (Martins et al., 2017; Paredes et al., 2018; Pelosi et al., 2020), irrigation scheduling, global warming assessment (Marzouk, 2021), among others.
Reanalysis data used to estimate ETo are mainly from NASA-POWER (NP), Global Land Data Assimilation System (GLDAS), Climate Forecast System ver. 2 (CFSv2), North American Land Data Assimilation System (NLDAS), Real-Time Mesoscale Analysis (RTMA), National Digital Forecast Database (NDFD) and gridMET. Of these, some have global coverage and others regional; the latter provide data with finer spatial and temporal resolution, although it should be noted that high spatial resolution does not necessarily indicate high accuracy (Blankenau et al., 2020).
The NP system is one of the most used systems for estimating ETo (Ndiaye et al., 2020; Negm et al., 2017; Srivastava et al., 2020) due to its frequent updating and near real-time data availability. Moreover, the data can be accessed automatically through the mobile or web applications (Maldonado et al., 2019).
In several studies, NP system data are used without prior local assessment (e.g. Ndiaye et al., 2020), because insufficient information is available. However, these data contain uncertainty; therefore, they must be evaluated and validated locally with available in situ measurements. Regarding the above, the objective of this study was to analyze, by means of four error parameters, the errors that can be generated by meteorological data and variables of the NP system to estimate ETo, using as reference data measured at seven meteorological stations.
Materials and methods
Study area
The study area was the area comprised by irrigation district 017 (DR 017) Comarca Lagunera and neighboring irrigation units (Figure 1). The predominant climate is classified as BWhw, corresponding to very arid, semiarid (Garcia, 2004). The Comarca Lagunera is one of the most important agricultural areas in Mexico, but with great water pressure.

Meteorological stations
To evaluate ETo estimation from climate data obtained from the NP system, daily data recorded at seven agrometeorological stations (Table 1) of the National Network of Automated Agrometeorological Stations of Instituto Nacional de Investigaciones Forestales, Agrícolas y Pecuarias (the INIFAP, 2020 ) standardized to 2 m were used. This network is operated by the National Laboratory of Modeling and Remote Sensing. Selected meteorological stations have daily records from 2005 to 2020 of the variables mean (Tmean), minimum (Tmin) and maximum (Tmax) temperature, mean wind speed (u 2 ), mean relative humidity (RH) and cumulative solar radiation (Rs).
Table 1 List of weather stations used in the study.
| No. | Name | Period with data (days) | Latitude (°) | Longitude (°) | Elevation (m a. s. l.) |
Last cumulative solar radiation data |
|---|---|---|---|---|---|---|
| 1 | La Purísima, San Luis de Cordero | 01/06/2006 - 25/06/2020 (5 138) | 25.38 | -104.20 | 1 409 | 28/02/2019 |
| 2 | Uruza, Mapimí | 18/11/2008 - 21/10/2015 (2 538) | 25.89 | -103.60 | 1 114 | 01/09/2015 |
| 3 | El Porvenir | 01/07/2005 - 20/06/2014 (3 276) | 25.78 | -103.31 | 1 108 | 19/06/2014 |
| 4 | Campo Experimental La Laguna | 01/10/2005 - 21/03/2019 (4 919) | 25.53 | -103.24 | 1 114 | 24/02/2019 |
| 5 | Las Mercedes | 01/07/2005 - 20/06/2014 (3 276) | 25.68 | -103.00 | 1 101 | 19/06/2014 |
| 6 | Empacadora de Melón | 01/11/2005 - 25/06/2020 (5 350) | 25.64 | -102.14 | 1 193 | 28/02/2019 |
| 7 | Santa Clara | 16/10/2006 - 25/06/2020 (5 001) | 24.47 | -103.37 | 1 810 | 28/02/2019 |
The accuracy of ETo estimates depends on the quality of the weather data used; therefore, a data quality control procedure is required. Allen (1996) describes different procedures to ensure the quality of weather input variables of ETo. This study analyzed the data used according to this author. Table 2 shows a summary of the quality control, and sensors measuring Rs and u 2 require continuous maintenance.
Table 2 Data quality control.
| Feature | Weather station number | ||||||
|---|---|---|---|---|---|---|---|
| 1 | 2 | 3 | 4 | 5 | 6 | 7 | |
| Number of days downloaded | 5 138 | 2 538 | 3 276 | 4 919 | 3 276 | 5 320 | 5 001 |
| Days analyzed | 3 653 | 1 545 | 1 529 | 2 660 | 2 596 | 4 115 | 2 423 |
| Days analyzed out of total (%) | 71 | 61 | 47 | 54 | 79 | 77 | 49 |
| Days with record of the five variables analyzed | 4 349 | 1 825 | 2 000 | 4 498 | 3 108 | 4 404 | 4 444 |
| Days without temperature record (T) | 157 | 542 | 70 | 53 | 103 | 358 | 45 |
| Days with no Rs records | 617 | 555 | 90 | 99 | 110 | 871 | 48 |
| Days with no RH records | 288 | 613 | 74 | 113 | 133 | 437 | 67 |
| Days with no u 2 records | 214 | 615 | 1 256 | 376 | 125 | 352 | 48 |
| Days with record u 2 < 0.5 m∙s-1 | 780 | 292 | 477 | 1 786 | 517 | 357 | 2 018 |
| Records with Tmin ≥ Tmax, Tmean ≥ Tmax and Tmin ≥ Tmean | 6 | 9 | 1 | 0 | 4 | 9 | 3 |
| Records with Rs/Rso > 1 | 2 | 5 | 2 | 20 | 25 | 31 | 48 |
Rs = cumulative solar radiation; RH = relative humidity; u 2 = average wind speed; Rso = solar radiation on a clear day calculated with the equation of Allen et al. (1998).
NASA-POWER (NP) system
The climate geoportal of the NP system (https://power.larc.nasa.gov) allows the extraction of values (from 1981 to date) of agroclimatological variables with global coverage. Table 3 shows the main features of the NP system database.
Table 3 Characteristics of the NASA-POWER (NP) system.
| Parameter | Characteristics |
|---|---|
| Data period | 1981 to date |
| Geographical coverage | Global |
| Download format | ASCII, CSV, GeoJSON and NetCDF |
| Temporal resolution | Daily |
| Spatial resolution | 0.5° × 0.5° (55.56 × 55.56 km cell) for temperature, relative humidity (RH) and wind speed (u 2 ) variables. 1.0° × 1.0° for solar radiation and extraterrestrial solar radiation (Rs) data. |
| Delay in data availability | Approximately 2 days for temperature, RH and u 2 variables, and 5 days for Rs data. |
The NP system collects information from several sources: directly measured data, satellite data, wind soundings and data derived from assimilated data systems. Daily temperature and RH data are derived from the Goddard Earth Observing System (GEOS) assimilation model version 4, 5.01 and 5.1, wind speed from the Modern Era Retrospective-Analysis for Research and Applications (MERRA-2) model, and solar radiation from satellite observations (White et al., 2008).
To conduct the study, data were downloaded from the NP system (Table 4) for the same period from the weather stations listed in Table 1. Cells with at least one agrometeorological station (Figure 1) were selected, i.e., data from 5 cells of 0.5 x 0.5° were downloaded.
Table 4 Agrometeorological variables from the NASA-POWER system used to estimate reference evapotranspiration.
| Symbol | Description | Unit |
|---|---|---|
| Tmax | Maximum air temperature at 2 m above the earth's surface. | °C |
| Tmin | Minimum air temperature at 2 m above the earth's surface. | °C |
| Tmean | Mean air temperature at 2 m above the earth's surface | °C |
| RH | Relative humidity at 2 m above the earth's surface | % |
| u 2 | Mean wind speed at 2 m above the earth's surface. | m∙s-1 |
| Toa_dnw (Ra) | Cumulative extraterrestrial radiation | MJ∙m-2∙d-1 |
| SFC_DWN (Rs) | Cumulative solar radiation | MJ∙m-2∙d-1 |
Reference evapotranspiration (ETo)
FAO 56 Penman-Monteith (PM) and Hargreaves and Samani (HS)
The estimate of ETo (mm∙d-1) with the FAO-56 PM method (Allen et al., 1998) is based on Equation 1. This method is recommended by the FAO for calculating ETo and is used to evaluate the accuracy of other methods.
where Rn is the net radiation at the reference crop surface (MJ∙m-2∙d-1), G is the soil heat flux (MJ∙m-2∙d-1), e s is the saturated vapor pressure (kPa), e a is the actual vapor pressure (kPa), e s - e a is the vapor pressure deficit (kPa), ∆ is the slope of the saturated vapor pressure curve (kPa∙°C-1) and γ is the psychrometric constant (kPa∙°C-1). For daily time intervals, the values of G are relatively small and, therefore, the term is neglected (Allen et al., 1998).
The HS equation (Hargreaves & Samani, 1985) is used to estimate ETo when only temperature data are available. This equation was developed for semi-arid areas and has good accuracy for the study area (e.g. Chávez-Ramírez et al., 2013).
where ET o-HS is the ETo estimated by the HS equation (mm·day-1), Ra is the cumulative extraterrestrial radiation (MJ∙m-2∙d-1), K H and K T are the empirical calibration parameters and A H is an empirical Hargreaves exponent. This study used the original values proposed by Hargreaves and Samani (1985): K H = 0.0023, K T = 17.8 and A H = 0.5.
Estimate of reference evapotranspiration (ETo)
ETo (daily and decadal average) was estimated in five different ways; each case used a method for estimating ETo (FAO-56 PM or HS) and a different meteorological data source (measured at agrometeorological stations, NP data or combination of both) (Table 5). The FAO-56 PM method with data measured from agrometeorological stations (MEDEST) was used to calculate the observed ETo. This ETo was used to evaluate the performance of the five proposed cases. Evaluation is based on the FAO-56 PM method being the most reliable for different regions (Allen et al., 2000).
Table 5 Cases analyzed to estimate reference evapotranspiration (ETo).
| Cases | ETo method | Data set | Symbology |
|---|---|---|---|
| Observed | FAO-56 PM | Measured at meteorological stations (MEDEST) | Observed ETo |
| Case 1 (C1) | FAO-56 PM | NASA-POWER (NP) System | PMNP |
| Case 2 (C2) | Hargreaves and Samani (HS) | MEDEST | HSEM |
| Case 3 (C3) | HS | NP | HSNP |
| Case 4 (C4) | FAO-56 PM | Wind speed data (u 2 ) measured at MEDEST and the rest of NP. | PM NP + u2 |
| Case 5 (C5) | FAO-56 PM | NP solar radiation (Rs) data and the rest of the data measured in the MEDEST. | PM EM + RS(NP) |
Cases C1 and C3 were proposed to know the accuracy of ETo with NP reanalysis data. C2 arises to compare the yield of the HS equation in the area using MEDEST data. In C4 and C5, different data sources (MEDEST and NP) are mixed with the FAO-56 PM method. C4 was proposed because u 2 of NP is the variable with the lowest R2 in validation performed by developers (Stackhouse et al., 2019), while C5 was proposed because it is common to have poor quality and quantity of Rs data in meteorological stations (Sayago et al., 2020).
Accuracy evaluation
First, the precision of the variables (Tmax, Tmin, Tmean, u 2 , RH and Rs) was evaluated by comparing the estimated data from the NP system to the measured data. The accuracy assessment was performed with four statistical parameters: root mean square error (RMSE, Equation 3), mean error (ME, Equation 4), standard deviation of errors (SDE, Equation 5) and coefficient of determination (R2, Equation 6) (Cobaner et al., 2017; Jabloun & Sahli, 2008).
where V o is the measured or observed value, V e is the estimated value (in this case those extracted from the NP system), i is the day analyzed and n is the number of values or days analyzed.
Subsequently, the precision of the ETo of cases C1-C5 was evaluated (Table 4) using the same four statistical parameters, where V o is the observed ETo and V e is the value of the ETo estimated with cases C1 to C5.
Sensitivity analysis of variables
A sensitivity analysis is essential to evaluate the impact of input variables on ETo estimate with the FAO-56 PM equation. This analysis was performed according to the following approach: a systematic error was introduced to the value of a given climate parameter (temperature, RH, u 2 or Rs) and the other values were kept constant; then, ETo was estimated with the FAO-56 PM method and ME and RMSE values of change in ETo were calculated. Induced errors were within a range (Table 6) and were defined considering the maximum value of RMSE found in the evaluation of the precision of each variable, plus an increment of 5 %; that is, if a variable had a maximum RMSE of 5, then the range established would be ±5 with an increment of 0.5 in that range.
Results and discussion
Assessment of variables
Temperature
The temperature data (Tmin, Tmean and Tmax) of the NP system, compared to those measured, had an R2 of 0.84 to 0.95 and RMSE values lower than 4 °C. The lowest R2 (0.84 to 0.90) and highest RMSE values (1.95 to 3.67 °C) were found for Tmin, while the highest R2 (0.92 to 0.95) and lowest RMSE values (1.29 to 2.16 °C) were for Tmean (Figure 2). These results agree with those found by other authors, where higher R2 and lower RMSE are reported with Tmean. Negm et al. (2017) compared data from the NP system against 42 agrometeorological stations in Sicily, Italy, located from 10 to 1 470 m a. s. l., and found lower average RMSE values with Tmean (RMSE = 3.2 °C) and higher with Tmin (RMSE = 5 °C). In the United States, White et al. (2008) had higher correlations with Tmean (R2 = 0.91) and reported an average R2 of 0.88 for Tmin and Tmax; thereby concluding that if mountainous and coastal regions are excluded, the NP system is a reliable data source for daily temperature. In Egypt, Aboelkhair et al. (2019) found higher R2 for Tmean.

Figure 2 a) Box-and-axis plot of precision statistical parameters for temperature and b) mean temperature difference (estimated - measured) plot. R2 = coefficient of determination; ME = mean error; RMSE = root mean square error; SDE = standard deviation of errors; T = temperature.
Regarding SDE, average values of 2.32, 1.46 and 1.76 °C were found for Tmin, Tmean and Tmax, respectively (Figure 2a). This indicates greater variation between Tmin from NP and measured data.
Tmean and Tmax from NP data tend to underestimate the measured data, because ME values < 0 °C were found (Figure 2a). This agrees with that reported by Stackhouse et al. (2019), who validated measured data in several countries and found ME values < 0 for Tmean and Tmax, and positive values for Tmin. For Tmean, higher underestimates were found in the winter-spring months, while for Tmax lower underestimates were observed in the spring months (Figure 2b).
Regarding Tmin, the ME found are in the range of -1.1 to 2.34 °C. In general, at low values (Tmin < 10 °C), the NP system data overestimated measurements, and at higher values it was underestimated (Figure 3). This indicates that the maximum overestimation occurs mainly in the autumn-winter months (Figure 2b), where temperatures drop in the region. Bai et al. (2010) reported an underestimation of NP data for air temperature (Tmax and Tmin) in China, where the underestimation was higher for Tmax.
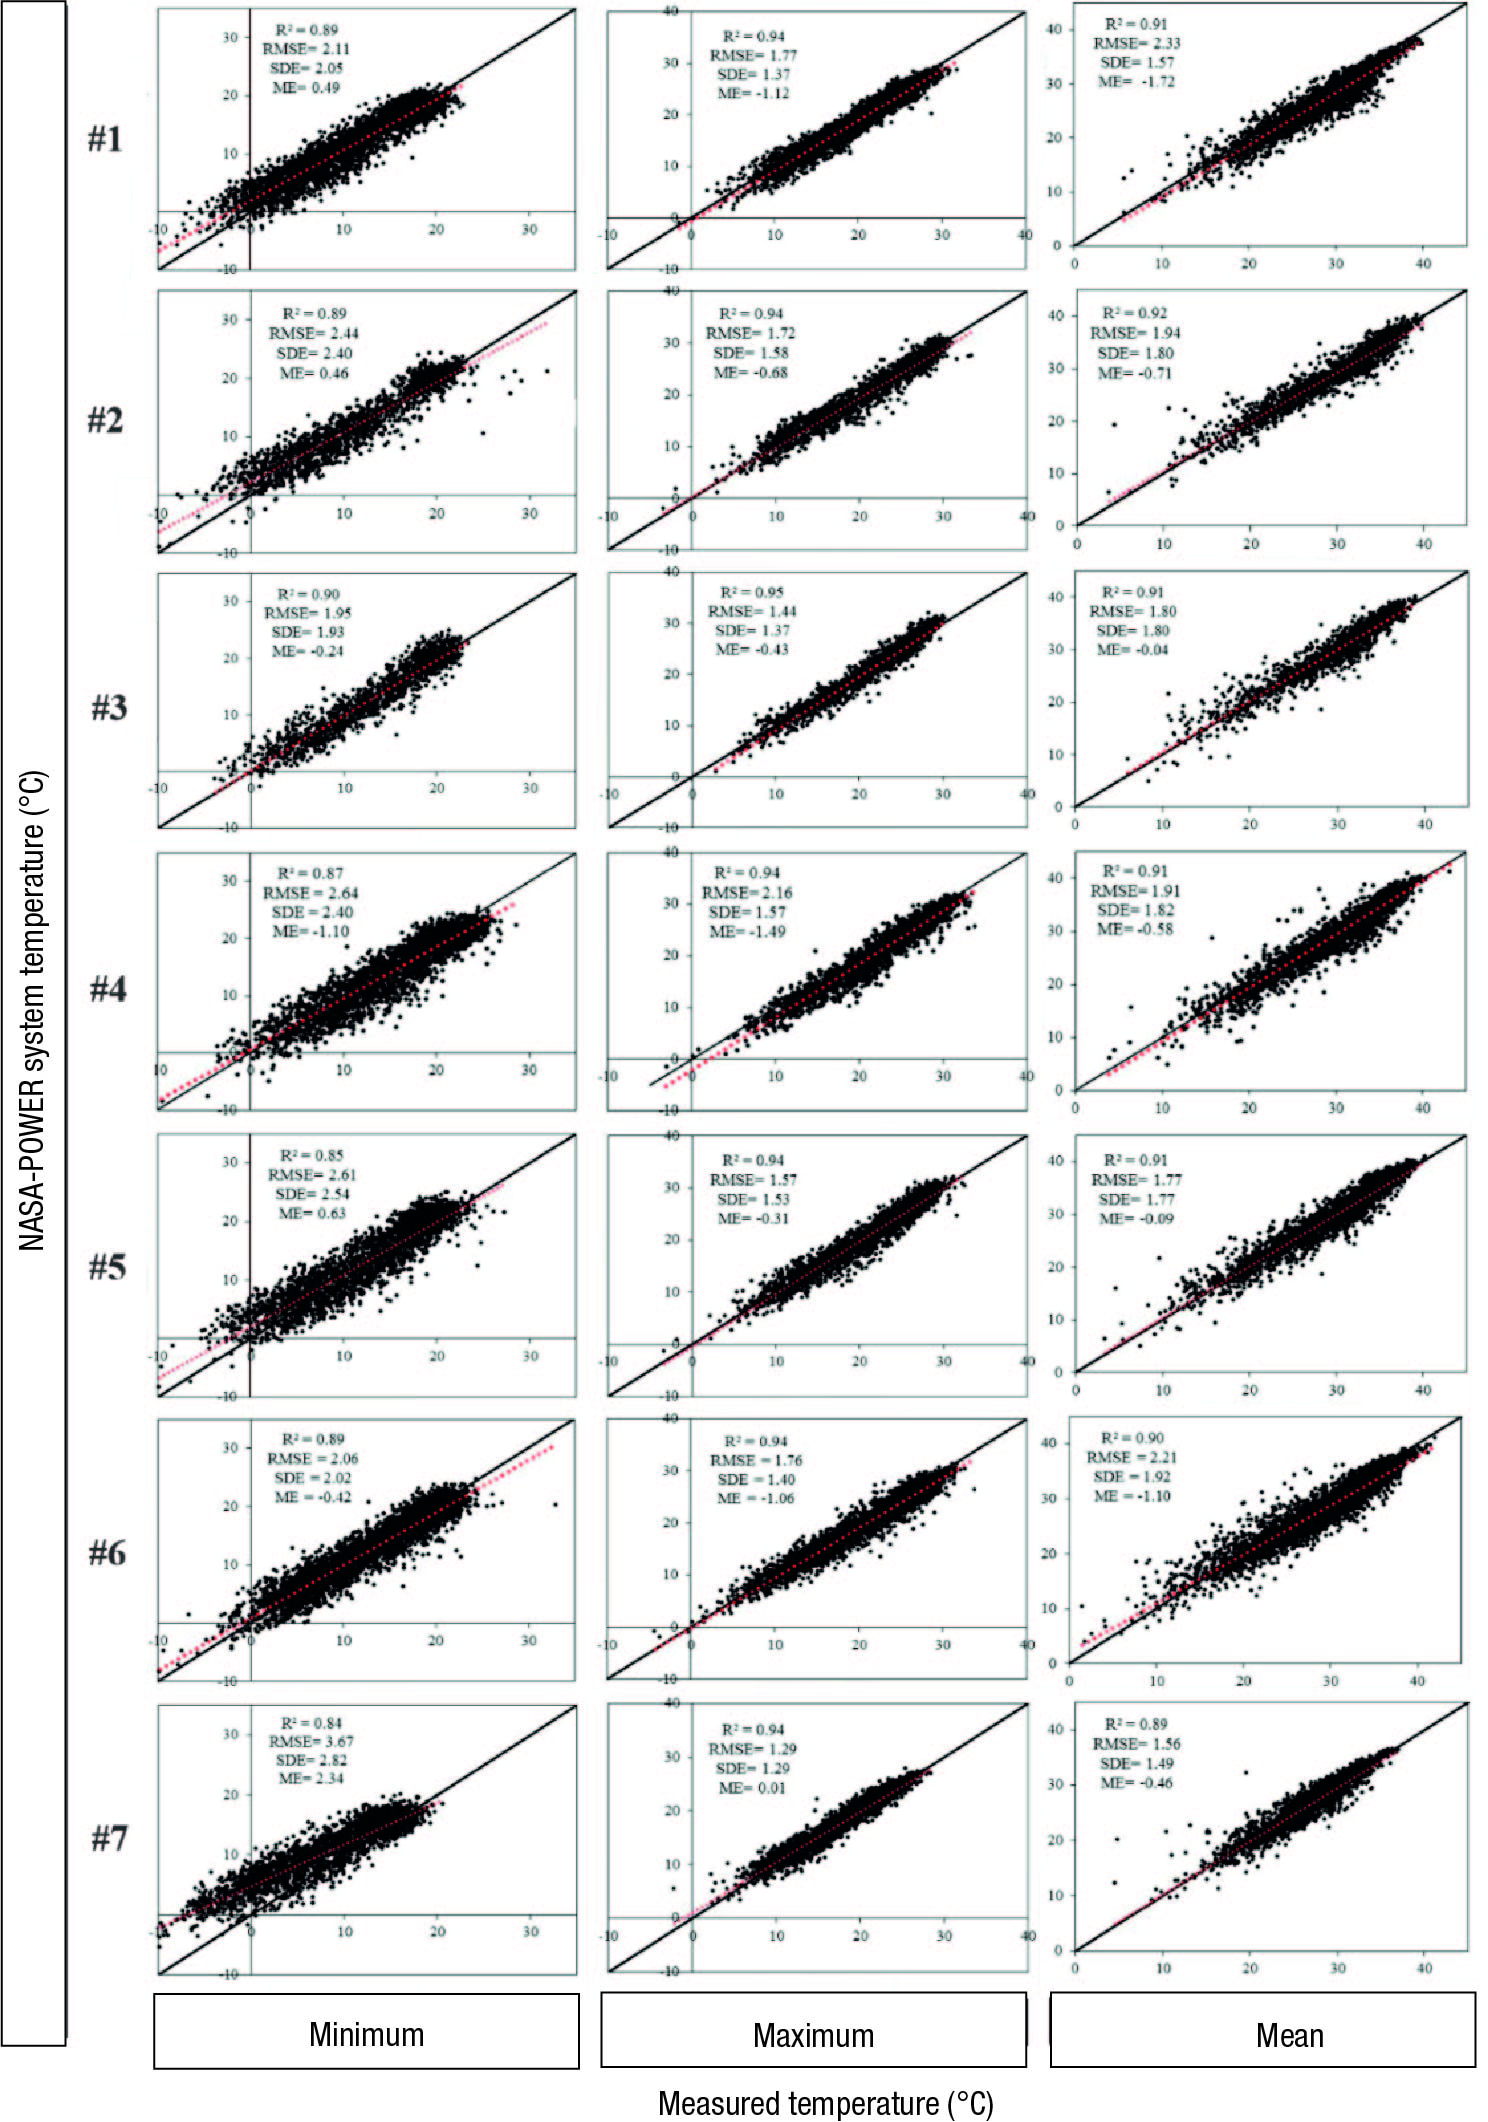
Figure 3 Minimum, mean and maximum temperature accuracy assessment per station. The number indicates the station. R2 = coefficient of determination; RMSE = root mean square error; SDE = standard deviation of the errors; ME = mean error.
According to the results, there are differences between the measured data and those estimated by NP, which are not constant throughout the year. Among the factors that may account for variability of the data are topography, changes in land use or localized effects that may be sources of errors in assimilation models (White et al., 2008). In this sense, Negm et al. (2018) describe a methodology to improve accuracy of NP data considering the Julian day and site topography.
Relative humidity
R2 values from 0.60 to 0.76, ME from -0.32 to -7.52%, RMSE from 8.83 to 12.16 % and SDE from 8.18 to 10.38 were found (Figure 4 a). Negm et al. (2017) had RMSE from 8 to 18 and indicate that coastal areas have higher RMSE values than inland areas. RMSE values found in this study are < 13 % because stations are in inland areas. In Egypt, Aboelkhair et al. (2019) had RMSE values from 4.2 to 31.8 %; moreover, they found that NP data underestimated the measured RH (ME < 0) at all stations, as found in this study and in that conducted by Rodrigues and Braga (2021). This underestimation is greater in the winter-spring months (Figure 4b), and according to Figure 5, the higher the RH, the greater the underestimation.

Figure 4 a) Box-and-axis plot of precision statistical parameters for relative humidity and b) mean relative humidity difference (estimated - measured) plot. R2 = coefficient of determination; ME = mean error; RMSE = root mean square error; SDE = standard deviation of errors.

Wind speed (u 2 )
The u 2 of the NP system was the variable with the lowest R2 values (0.19 to 0.52). This behavior is also reported by Duarte and Sentelhas (2020), Najmaddin et al. (2017), and Rodrigues and Braga (2021). De Pondeca et al. (2011) indicate there are many challenges in u 2 determination, such as quality control of the measured data, so improving the quality could provide more accurate estimates.
NP system data tend to overestimate the measured u 2 values at all stations, as positive ME values of up to 1.43 m∙s-1 were found (Figure 6a). These overestimates are higher in the months of June to September (Figure 6b). RMSE values of 0.92 to 1.63 m∙s-1 and SDE of 0.67 to 1.01 m∙s-1 were found (Figure 6a). Stackhouse et al. (2019), in a global-level evaluation of the NP system, report average RMSE values of 1.65 m∙s-1 and positive ME values. Higher RMSE values (1.3 to 3.5 m∙s-1) were reported by Negm et al. (2017). RMSE values found in the present study are within the range reported by these authors.

Figure 6 a) Box-and-axis plot of precision statistical parameters for wind speed and b) mean wind speed difference (estimated - measured) plot. R2 = coefficient of determination; ME = mean error; RMSE = root mean square error; SDE = standard deviation of the errors.
A relationship was found between error parameters and latitude of stations. The highest values of ME (>1.19) and RMSE (>1.40) were found at the southernmost stations (#1, #4 and #7), and the lowest values (ME = 0.53 and RMSE = 0.92) were found at the station located at the highest latitude (#2) (Figure 1). Stations #1, #4 and #7 had more noticeable overestimation of u 2 (Figure 7), while in the rest of the stations, at high u 2 (> 3 m∙s-1) a tendency to underestimation is observed.

Solar radiation
R2 values from 0.72 to 0.88 were found, where five stations were in the range of 0.81 to 0.84. Station #3 had an R2 lower than 0.80, in addition to having the highest RMSE value (Figure 8a). R2 values found coincide with those reported by other authors. In the United States, R2 values from 0.76 to 0.97 have been reported (White et al., 2011), and in Spain, R2 values from 0.85 to 0.96 (Sayago et al., 2020).

Figure 8 a) Box-and-axis plot of precision statistical parameters for solar radiation and b) mean solar radiation difference (estimated - measured) plot. R2 = coefficient of determination; RMSE = root mean square error; SDE = standard deviation of errors; ME = mean error.
Regarding RMSE, values from 2.73 to 3.41 MJ∙m-2∙d-1 were found (Figure 8). These values agree with those of Negm et al. (2017), who had values from 2.0 to 4.8 MJ∙m-2∙d-1, and those of Bai et al. (2010), with RMSE values of 3.1 MJ∙m-2∙d-1. NP Rs data tend to underestimate the measured values. Only station #2 had a ME > 0 MJ∙m-2∙d-1. According to Figure 8b, mean differences are higher in the months from May to October, which corresponds with the rainy season (Comisión Nacional del Agua [CONAGUA], 2020). According to Sayago et al. (2020), the accuracy of NP Rs data depends on atmospheric conditions, because they found on clear days an R2 of 0.96 and an RMSE of 1.78 MJ∙m-2∙d-1, concluding that these estimators are deficient on cloudy days.
Figure 9 shows that the larger the Rs value, the NP data tend to underestimate, and the smaller the Rs (< 20 MJ∙m-2∙d-1), NP data tend to overestimate.

Sensitivity analysis of variables
Figure 10 shows the values of ME and RMSE of ETo when errors were introduced in the values of climatic variables; each variable shows a different impact on ETo accuracy. Negative errors induced in Tmean and RH show an overestimation of observed ETo (ME > 0 mm∙d-1), and positive errors in Tmax, Tmin, u 2 and Rs resulted in an overestimation of ETo (Figure 10a). Similar behaviors to those shown in Figure 10 have been found in studies conducted in different regions when sensitivity analysis is performed (Biazar et al., 2019; Debnath et al., 2015; Ndiaye et al., 2017).

Figure 10 Reference evapotranspiration (ETo) estimation based on variations induced to measured values. a) mean error (ME) and b) root mean square error (RMSE). Tmin = minimum temperature; Tmean = mean temperature; Tmax = maximum temperature; RH = relative humidity; u 2 = wind speed; Rs = solar radiation.
Induced errors to u 2 indicate that this variable produces the largest values of ME and RMSE associated with ETo (Figure 10). A difference, compared to the measured value, of +0.5 m∙s-1 can generate an overestimation in ETo of up to 0.4 mm∙d-1, while a difference of +2 m∙s-1 can generate an overestimation of 1.5 mm∙d-1. These results show high sensitivity of ETo to u 2 , which has been reported by Debnath et al. (2015), and Tabari and Hosseinzadeh (2014) in arid and semiarid regions. Debnath et al. (2015) indicate that in such regions wind flow probably replaces moist air with dry air very rapidly, which causes an increase in ETo compared to other regions.
Considering the RMSE values (Figure 10b), Tmax has, in general, the second largest influence on ETo estimate, followed by Rs, Tmean, Tmin and RH. Table 7 shows RMSE values derived from ETo estimate when values with some errors are introduced. These errors are considering the maximum RMSE values found in the evaluation of precision of NP variables.
Table 7 Root mean square error (RMSE) when estimating reference evapotranspiration (ETo) with modified climate values from the NASA-POWER (NP) system.
| Variable | Behavior with measured data | Maximum RMSE | ETo sensitivity (mm∙d-1) |
|---|---|---|---|
| Tmin | Underestimates and overestimates | 3.67 °C | Difference of 3.67 °C in comparison to measured data leads to an overestimation of ETo of 0.18 (RMSE). Difference of -3.67 °C leads to an underestimation of ETo of 0.18. |
| Tmedia | Underestimates | 2.16 °C | Difference of -2.16 °C leads to and overestimation of ETo of 0.17. |
| Tmax | Underestimates | 2.33 °C | Difference of -2.33 °C leads to and underestimation of ETo of 0.28. |
| RH | Underestimates | 12.16 % | Difference of -10.87 % leads to an overestimation of ETo of up to 0.22. |
| u 2 | Overestimates | 1.63 m∙s-1 | Difference of +1.63 m∙s-1 leads to an overestimation of ETo of 1.26. |
| Rs | Underestimates | 3.41 MJ∙ m-2∙d-1 | Difference of -3.41 leads to an underestimation of ETo of up to 0.37. |
T = temperature; Rs = cumulative solar radiation; RH = relative humidity; u 2 = mean wind speed.
According to Table 7, even though the maximum RMSE of RH of the NP system is 12.16 %, this variable can generate a difference in ETo of 0.22 mm∙d-1, which is less than that produced by the maximum RMSE of Tmax, Rs and u 2 . Of these variables, the only one that can generate a difference greater than 0.5 mm∙d-1 compared to the ETo observed is u 2 ; therefore, it is suggested that this be measured directly in situ.
Performance for reference evapotranspiration (ETo) estimation
Figure 11 shows mean difference (mm∙d-1) between estimated ETo and observed ETo, and C1 overestimates the observed ETo over the entire year. The magnitude of overestimation is related to the precision of each variable and has been reported when only NP data and the FAO-56 PM method are employed (Maldonado et al., 2019; Negm et al., 2017; Srivastava et al., 2020). The largest mean C1 differences occur in the spring months because this is when NP data underestimate Tmean and RH by the greatest magnitude, coupled with the overestimation of u 2 (Figure 11). Summer months show the smallest differences, and coincide with the highest u 2 , overestimates, so we would expect to find the highest ETo overestimates; however, they also coincide with Tmax underestimates and the highest Rs underestimates.

C2 shows underestimates in summer, while overestimates occur in spring and autumn. C3 is influenced by the behavior of C2 and accuracy of NP in temperature variables. C3 tends to underestimate ETo from winter to summer and overestimates in autumn. C4 shows overestimates in the first four months of the year, which may be due to the underestimation of Tmean and RH data; however, the rest of the year shows a tendency to overestimation, which is where the impact of Rs and T max data of the NP system is manifested. As expected, C5 shows the same behavior as Figure 8b, because only the NP Rs value was used.
Concerning decadal average ETo (Figure 11b), the same behaviors of Figure 11a are observed; however, mean differences decrease when ETo is analyzed on a decadal basis. In other studies, it has been observed that when using reanalysis data, accuracy improves when using 10-day average values compared to daily data (Monteiro et al., 2018).
When decadal mean ETo was analyzed (Figure 12), higher R2 values were found (greater than 0.84) than with daily data; SDE and RMSE values decreased. This indicates a better accuracy of ETo when using decadal mean values of the NP system.

Figure 12 Evaluation of daily and decadal reference evapotranspiration (ETo) using statistical parameters. R2 = coefficient of determination; ME = mean error; RMSE = root mean square error; SDE = standard deviation of the errors.
For daily ETo with C1, RMSE values from 0.99 to 1.36 were found, and for decadal mean ETo, from 0.63 to 1.02 mm∙d-1. Errors of daily ETo of 0.68 to 1.27 mm∙d-1 have been reported by Negm et al. (2017), who indicate that for most stations the observed ETo is overestimated. Maldonado et al. (2019), with measured data from agrometeorological stations located in different countries at different altitudes, reported RMSE values from 0.31 to 1.45 mm∙d-1. Although NP data overestimate ETo with values close to 1 mm∙d-1, they had R2 values higher than 0.73, indicating that bias correction strategies can be employed as proposed by Rodrigues and Braga (2021).
C2 tends to underestimate ETo for values > 5 mm∙d-1, while, for lower values, it overestimates it. With daily ETo values, an RMSE of 0.75 to 1.06 mm∙d-1 was obtained, while with decadal averages, values of 0.46 to 0.69 mm∙d-1 were found (Table 8). These values are lower than those found in C1; however, with daily values C1 shows higher R2.
Table 8 Values of estimators associated with reference evapotranspiration (ETo) in five case studies.
| Estimator | Case | La Purísima | Uruza, Mapimí | El Porvenir | Campo experimental La Laguna | Rancho Las Mercedes | Empacadora de Melón | Santa Clara | Mean | |
|---|---|---|---|---|---|---|---|---|---|---|
| R 2 | C1 | D | 0.78 | 0.83 | 0.73 | 0.77 | 0.74 | 0.79 | 0.83 | 0.78 |
| E | 0.90 | 0.95 | 0.87 | 0.84 | 0.88 | 0.90 | 0.92 | 0.89 | ||
| C2 | D | 0.83 | 0.81 | 0.72 | 0.69 | 0.68 | 0.72 | 0.73 | 0.74 | |
| E | 0.95 | 0.94 | 0.90 | 0.87 | 0.92 | 0.89 | 0.89 | 0.91 | ||
| C3 | D | 0.79 | 0.80 | 0.73 | 0.73 | 0.72 | 0.75 | 0.71 | 0.75 | |
| E | 0.94 | 0.94 | 0.90 | 0.90 | 0.92 | 0.93 | 0.88 | 0.92 | ||
| C4 | D | 0.94 | 0.94 | 0.91 | 0.93 | 0.93 | 0.92 | 0.94 | 0.93 | |
| E | 0.98 | 0.97 | 0.93 | 0.96 | 0.96 | 0.97 | 0.98 | 0.96 | ||
| C5 | D | 0.96 | 0.97 | 0.95 | 0.96 | 0.97 | 0.97 | 0.97 | 0.96 | |
| E | 0.98 | 0.99 | 0.95 | 0.97 | 0.98 | 0.99 | 0.99 | 0.98 | ||
| RMSE | C1 | D | 1.08 | 1.11 | 1.20 | 1.36 | 1.12 | 0.99 | 1.18 | 1.15 |
| E | 0.83 | 0.85 | 0.88 | 1.18 | 0.79 | 0.70 | 1.02 | 0.89 | ||
| C2 | D | 0.75 | 0.82 | 0.91 | 0.95 | 1.02 | 1.06 | 0.84 | 0.91 | |
| E | 0.50 | 0.48 | 0.47 | 0.50 | 0.46 | 0.69 | 0.48 | 0.51 | ||
| C3 | D | 0.73 | 0.81 | 0.90 | 0.88 | 0.96 | 1.12 | 0.87 | 0.90 | |
| E | 0.34 | 0.41 | 0.46 | 0.44 | 0.47 | 0.78 | 0.49 | 0.49 | ||
| C4 | D | 0.48 | 0.51 | 0.53 | 0.49 | 0.48 | 0.54 | 0.39 | 0.49 | |
| E | 0.38 | 0.37 | 0.40 | 0.37 | 0.30 | 0.33 | 0.23 | 0.34 | ||
| C5 | D | 0.38 | 0.35 | 0.43 | 0.36 | 0.38 | 0.33 | 0.35 | 0.37 | |
| E | 0.29 | 0.28 | 0.38 | 0.29 | 0.31 | 0.22 | 0.27 | 0.29 | ||
| ME | C1 | D | 0.67 | 0.74 | 0.67 | 0.99 | 0.50 | 0.41 | 0.92 | 0.70 |
| E | 0.67 | 0.74 | 0.65 | 1.00 | 0.51 | 0.41 | 0.91 | 0.70 | ||
| C2 | D | 0.37 | 0.26 | -0.01 | 0.13 | -0.11 | -0.38 | 0.16 | 0.06 | |
| E | 0.37 | 0.27 | -0.03 | 0.11 | -0.12 | -0.38 | 0.16 | 0.06 | ||
| C3 | D | -0.07 | 0.04 | -0.00 | 0.08 | - 0.21 | -0.61 | -0.13 | -0.13 | |
| E | -0.07 | 0.05 | -0.02 | 0.08 | -0.22 | -0.60 | -0.13 | -0.13 | ||
| C4 | D | -0.30 | 0.24 | -0.07 | -0.21 | - 0.08 | -0.13 | -0.13 | -0.10 | |
| E | -0.30 | 0.23 | -0.08 | -0.24 | -0.08 | -0.13 | -0.12 | -0.10 | ||
| C5 | D | -0.20 | 0.18 | -0.16 | -0.14 | - 0.21 | -0.13 | -0.22 | -0.13 | |
| E | -0.20 | 0.18 | -0.17 | -0.17 | -0.21 | -0.13 | -0.22 | -0.13 | ||
| SDE | C1 | D | 0.84 | 0.82 | 1.00 | 0.93 | 1.00 | 0.90 | 0.73 | 0.89 |
| E | 0.49 | 0.42 | 0.60 | 0.63 | 0.61 | 0.56 | 0.44 | 0.54 | ||
| C2 | D | 0.66 | 0.78 | 0.91 | 0.95 | 1.01 | 0.99 | 0.83 | 0.88 | |
| E | 0.34 | 0.40 | 0.47 | 0.49 | 0.44 | 0.57 | 0.45 | 0.45 | ||
| C3 | D | 0.73 | 0.81 | 0.90 | 0.88 | 0.94 | 0.94 | 0.87 | 0.87 | |
| E | 0.33 | 0.41 | 0.46 | 0.44 | 0.42 | 0.49 | 0.48 | 0.43 | ||
| C4 | D | 0.38 | 0.45 | 0.52 | 0.44 | 0.47 | 0.52 | 0.37 | 0.45 | |
| E | 0.22 | 0.30 | 0.40 | 0.28 | 0.29 | 0.30 | 0.20 | 0.28 | ||
| C5 | D | 0.32 | 0.30 | 0.40 | 0.34 | 0.31 | 0.31 | 0.27 | 0.32 | |
| E | 0.20 | 0.22 | 0.34 | 0.24 | 0.23 | 0.18 | 0.16 | 0.22 |
R2 = coefficient of determination; RMSE = root mean square error; ME = mean error; SDE = standard deviation of errors; D = daily; E = decadal mean.
C3 shows similar values of error parameters as C2 due to high precision of NP temperature data. RMSE and SDE values in C3 are lower than in C1 for daily and decadal ETo. Najmaddin et al. (2017) note that when using reanalysis data in an arid zone, lower RMSE values are found with the HS method than with the FAO-56 PM method; this may be due to the precision of NP u 2 and the high sensitivity of ETo to this variable. Therefore, for the study area, when there are no measured data, it is recommended to use the NP data with the HS method (C3), and not with the PM method (C1), and preferably to estimate values of decadal mean ETo.
The highest R2 values and lowest RMSEs were found in C4 and C5 for both daily and decadal ETo. This indicates that NP data, except for u 2 , can be used as an option to fill geospatial gaps in meteorological data to estimate ETo. Comparing both cases, in the case of C5, we found R2 > 0.95, and RMSE values < 0.43 mm∙d-1 for daily ETo and < 0.38 mm∙d-1 for decadal mean ETo. On the other hand, in the case of C4, we observed R2 > 0.91 and RMSE < 0.53 mm∙d-1 for daily ETo, and R2 > 0.93 and RMSE < 0.40 mm∙d-1 for decadal mean ETo (Table 8). The above indicates greater accuracy is obtained with C5, where only NP Rs data were used. This makes sense, since more NP variables are used in C4, including Rs, which show some error compared to measured data. The difference in RMSE of C4, compared to C1, shows the effect that u 2 has on that of ETo.
Conclusions
Reanalysis data can be an important tool for areas with no information to estimate ETo or when this information is incomplete because it facilitates access to values of various meteorological variables of interest, such as temperature, relative humidity, wind speed and solar radiation. However, before using the data, it should be validated using values measured in the area, so that accuracy provided by data set can be quantified and alternatives for bias correction can be sought. Often, measured data are not available to make an evaluation; therefore, an alternative is to compare several reanalysis data sets and select those with the same behaviors, although there are not many well-documented studies available in the literature on this subject.
Of the five cases analyzed, those that combine measured data and NP system data with the FAO-56 PM method (C4 and C5) had the lowest RMSE and highest R2 values. This indicates that both cases can be used for the study area and estimate ETo with high accuracy. These cases are valid when measured variables are available in the area of interest. When measured data are not available, it is convenient to estimate ETo with HS equation and temperature data from the NP system, as discussed in C3.
Results indicate that the NP system data (except for wind speed) can be used as an option to complete missing data for ETo estimation, or in other applications, such as estimating growing degree days, due to high R2 values obtained in the evaluation of temperature.

