


 texto en
  Inglés (pdf)
 Artículo en XML
 Referencias del artículo
 Enviar artículo por email
 Citado por SciELO
  Similares en
SciELO
Similares en
SciELO 
 Permalink
Introduction
In recent years, climate has shown changes in weather patterns as a result of global warming (Intergovernmental Panel on Climate Change [IPCC], 2019). Climate change phenomenon is aggravated by anthropogenic activities and modification of the natural environment; these climate changes and anomalies have been pronounced mostly in recent decades (Boru et al., 2019; IPCC, 2014). In this sense, the global average temperature increase by the end of the 21st century is expected to be 1.7 °C in the scenario with lower emissions, or 4.8 °C in the scenario with higher emissions. Also, the projection of precipitation shows important changes in distribution patterns, so that meteorological phenomena with greater intensity and frequency are expected (IPCC, 2014).
With the increase in temperature and precipitation, a considerable increase in flow is predicted in the Yaqui River basin, which could lead to flooding during the wet season and prolonged droughts during the dry season (Sánchez-Cohen et al., 2020). This basin has experienced an increase in population pressure and consumptive use; in addition, poor management and unequal distribution of water has made this resource increasingly scarce and inaccessible (Mounir et al., 2019; Padilla-Calderón, 2017). This represents a threat to water security and poses challenges to achieve sustainability of human activities, mainly from the agri-food industry that sustains the Yaqui River basin (Chen et al., 2019; López-Feldman & Hernández-Cortes, 2016).
The northeastern region of Mexico, where the Yaqui River basin is located, has stressful natural conditions for crop production. The problem of aridity becomes more critical due to climate change, erratic weather behavior, and land use change (Flores-Ortiz, 2016). Such conditions require accurate modeling scenarios due to the vulnerability of the agricultural sector towards water resources, which defines the productive potential of cultivated species (Sánchez-Cohen et al., 2013). In this context, when considering the watershed as the base unit for planning production chains, it is necessary to characterize its hydrological aspect.
These conditions require accurate modeling scenarios due to the vulnerability of the agricultural sector to water resources, which defines the productive potential of cultivated species (Sánchez-Cohen et al., 2013). In this context, when considering the basin as the base unit for planning production chains, it is necessary to characterize the hydrological aspect of the basin (Sánchez-Cohen et al., 2015).
Hydrological models are powerful tools to simulate the effect of processes and to plan water resources to meet their different consumptive uses and ecological needs (Gholami et al., 2016). One option for managing and planning a basin is to use the Soil and Water Assessment Tool (SWAT), which is a semi-distributed process-based hydrological model. SWAT is a powerful tool, worldwide, that assesses the effects of soil and water management at the sub-watershed level (Arnold et al., 2012; Gassman et al., 2007; Luo et al., 2011). This tool was designed to incorporate numerical and vector input data, which allows the analysis of hydrological processes at a large spatial scale (de Oliveira-Serrão et al., 2019). Its processing is also based on a continuous time scale, allowing land cover and climate changes in the simulations (Arnold et al., 1998).
Montecelos-Zamora et al. (2018) and Velázquez-Zapata et al. (2017) used SWAT in different basins in Mexico to study and predict the impacts of anthropogenic disturbances and climate change on the availability of water resources. The aim of this research was to model and analyze the behavior of surface runoff in the Yaqui river basin under climate change scenarios using SWAT.
Materials and methods
Study area
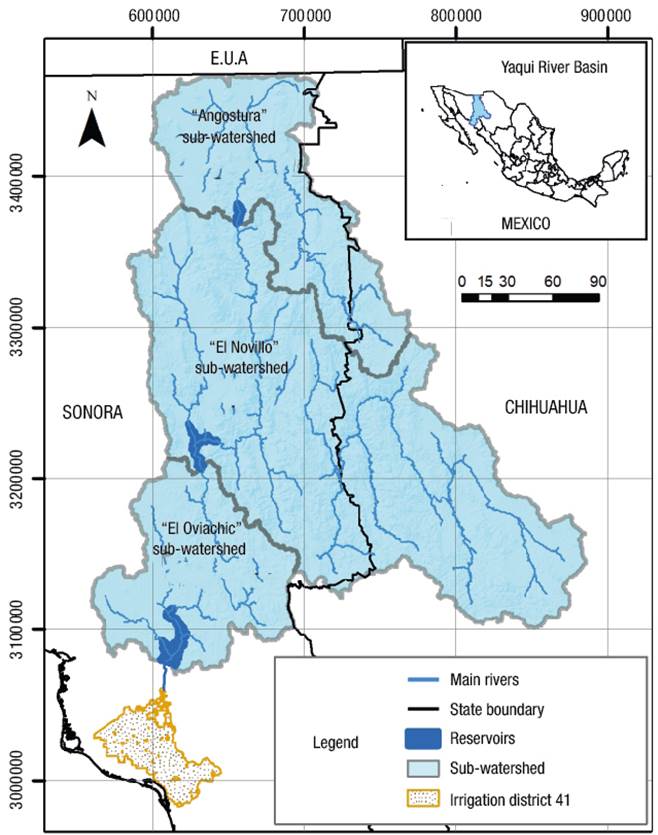
The Yaqui River basin, which covers an area of 65 024 km2, belongs to the hydrological region number 9 and is located in the central area of the state of Sonora, Mexico. This basin drains the Yaqui River, considered the largest river in northwestern Mexico (Comisión Nacional del Agua [CONAGUA], 2018). The Yaqui River originates in southern Arizona, USA, and flows into the Pacific Ocean forming a coastal delta that is exploited as an agricultural area in different municipalities of southern Sonora, which is known today as “Valle del Yaqui” (Enríquez-Licón & Lorenzana-Durán, 2017; Padilla-Calderón, 2017).
Based on daily composites of the CLICOM system of the Centro de Investigación Científica y de Educación Superior de Ensenada (CICESE), the basin was divided into 12 quadrants and a history of 32 years of meteorological data (1972-2003) was reported. Cumulative precipitation was 609 mm, from June to October were the months that contributed the most to this parameter (75 %) (Figure 1). Mean annual temperature was 16.8 °C, with a maximum of 33 °C (May to September) and a minimum of 0 °C (December to February) (CICESE, 2020), so the climate can be considered semi-arid to arid (Mounir et al., 2019).

The Yaqui River basin is divided into three hydrological sub-watersheds (Figure 2), which represent catchment areas of the reservoirs Lázaro Cárdenas “La Angostura” (13 956 km2), Plutarco Elías Calles “El Novillo” (39 499 km2) and Álvaro Obregón “El Oviachic” (11 569 km2) (Mounir et al., 2019). Surface runoff of each sub-watershed was modeled in this study.
Processing input values
The Soil and Water Assessment Tool (SWAT), developed by Arnold et al. (1998) and Neitsch et al. (2011) was used for the hydrological modeling of the Yaqui river basin, where the simulated variable was surface runoff, and the time scale of information was monthly. Figure 3 describes in detail the process carried out, which addresses aspects of the model input values, calibration, validation, and climate change scenarios.

Arnold et al. (2012) report the different data that feed the SWAT hydrologic model to perform the simulation (Table 1), so it is necessary to have an order and reference in terms of their scale, coordinates, and units of measurement.
Table 1 Input data for hydrologic modeling using SWAT in the Yaqui River basin.
| Data | Site | Information available | Source |
|---|---|---|---|
| Digital elevation model | Yaqui river | 2019 | INEGI (2019) |
| Edaphology | Yaqui river | 1995 | INIFAP-CONABIO (1995) |
| Land use and vegetation | Yaqui river | 2016 | INEGI (2016) |
| Climate data | 12 stations | 1970 -2003 | CICESE (2020) |
| Runoff data measured | 3 stations | 1964 - 2018 | CONAGUA (2018) |
INEGI = Instituto Nacional de Estadística y Geografía; CONABIO = Comisión Nacional para el Conocimiento y Uso de la Biodiversidad; CICESE = Centro de Investigación Científica y de Educación Superior de Ensenada; CONAGUA = Comisión Nacional del Agua.
Model application and parameterization
The QSWAT 2.0 interface of the free QGIS 2.6.1 program was used in this study, in which the application and parameterization of the hydrological model was performed. The input values were processed according to the size of the Yaqui river basin from an official polygon provided by CONAGUA, with the coordinate system Datum WGS84, UTM zone 12 projection. The program determined the drainage network and the sub-watersheds that make up the hydrographic basin. An outlet point was established at each dam, since each one regulates upstream runoff. At the same time, hydrologic response units (HRU) were created for each sub-watershed, which were homogeneous in terms of physical characteristics (soil type, vegetation, and topography). In this context, each HRU had different variables in its matrix that influenced the modeling (Luo et al., 2011).
When parameterizing the model, it is necessary to indicate the simulation period. In this case, a 34-year meteorological data set (1970-2003) was used, which was reported daily and used for the Warm up period (1970-1971), calibration (1972-1993) and validation (1994-2003). The Warm up period is necessary at the beginning of the model, since the model tends to show great uncertainty because initial simulation conditions are unknown (Daggupati et al., 2015).
Calibration and validation
Calibration consists of estimating parameters of a hydrological model and comparing the simulated data against the data measured (Moriasi et al., 2007). For this purpose, the SWAT-CUP 2019 program (Calibration and Uncertainty Program) was used and the automated calibration protocol recommended by Abbaspour et al. (2015) and Arnold et al. (2012) was followed. That protocol mentioned that parameterization is an important step in the calibration model and should be based on knowledge of hydrological processes and variability of soil type, land use, slope, and location of the sub-watershed. The Sequential Uncertainty Fitting (SUFI2) algorithm was selected to fit the modeling parameters based on the availability of values related to water balance modeling (Gholami et al., 2016). For each sub-watershed, 1 500 simulations were run, which were divided into three iteration periods (500 simulations each) and parameters were manually recalibrated after each iteration (Montecelos-Zamora et al., 2018).
The sensitivity parameters used in the calibration process (Table 2) represent the surface runoff processes in the hydrological sub-watershed (Niraula et al., 2015; Niraula et al., 2012; Norman et al., 2019; Norman & Niraula, 2016; Veith et al., 2010).
Table 2 Calibration parameters for surface runoff.
| Parameter | Parameter description | Unit | Calibration ranges | Fitted value | ||||
|---|---|---|---|---|---|---|---|---|
| Min. | Max. | La Angostura | El Novillo | El Oviachic | ||||
| CH_K2.rte | Effective hydraulic conductivity in the main channel | mm·h-1 | 0.01 | 500 | 260.108 | 181.115 | 182.424 | |
| CN2.mgt | Curve number value | - | 35 | 98 | 73 | 77 | 66 | |
| SURLAG.bsn | Runoff surface in time delay | days | 0.05 | 24 | 9.065 | 5.325 | 1.758 | |
| ESCO.hru | Soil evaporation compensation factor | - | 0 | 0.95 | 0.313 | 0.95 | 0.673 | |
| SOL_AWC.sol | Available water capacity in the soil layer | mm | 0 | 1 | 0.303 | 0.193 | 0.320 | |
| GW_REVAP.gw | Groundwater renewal coefficient | - | 0.02 | 0.2 | 0.199 | 0.110 | 0.023 | |
| GWQMN.gw | Depth threshold of water in the surficial aquifer | mm | 0 | 1000 | 149.982 | 78.433 | 23.180 | |
| ALPHA_BF.gw | Baseflow alpha factor | days | 0.048 | .95 | 0.048 | 0.544 | 0.048 | |
| GW_DELAY.gw | Groundwater retardation | days | 0 | 31 | 8.709 | 8.421 | 26.585 | |
| RCHRG_DP.gw | Percolation fraction of deep aquifers | - | 0 | 1 | 0.568 | 0.435 | 0.111 | |
Model evaluation
To evaluate the performance of the hydrological model, statistical methods used in hydrological applications are implemented to obtain the degree of similarity between the measured and generated data. In the present study, the coefficient of determination (R2) was used, which describes the proportion of variance between the measured and simulated data. R2 varies from 0 to 1, and values greater than 0.5 are considered acceptable (Arnold et al., 2012). The Pearson's correlation coefficient (r) shows variations from 0 to 1 (Equation 1), where 0 indicates no correlation and 1 represents a perfect correlation (Abbaspour et al., 2015; Arnold et al., 2012; Moriasi et al., 2007).
where Q obs is the measured flow (m3·s-1), Q sim is the simulated flow (m3·s-1), Q obs,m is the mean of the measured flow (m3·s-1) and Q sim,m is the mean of the simulated flow (m3·s-1).
We also evaluated the Nash-Suttcliffe efficiency coefficient (NSE), which varies from -∞ to 1. Values between 0 and 1 indicate a good prediction by the model of the measured values (Nash & Sutcliffe, 1970). Moriasi et al. (2007) classify the NSE as follows: < 0.2 insufficient, 0.2 - 0.4 satisfactory, 0.4 - 0.6 good, 0.6 - 0.8 very good and > 0.8 excellent (Equation 2).
As a last statistical indicator, the percentage bias (PBIAS) was considered as a quantitative measure (Gupta et al., 1999), which evaluates whether the values simulated by the model were higher or lower than the values measured at the gauging point (Equation 3). The optimum value is 0, and values close to this represent simulations with minimal errors in the mass balance; a positive value of PBIAS indicates that the model is underestimating the measured values, while a negative value indicates that the model overestimates that measured at the gauging point (Abbaspour et al., 2015; Moriasi et al., 2007).
The performance of the model was also verified from a linear regression graph and an identity function (1:1). For this purpose, the simulated flow was compared against the measured flow in the calibration and validation periods, placing the identity line as a reference to observe the trend of the dispersion points.
Climate change scenarios and model configuration
With the purpose to force the SWAT model against climate change scenarios, projections were generated using the LARS-WG 6.0 interface, which incorporates predictions from 18 global climate models from the CMIP5 ensemble used in the IPCC fifth assessment report (Semenov & Stratonovitch, 2010; Semenov & Stratonovitch, 2015). In addition, the HadGEM2-ES model (Hadley Center Global Environment Model ver. 2) was used to project representative concentration trajectories over three time periods: 2021-2040, 2041-2060 and 2061-2080 (RCP 2.6, RCP 4.5 and RCP 8.5, respectively) (IPCC, 2014). These climate change scenarios used as input the temperature and precipitation for the SWAT model, previously calibrated and validated, and the simulation of the surface runoff of the Yaqui River in future time periods.
Results and discussion
Calibration and validation
The results reported in the three sub-watersheds (La Angostura, El Novillo and El Oviachic) show that the statistical performance parameters, for model calibration and validation, are in acceptable ranges (> 0.5); this is in accordance with the criteria established by Abbaspour et al. (2015) and Moriasi et al. (2007). Thus, the statistical parameters prove that there is a good relationship between the measured and simulated flow after fitting the most sensitive parameters of the model (Arnold et al., 2012). In relation to the evaluation of the hydrological model, Table 3 show the results recorded according to the calibration and validation period.
Table 3 Performance of the hydrologic model according to the calibration and validation period in the three sub-watersheds.
| r | R2 | NSE | PBIAS | |
|---|---|---|---|---|
| La Angostura | ||||
| Calibration | 0.85 | 0.72 | 0.69 | -19.85 |
| Validation | 0.75 | 0.43 | 0.55 | -0.54 |
| El Novillo | ||||
| Calibration | 0.8 | 0.63 | 0.59 | -28.3 |
| Validation | 0.71 | 0.53 | 0.41 | -20.3 |
| El Oviachic | ||||
| Calibration | 0.7 | 0.48 | 0.03 | -37.8 |
| Validation | 0.53 | 0.32 | -0.09 | -32.9 |
r = Pearson correlation coefficient; R2 = coefficient of determination; NSE = Nash-Suttcliffe efficiency coefficient; PBIAS = percentage bias.
As shown in Figure 4, the calibration and validation hydrographs for the three sub-watersheds show that the measured flow is slightly above the simulated estimates, although in some events the opposite is true. Fontes and Montenegro (2019) point out that these differences are a result of the main precipitation events that precede the surface runoff impulses. This is because basins with arid regimes are intermittent in the wet months and usually have ephemeral flow events in the dry months when there is no runoff.
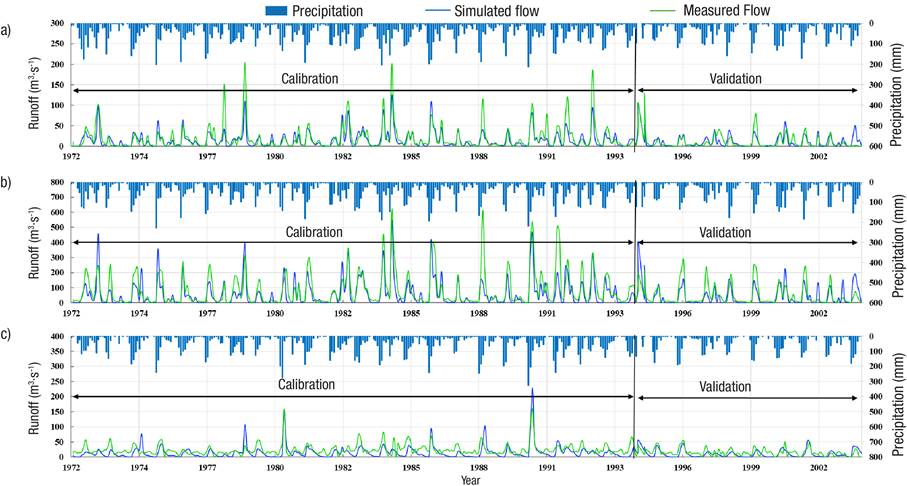
Figure 4 Measured vs simulated runoff by SWAT for the calibration and validation of three sub-watersheds: a) Angostura, b) El Novillo and c) El Oviachic.
As seen in Figure 5a and 5b, the regression line is below the identity line, which verifies that the model underestimates the data measured in the La Angostura and El Novillo sub-watersheds. On the other hand, the regression line in El Oviachic is above the identity line, which shows that the model overestimates the data measured in both periods (Figure 5c). This figure also shows that the SWAT model tends to be more precise in small flows than in large flows (greater than 20 m3-s-1), therefore the lower dispersion in smaller flows.
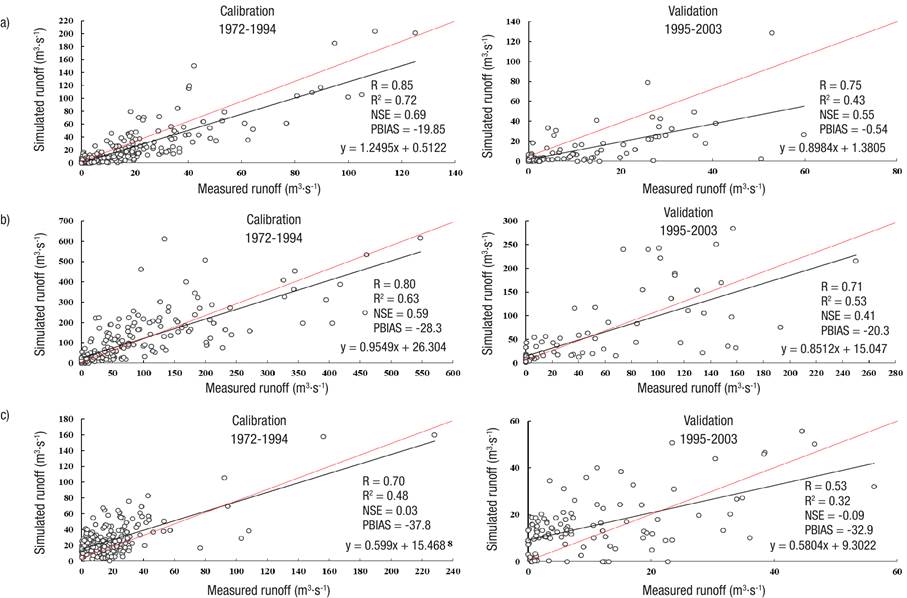
Figure 5 Scaled plot showing the measured and simulated flow for calibration and validation: a) La Angostura, b) El Novillo and c) El Oviachic.
It is evident that during some years in the simulation with SWAT some extreme phenomena (droughts and floods) occurred in the sub-watershed, so the model showed a poor simulation response. In this sense, de Oliveira-Serrão et al. (2019) mention that the model does not accurately reproduce some flow periods, mainly those resulting from atypical phenomena.
Climate change scenarios
For La Angostura, surface runoff and precipitation maintained a linear relationship (Figure 6a): R2 = 0.80 (RCP 2.6), R2 = 0.73 (RCP 4.5) and R2 = 0.66 (RCP 8.5), with a decrease in the RCP 8.5 scenario. For El Novillo, R2 values were 0.78, 0.79 and 0.73, for RCP 2.6, RCP 4.5 and RCP 8.5, respectively, showing a reduction in surface runoff at the last level (Figure 6b). Finally, for El Oviachic, R2 values of 0.69, 0.68 and 0.65 were reported for RCP 2.6, RCP 4.5 and RCP 8.5, respectively, showing a decrease in scenario 8.5 (Figure 6c).

Percentage of change in surface runoff
Changes in surface runoff were reported in the three sub-watersheds studied. For La Angostura, considering the annual average, the negative change with the greatest impact was -67 % for the period 2021-2040 (RCP 2.6), and an increase of 60 % is expected during the period 2041-2060 (RCP 8.5). For El Novillo an average annual decrease of up to -65 % is predicted for the period 2061-2080 (RCP 4.5) and an increase of 42 % during the period 2061-2080 (RCP 2.6), and for El Oviachic a decrease in flow of -63 % is expected for the period 2041-2060 (RCP 2.6 and 4.5) and an increase of 47 % in the period 2041-2060 (RCP 2.6 and 4.5).
These results contrast with those reported by Boru et al. (2019) when identifying a percentage change in Nile River flow of -24.3 to 49.5 % in the period 2021-2040, and -29 to 20 % in the period 2081-2100 for RCP 4.5 scenarios. In the same study, the projected change in flow was -18 to 31.9 % in the period 2021-2040 and -33 to 22.3 % in the period 2081-2100 for RCP 8.5.
As shown in Table 4, in the three sub-watersheds the percentage decrease in flow was greater than the increase in flow, so a longer dry period is expected, mainly for El Oviachic, followed by La Angostura and El Novillo (Sánchez-Cohen et al., 2020). Chen et al. (2017) mention that the frequency of occurrence and strength of droughts in the dry season will increase due to global warming, while floods in the wet season tend to increase. Specifically in the reservoirs of the Yaqui River basin, it is important to consider the total volume runoff in the three sub-watersheds, since the irrigation district makes interbasin transfers to provide water to irrigation district number 41 and the Yaqui colonies downstream of the dams. The dams also provide water for power generation.
Table 4 Annual percent change in total runoff availability in the three sub-watersheds under RCP scenarios. Percentages reflect the impact of the climate change scenario on average runoff.
| Period | RCP | La Angostura | El Novillo | El Oviachic | |||||
|---|---|---|---|---|---|---|---|---|---|
| - | + | - | + | - | + | ||||
| 2021-2040 | 2.6 | 45 | 45 | 32 | 35 | 53 | 28 | ||
| 4.5 | 67 | 47 | 49 | 40 | 55 | 30 | |||
| 8.5 | 49 | 40 | 24 | 40 | 56 | 22 | |||
| 2041-2060 | 2.6 | 51 | 54 | 41 | 39 | 63 | 23 | ||
| 4.5 | 57 | 53 | 46 | 40 | 63 | 47 | |||
| 8.5 | 57 | 60 | 52 | 34 | 46 | 34 | |||
| 2061-2080 | 2.6 | 49 | 45 | 28 | 42 | 59 | 19 | ||
| 4.5 | 64 | 56 | 65 | 34 | 56 | 29 | |||
| 8.5 | 61 | 51 | 53 | 39 | 61 | 16 | |||
A negative sign (-) indicates a decrease in runoff and a positive sign (+) indicates an increase in runoff.
Regarding the representativeness of the model to the physical environment, the SWAT model in Mexico has been used in some basins as a management decision tool. Cruz-Arévalo et al. (2021) used this model in the Chapingo river basin to evaluate the impact of land use on runoff. The results of these authors show the need to have measured data of the physical environment variables for an adequate calibration. Furthermore, Torres-Benites et al. (2004) calibrated the SWAT model in a basin in Estado de México (El Tejocote) to evaluate its predictive capacity and concluded that the model underestimated runoff by 18 % and sediment by 38 %. Other studies report that the SWAT model underestimates the slope factor in sub-watersheds when this value is greater than 25 % (Rivera-Toral et al., 2012).
Several studies are in agreement with the results of the present analysis. Chang et al. (2017) report similar changes in runoff in a watershed in China, where different climate scenarios and their variations in precipitation were evaluated. In the Alpine regions, Braun et al. (2020) studied the effect of changing runoff patterns caused by increasing temperatures and observed different scenarios on runoff production.
The use of the SWAT model to predict the possible impacts produced by climate change against water resources has been recommended as a support for decision making in different parts of the world (Abbaspour et al., 2015). Therefore, it is considered an important tool for predicting possible future scenarios in the Yaqui River basin.
Conclusions
It was possible to implement the SWAT hydrologic model to identify future changes in surface runoff of the Yaqui River basin. Based on the statistical indicators, the predictive capacity of the model is considered to be good and satisfactory. The scenario with the greatest impact for the La Angostura sub-watershed was RCP 8.5 (period 2041-2060), with a change from -57 to 60 %. For El Novillo, the greatest change occurred in RCP 4.5 (period 2061-2080), with changes from -65 to 34 %, while for El Oviachic the greatest change in runoff was reported in RCP 4.5 (period 2041-2060) with -63 and 47 %.
The SWAT model provides an effective means to evaluate the hydrology of the Yaqui River basin spatially and temporally. Specially, it allows knowing the variability of the surface runoff on which the large reservoirs that contain the water resource for irrigation district 41 depend. To improve the reliability of the proposed model, it is recommended to use punctual meteorological data measured in situ, because the CLICOM tool in Mesh considers a general average of the area covered by the quadrant within the basin. Daily records from hydrometric stations can also be considered, which will provide more accurate knowledge of runoff behavior over shorter periods of time.
According to the results, it is recommended that in the calibration process the range of data proposed by the SWAT-CUP tool be verified to be in values that really represent the physical environment. Otherwise, it is recommended that this process be carried out manually by entering the tables generated by the model and making the pertinent changes in the most sensitive parameters (curve number and hydraulic conductivity, mainly). This process can be carried out for specific areas or for the entire basin.
It was found that hydrological-climatic modeling offers a good option for analyzing what could happen to hydrological variables against variations in climate patterns. The use of IPCC climate change projections represents the baseline for comparisons with hydrological situations in basins. The advantage of using climate scenarios is that it is possible to design impact mitigation strategies.
With the data collected, adaptation and mitigation strategies can be generated to improve the efficient use of water in the basin and to propose sustainable management alternatives for land use and vegetation in the long term. Other studies also show the impacts that changes in climate patterns have on runoff production; in addition, they suggest the need for higher quality measured data for calibration processes, which suggests continuous and quality hydrological monitoring.

