


 texto en
  Inglés (pdf)
 Artículo en XML
 Referencias del artículo
 Enviar artículo por email
 Citado por SciELO
  Similares en
SciELO
Similares en
SciELO 
 Permalink
Introduction
As energy shortages and the ecological crisis become more severe, the development and use of new forms of energy are imminent, pointing to the use of solar energy as an important alternative (Wang, Yang, Cheng, Guan, & Yan, 2018). In recent decades, solar energy has become increasingly popular in many industrial applications, as an alternative to generate electricity (Lewis, 2007), chemicals (Steinfeld, 2005) or heating (Panwar, Kaushik, & Kothari, 2011). Many industrial processes require the use of heating and, with few exceptions such as the generation of steam from sugar cane bagasse in sugar mills (Debernardi-de la Vequia, Ortiz-Laurel, & Rosas-Calleja, 2016), the industry uses fossil fuels or electricity for these types of services (Elimelech & Phillip, 2011). At the household level, it is increasingly common to use solar energy collection systems to obtain hot water, although with less demanding requirements, since the target temperature in the fluid is normally less than 40 °C. Because of this, important efforts are being made to collect radiant energy, through concentrators, and to store it (Xu et al., 2015).
In recent years, it has been shown that the use of radiant energy can be improved by using solid particles of different particle size (Fang et al., 2013; Neumann et al., 2013; Ni et al., 2015). It has even been observed that the particles do not require a strictly metallic base, since Chinese ink incorporated into the system has been used to generate steam using solar energy (Wang et al., 2018). Until now, studies have focused simply on the temperature variation in a receiving fluid, but there is no study that allows the simulation of systems based on heat transfer coefficients. In this context, this study was carried out with the objective of evaluating the effect of the incorporation of solid particles in the process fluid of a compound parabolic collector (CPC) on its operating capacity.
Materials and methods
Compound parabolic collector (CPC)
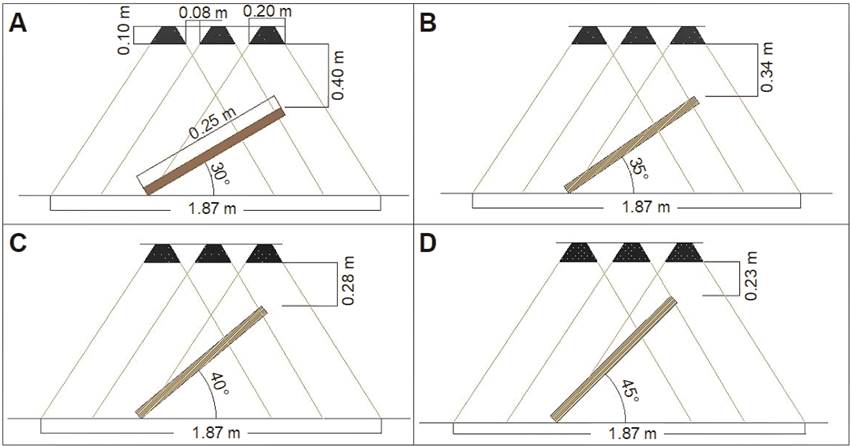
A radiant energy collection system was built based on the geometry of a CPC (Figure 1), which had a vessel for mixing water with particle suspensions (TK-001), from which a tubular distribution vessel (TK-004B) and three radiant energy collector pipes (TC-005) were fed. In order to facilitate the collection of energy, a metallic involute was installed along the length of each tube, and the distribution tube was connected to two containers for the storage of process fluid (TK-002) and steam condensate (TK-003). The temperature was recorded with type J thermocouples (TE-101) (ARPISA, Mexico) at three points inside the collector pipes and the use of a data acquisition system (AD-001). The collector pipes were positioned so that they could be rotated at angles of 30, 35, 40 and 45° in relation to the soil or the radiating source, which consisted of 500 W halogen lamps (model 9401610, ARGOS, Mexico) (Figure 2).
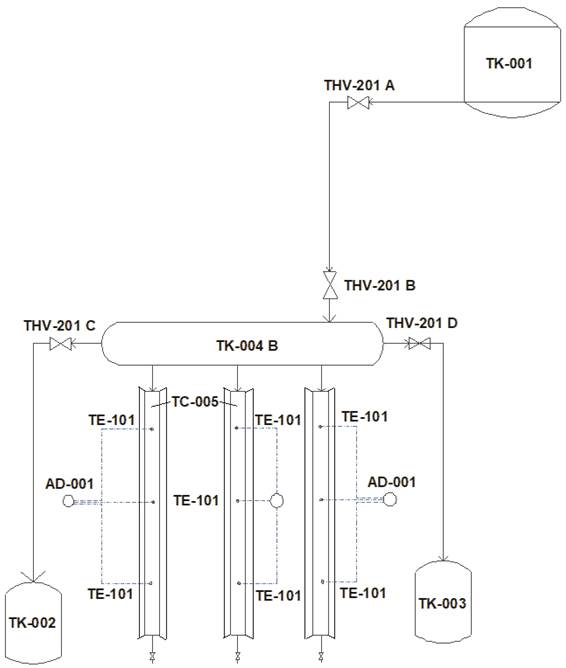
Figure 1 Experimental radiant energy collection system. TK-001 = mixing tank (water + particles); TK-002 = process fluid storage tank; TK-003 = vapor condensate storage tank; TK-004 B = tubular process fluid distribution vessel; TC-005 = radiant energy collector pipes with involutes; THV-201 A, THV-201 B and THV-201 C = manually operated fluid passage valves; THV-201 D = manually operated vapor passage valve; AD-001= data acquisition system with three thermocouples records; TE-101 = thermocouple type J.
Experimental organization
The operation of the radiant energy collection system was evaluated using pure water (Pw) as process fluid and water incorporated with activated carbon (Ac), Chinese ink (Ci) and copper particles (Nc), in a concentration of 0.05 % (Wang et al., 2018). The copper particles were provided by the Colegio de Postgraduados, Mexico, and were obtained by a laser ablation procedure (Bello-Bello et al., 2017). J-type thermocouples were placed inside the concentrator tube at a distance of 0.125 m from the beginning of the tube, at the center and at 0.125 m from the end of the tube (Figure 1), to record the variation of the temperature of the process fluid as a function of time. Radiant energy collection routines were conducted with recording of the process fluid temperature at 1-min intervals, in routines that lasted between 140 and 250 min. A characteristic time of study of the operation (t est ) and the temperature reached up to that point were identified (T est ). Likewise, the heat absorbed in this period (Q abs ), the temperature of the internal surface of the wall of the container tube (T P ) and the coefficient of internal thermal convection (h i ) were determined. All routines were performed in triplicate.
Particle size
The diameter of the particles incorporated into the process fluid was evaluated by means of a transmission electron microscope (FEI, Tecnai G2 Spirit MIC-E-004, Australia) by diluting a small sample in distilled water and homogenizing the dilution obtained with the aid of a stirrer to separate the particles and facilitate observation. Subsequently, a drop of the suspension was placed on a copper grid for observation under the microscope.
Heat transfer study
The process fluid of the radiant energy collection system consisted of pure water and water incorporated with particles. Due to the low concentration of these and their zero solubility, it was accepted that the fluid was generally formed from water, so the properties of this fluid were used as a working basis. An Antoine equation (Equation 1) (Felder & Rousseau, 2004) was used to determine the boiling temperature (T ebull ) at atmospheric pressure (P atm ) of the experimental site (Chapingo, México; P atm = 77 993 Pa), where P atm was substituted in Pa and T ebull was obtained in degrees Celcius (°C).
Temperature change data from each experimental routine were plotted as a function of time. Among the different systems, the cases where the temperature exceeded T ebull were identified and the minimum time to reach a value close to, but less than this value and the temperature corresponding to this time were determined in all the evaluation routines, which were considered as study time and temperature (t est and T est , respectively). To determine the absorbed heat (Q abs , W) an energy balance was applied in the form of Equation (2), where m F is the mass (kg) of the process fluid contained in the energy collection system (defined in terms of Equation 3), ( is the density (kg·m-3), V is the volume of the fluid (m3), Cp is the specific heat of water (J·kg-1·°C-1), T ini is the initial temperature (°C) and T est is the study temperature (°C) reached at the defined study (t est ) time. In addition, data from ( and Cp were consulted in the open literature (Geankoplis, 2003) as a function of temperature, and through regression models with the form of Equations (4) and (5) were fitted.
In order to determine the internal surface temperature of the tubular energy collection system (T P ) and the internal thermal convection coefficient (h i ), a transient energy balance was developed. For this purpose, the tubular radiant energy collection systems shown in Figure 1 were considered, which were characterized by having length L (0.9 m), internal diameter D i (0.0508 m) and process fluid mass m F (kg). The process fluid (water) contained in the collector tube was considered as the study system. Equation (6) describes the balance made, where E is the energy content (J), t is the time (s), Ee is the energy input flow (W) and Es is the energy output flow (W).
It was recognized that radiant lamps caused the temperature of the pipe wall to rise to a T P (°C) value. Due to the high thermal conductivity of copper (386 W·m-1·°C-1; Holman, 1986), it was accepted that the entire wall had a homogeneous temperature and from there heat was transferred, by a natural convection mechanism, to the process fluid, with a flow that had the magnitude (W) described by Equation (7), where h i is the internal convection coefficient (W·m-2·°C-1), A i is the internal surface area (m2) and T F is the average temperature of the process fluid in a given time (°C).
On the other hand, since the temperature of the internal surface of the pipe wall was higher than that of the process fluid (T P > T F ), it was accepted that there could be no loss of energy from the fluid, i.e. E s = 0. Furthermore, the variation of energy of the same process fluid, in the situation where only temperature change occurred without phase change by evaporation, was described in Equation (8).
With these criteria, Equation (6) was rewritten in the form of Equation (9), and after a rearrangement Equation (10) was obtained.
From Equation (10) a heating coefficient (b; s-1) was defined in the form of Equation (11), so Equation (10) was simplified to the form of Equation (12).
Equation (12) was solved using an integrating factor (F) defined in Equation (13) and the procedure described in Equation (14) (Kreyszig, Kreyszig, & Norminton, 2011), resulting in Equation (15). To evaluate the integration constant (C), it was considered that at time zero (t= 0) the temperature of the process fluid was T F = T 0 . With this, it was found that C = T 0 - T P , and after a rearrangement, Equation (16) was obtained, with the meaning of the constant a given in Equation (17).
The obtained data from each experimental routine were subjected to a non-linear regression supported by the Sigma Plot® program (SPSS Inc, 2000) to fit a model with the form of Equation (16), where T 0 (°C), a (°C) and b (s-1) were obtained as regression constants. To determine the internal convection coefficient (h i ) and the internal wall surface temperature (T P ) of the system, Equation (16) was expressed in explicit form for time, as shown by Equation (18).
Based on Equations (11) and (17), Equation (18) was also expressed in the form of Equation (19).
The parameters (h i and T P ) were evaluated with the non-linear least squares algorithm (function lsqnonlin.m) available in the Matlab® optimization toolbox (The Mathworks Inc., 1990). The function was applied with the syntax described in Equation (20) to find the best values of h i and T P , denoted as x(1) and x(2), respectively, so that Equation(19) reproduced the experimental behavior represented by Equation (18).
The variable x0 defined the set of proposed initial conditions required by lsqnonlin.m to perform the calibration of x(1) and x(2). The variable lb established that the parameters sought could not be negative. The empty bracket indicated that there was no upper limit set for x(1) and x(2). Additionally, the routine was developed considering, as options, a maximum number of iterations of 2000 and a minimum tolerance of 1×10⁻⁵ in the function, so that the optimal value was found when the relative change of the search in the direction of the abscissa axis was less than this reference.
Data analysis
This study was carried out congruently with a 4×4 factorial arrangement, under a completely randomized design, where one of the factors was the angle of inclination of the collector system with four levels (30, 35, 40 and 45°), and the other was the process fluid with four levels (Pw, and suspension with Ac, Ci and Nc). The data of temperature reached at the time of study (T est a t est ), heat absorbed (Q abs ) at t est , wall temperature (T P ) and internal thermal convection coefficient (h i ) were subjected to an analysis of variance and a test to compare treatment means using Tukey's statistic (P ≤ 0.05). All analyses were performed with the SAS program (SAS Institute Inc., 1999).
Results and discussion
Process fluids
In general, the particles had a spherical shape (Figure 3), with an average diameter of 102.2 ± 20.1 nm for Ac, 198.4 ± 17.6 nm for Ci and 160.1 ±54.1 nm for Nc (Figure 4). Because the dimensions of the nanoparticles are in the range of 1 to 100 nm (Samyn, Barhoum, Öhlund, & Dufresne, 2018), the suspensions used in the present study were not catalogued as nanofluids.
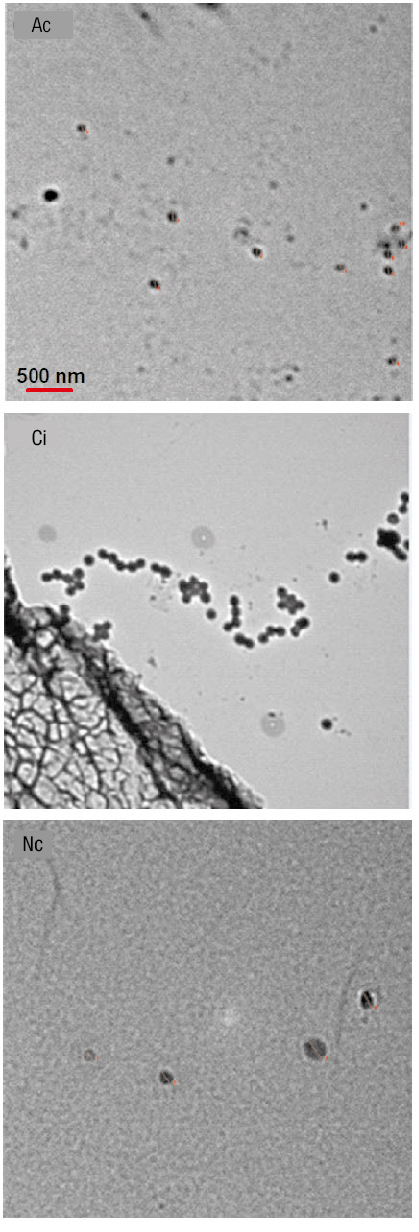
Figure 3 Appearance of particles incorporated in the process fluid of the radiant energy collection system. Ac = activated carbon; Ci = Chinese ink; Nc = copper particles.

Temperature change
The radiant energy source consisted of 500 W lamps, which simulated operation under constant conditions. This was similar to that reported by Wang et al. (2018) and Chen, Munjiza, Zhang, and Wen (2014), who conducted experiments with 300 and 700 W radiation, respectively, and obtained a uniform heating of the fluid. During operation, heating of the process fluid occurred rapidly at the beginning, but at a slower rate over time in most experimental routines (Figure 5). This behavior was expected and was congruent with a process of heating a material that stores heat energy in a transient regime (Valle-Guadarrama, Hernández-Álvarez, & Covarrubias-Gutiérrez, 2007). The heat received by the process fluid comes from the internal metal surface of the tubular container, and the energy flow is a function of the magnitude of the temperature gradient between fluid and surface. As the temperature of the fluid increases, the temperature gradient decreases, which causes the heat flow to occur at a lower rate and causes the temperature change to occur also at a lower rate (Holman, 1986).
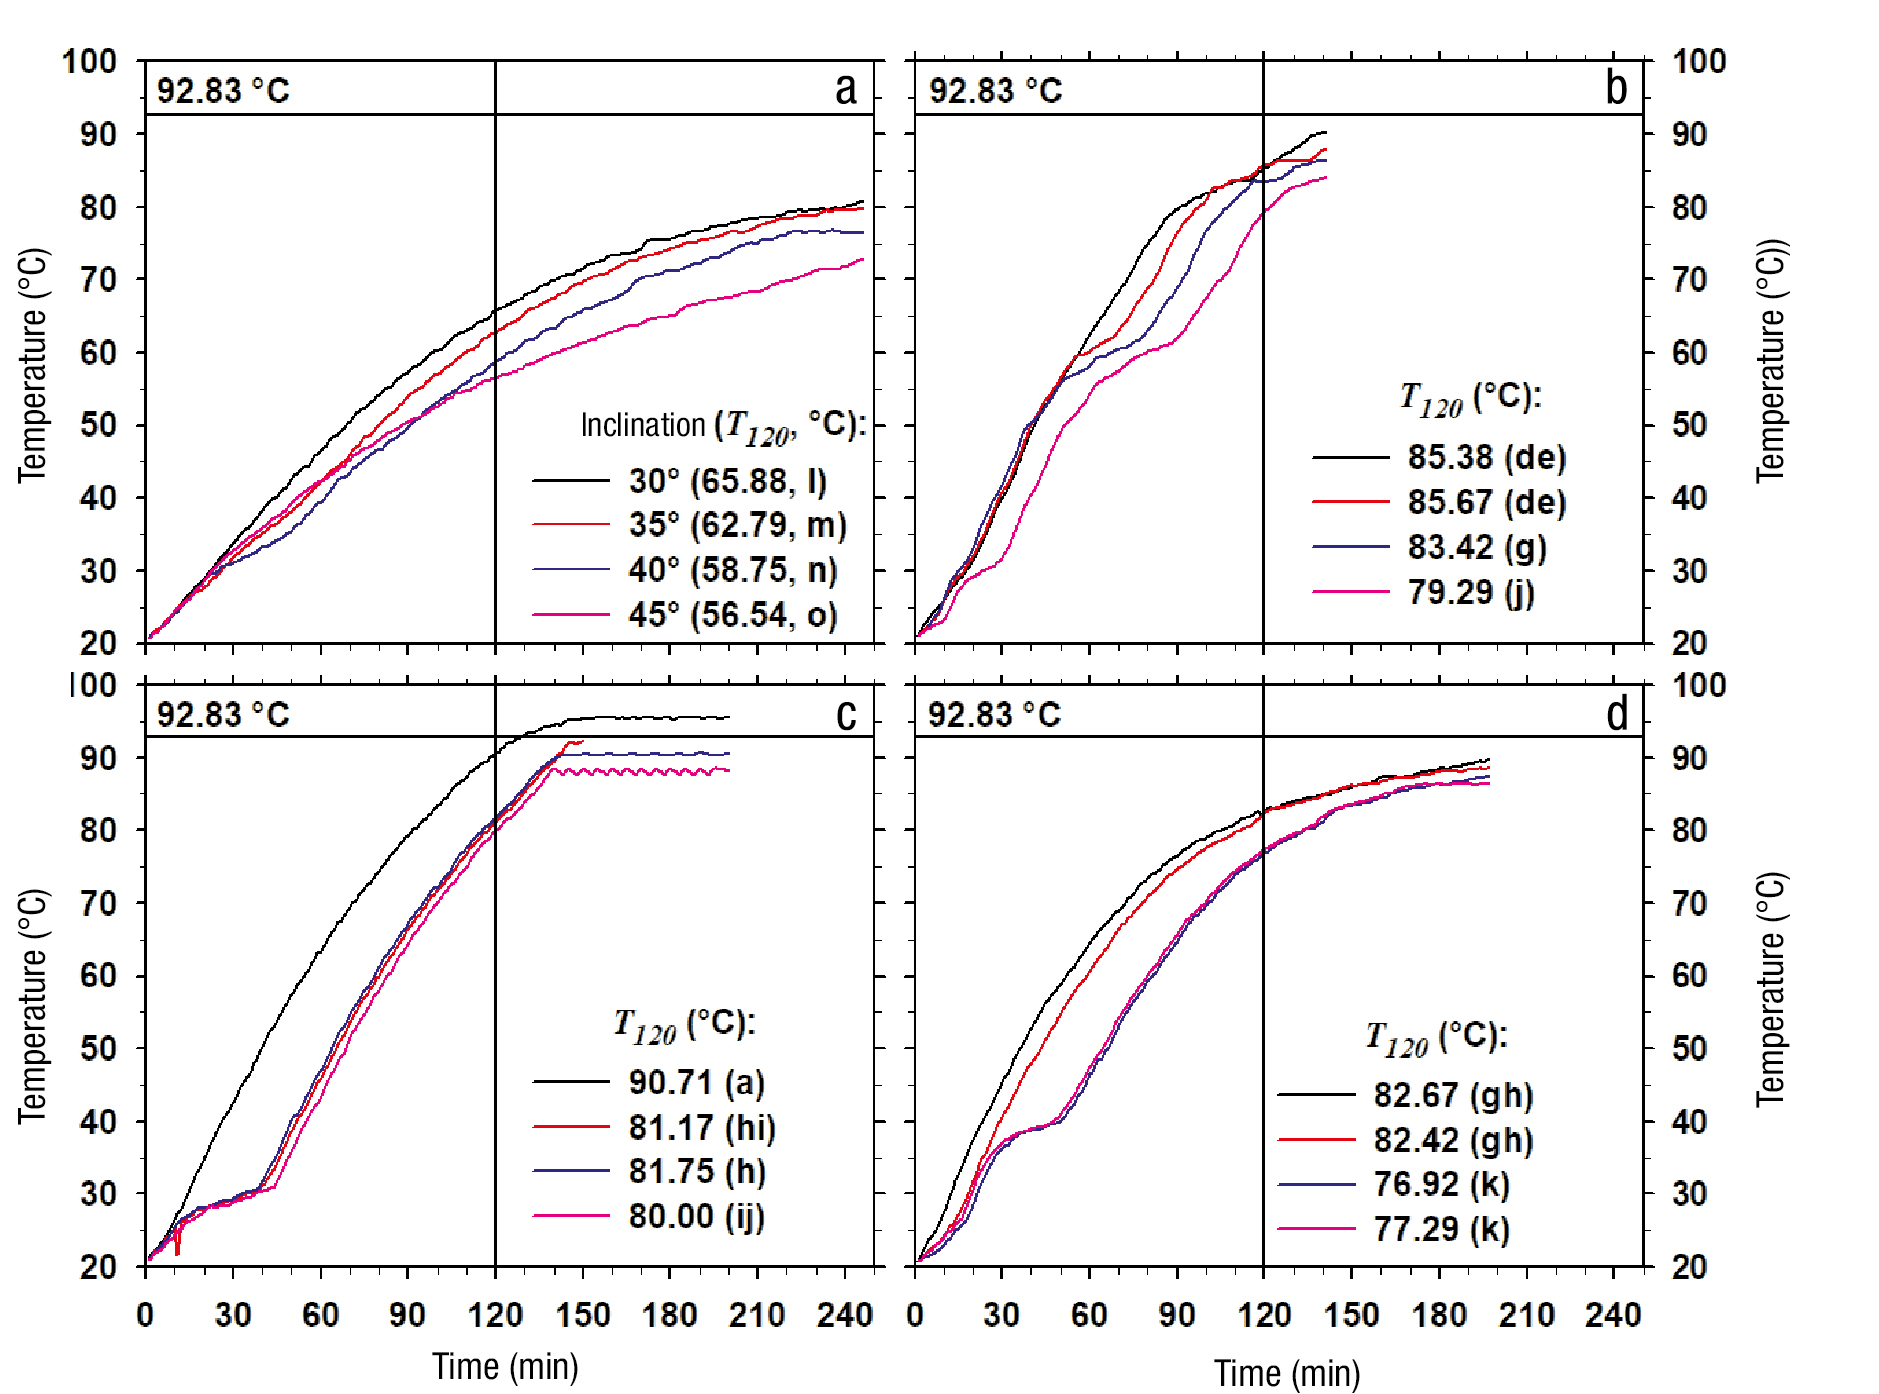
Figure 5 Temperature variation according to time of the process fluid formed by pure water (a) and incorporated with activated carbon (b), Chinese ink (c) and copper particles (d). T 120 = temperature reached after 120 min of heating. The constant 92.83 °C corresponds to the boiling temperature of water at 77 993 Pa. Equal letters associated with T 120 indicate non-significant difference (Tukey, P ≤ 0.05).
From Equation (1), the boiling temperature of pure water at the atmospheric pressure at the experimental site (77 993 Pa; Chapingo, Mexico) is 92.83 °C. Among the different systems, the one that reached this condition in less time corresponded to the one that used water incorporated with Chinese ink as process fluid and an inclination angle of 30°, which occurred at 128 min of exposure to thermal radiation (Figure 5). Based on the above, the time of 120 min was considered as the process study time (t est =t 120 ) in order to evaluate the temperature change in a condition without phase change.
The temperature reached at 120 min (T 120 ) was affected both by the type of process fluid and by the inclination of the collector, and there was even a significant interaction between both variation factors (Table 1). After 120 min of operation, all systems using particle suspensions had average temperatures between 79 and 84 °C, which were significantly higher (P ≤ 0.05) than the average temperature when Pw (61 °C) was used. The major effects analysis showed that the systems that used Ac and Ci caused the highest temperature at 120 min of operation, without significant difference (P> 0.05) between them, followed by the treatment with Nc and, finally, the system with Pw (Figure 5, Table 2).
Table 1 Percentile values of the Fisher distribution (F 0.05 ) and F values corresponding to the analysis of variance of the evaluation of the operation of the compound parabolic collector (CPC) affected by the type of process fluid and the angle of inclination.
| Variable | Factor of variation | Error | CV (%) | ||
|---|---|---|---|---|---|
| Fluid (F) | Inclination(I) | F×I | |||
| gl | 3 | 3 | 9 | 32 | --.-- |
| F 0.05 | 2.9011 | 2.9011 | 2.1888 | --.-- | --.-- |
| Collector operating variables | |||||
| T 120 | 5 410.10* | 547.01* | 50.99* | --.-- | 0.6584 |
| Q abs | 5 796.72* | 589.60* | 5378* | --.-- | 0.8535 |
| T P | 1 169.47* | 26.55* | 50.30* | --.-- | 1.3540 |
| h i | 165.60* | 124.06* | 53.45* | --.-- | 4.7641 |
Fluid = factor of variation given by the type of process fluid; Inclination = factor of variation given by the inclination of the collector; F×I = interaction between the factors type of fluid and inclination; gl = degrees of freedom; CV = coefficient of variation; T 120 = temperature at 120 min of operation; Q abs = heat absorbed at 120 min of operation; T P = wall temperature; h i = thermal convection coefficient; * = indicates that at least one level within the factor of variation produced a different effect in relation to the rest (P ≤ 0.05)
Table 2 Means comparison of the operation of the compound parabolic collector affected by the type of process fluid and the angle of inclination of the system.
| FV | T 120 (°C) | Q abs (W) | T P (°C) | h i (W·m-2·°C-1) |
|---|---|---|---|---|
| Type of fluid | ||||
| Pw | 60.9896 cz (1.0902) | 41.6183 c (1.1055) | 77.5345 c (1.5558) | 12.5197 b (0.4868) |
| Ac | 83.4375 a (0.7743) | 64.1055 a (0.7858) | 92.2767 b (0.9159) | 15.7617 a (0.5378) |
| Ci | 83.4063 a (1.2970) | 64.1564 a (1.2890) | 107.8120 a (1.5805) | 10.6126 c (0.9308) |
| Nc | 79.8542 b (0.8202) | 60.8583 b (0.8337) | 92.3272 b (0.9735) | 15.1566 a (1.1776) |
| HSD | 0.5602 | 0.5440 | 1.3852 | 0.7121 |
| Inclination of the collector | ||||
| 30° | 81.1563 a (2.8016) | 61.9615 a (2.7978) | 93.6484 b (2.2819) | 16.4855 a (0.8042) |
| 35° | 78.0104 b (2.6987) | 58.7783 b (2.7321) | 94.8894 a (3.6290) | 13.3644 b (1.1020) |
| 40° | 75.2083 c (2.9564) | 55.9543 c (2.9768) | 93.0261 a (3.2262) | 12.1469 c (0.9307) |
| 45° | 73.3125 d (2.9362) | 54.0444 d (2.9549) | 90.8985 b (4.3192) | 12.0539 c (0.6658) |
| HSD | 0.5602 | 0.5446 | 1.3852 | 0.7121 |
FV = factor of variation; T 120 = temperature at 120 min of operation; Q abs = heat absorbed at 120 min of operation; T P = wall temperature; h i = thermal convection coefficient; Pw = pure water; Ac = water with activated carbon; Ci = water with Chinese ink; Nc = water with copper particles; HSD = honest significant difference. zMeans with equal letters within each column do not differ statistically (Tukey, P ≤ 0.05). Values in parentheses represent standard errors.
The use of particles in the process fluid in radiant energy collection systems has been reported before (Fang et al., 2013; Neumann et al., 2013; Ni et al., 2015), and their presence, even in low concentrations, has been shown to favor heat transfer into the process fluid. In this regard, Wang et al. (2018) reported the use of nanoparticles in a concentration of 0.05 % of the total mass of the studied fluid and explained that around each particle a microenvironment of greater energy retention is generated which favors the incorporation of this energy into the fluid. On the other hand, the greater the angle of exposure to the energy source, the lower the temperature of the process fluid after 120 min of operation, and the average temperature varied from 81.2 °C with 30° to 73.3 °C with 45° (Table 2). This suggested that in order to favor the collection of radiant energy, it is advisable to use small angles of exposure to the energy source.
Radiant energy collection systems are usually installed at a certain inclination and the angle determination is a necessary aspect to optimize operation (Tamimi, 2011). In a CPC such as the one evaluated in this study, the use of inclination is a required feature, since the fluid feed occurs at the top (Figure 1), so the lowest temperature and therefore the highest density occurs in that region. With the inclination, a thermosiphon effect is produced and induces natural convection and better distribution of the heat transferred throughout the fluid. Although the results suggest that with very small angles, and even with no inclination, a better collection of energy can be expected, this can reduce the effect of gravity on temperature homogenization by making the thermosiphon effect more difficult. For this reason, this study considered appropriate to evaluate the system from 30° of inclination.
The comparative analysis of individual treatment means showed that the case with Ci in the fluid, with an angle of inclination of 30°, had the highest temperature at 120 min of operation (90.71 °C), followed by the one using Ac, with an angle of 30° (85.38 °C) or 35° (85.67 °C), and then the one using Nc, also with 30° (82.67 °C) or 35° (82.42 °C). In each of these cases, with greater inclination there was a rapid loss of performance. Finally, the worst performance was obtained with pure water, where the temperature reached at 120 min varied from 65.88 °C with 30° of inclination to 56.54 °C with 45° (Figure 6A).
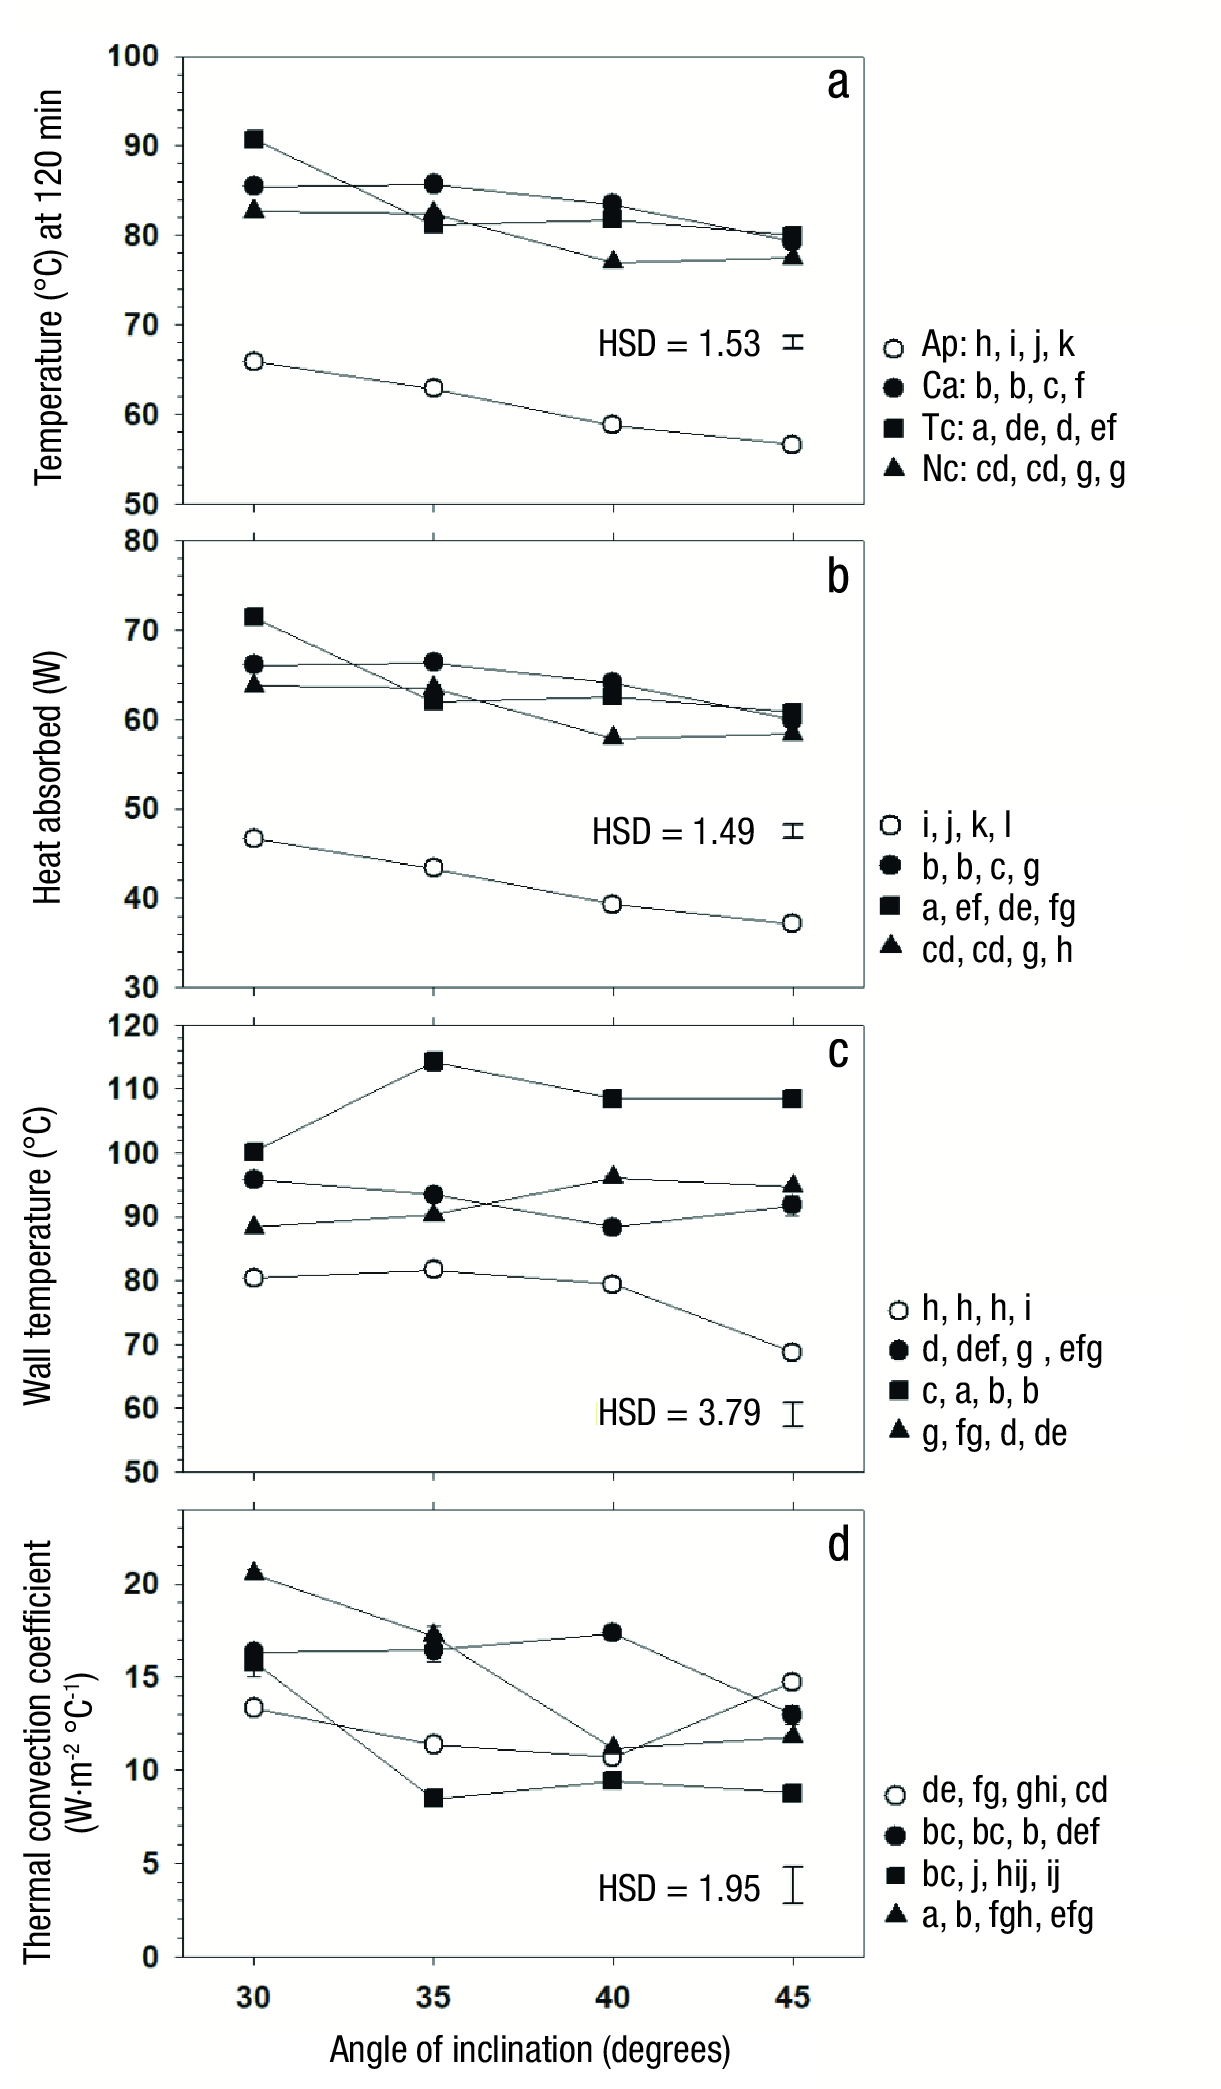
Figure 6 a) Variation of the temperature reached at 120 min of operation (T120), b) heat absorbed (Q abs ) up to that condition, c) wall temperature (Tp) and d) thermal convection coefficient (hi); all affected by the angle of inclination of the equipment. Pw, Ac, Ci and Nc represent pure water and process fluid with activated carbon, Chinese ink and copper particles, respectively. HSD = honest significant difference. Equal letters at each condition indicate difference not significant (Tukey, P ≤ 0.05).
Heat absorbed
The behavior of the absorbed heat (Q abs , W) was similar to that recorded at the temperature reached at 120 min (T 120 ). This was due to the fact that the calculation of Q abs was made with Equation (2), where the concentration of particles was only 0.05 %, so the mass (m F ), which constituted the process fluid, did not vary and the only variable that changed in these cases was the study temperature (T est = T 120 ), which caused the behavior shown by Figure 6B to be similar to that shown by Figure 6A. The highest value of Q abs occurred with Ac and Ci, with no significant difference between these cases (P > 0.05), followed by Nc. The heat transfer rate to the process fluid was higher with Ac, Ci and Nc, by 54.03, 54.15 and 46.23 %, respectively (Table 2), compared to Pw, which indicated that the incorporation of particles significantly improved the performance of the CPC.
Similarly to that occurred with T 120 , the heat absorbed by the process fluid was significantly reduced (P ≤ 0.05) as the angle of inclination increased (Table 2), with a difference of 12.78 % between the 30° and 45° operation. This behavior was observed in all process fluids, where the highest Q abs values were recorded at 30° and the lowest at 45° of inclination (Figure 6B).
Wall surface temperature
The temperature reached on the internal surface of the pipe wall containing the process fluid (T P ) was significantly affected by both variation factors, and the interaction between them was also significant (Table 1). The analysis of major effects showed that the highest average wall temperature (P ≤ 0.05) was recorded in the system that used Ci, followed by the one that incorporated Ac and Nc, without difference between them, and finally by the one that used Pw. Since the highest liquid temperatures and the highest values of heat absorbed were recorded with the lowest inclination angles, it was expected that the highest solid surface temperature would have corresponded to the lowest angles; however, although there was a difference caused by the different angle of inclinations, a no clear trend was identified.
On the other hand, there was significant interaction between the factors of variation, and the analysis of each particular fluid showed that three groups were formed. One of them was composed of Ci, where the highest T P values were recorded (Figure 6C). The second group was formed by Ac and Nc, where similar behavior was observed at all angles. Finally, the third group included only Pw, whose T P value was much lower (P ≤ 0.05) than that recorded in systems that incorporated some suspended particles, and the value was even lower with the highest inclination angle, which confirmed that the use of particles allows an improvement in the performance of the CPC.
Internal thermal convection coefficient
Heat transfer from the inner surface of the container pipe into the process fluid occurred by a natural convection mechanism. The thermal convection coefficient (h i ) associated with this heat exchange ranged from 10.61 to 15.76 W·m-2·°C-1. The h i coefficient represents the heat flow transferred per unit area and per unit of temperature gradient (Equation 7; Holman, 1986). The h i value was affected by the type of fluid (Table 1), and was higher in the system that used Nc and Ac, then the Ap-based system, and finally the one that used Ci. Since in all cases the area of heat transfer was the same, the results showed that Ci-based systems allowed less heat transfer for each degree of temperature difference between the fluid and the solid surface of the system. However, the absorbed heat data showed that even with this feature, the Ci-based system, with a 30° angle of inclination, represents the best alternative.
On the other hand, it was found that with lower inclination angle the values of the h i coefficient were higher (Table 2), but the interaction between the type of fluid and the inclination angle as variation factors was significant (Table 1). The analysis of each particular fluid showed that the systems using Ci and Nc had clear reduction of h i with increasing angle of inclination, but in the other two systems this coefficient remained unchanged (Figure 6D).
The radiant energy collection system evaluated was based on the use of working fluid kept in a stationary form inside the collector pipe; therefore, the heat transport from the internal solid surface to the fluid corresponded to a natural convection. In this sense, the values obtained for the h i coefficient were similar to those reported in the literature for different geometries that develop heat transport by natural convection, where values fluctuate between 5 and 25 W·m-2·°C-1 (Holman, 1986).
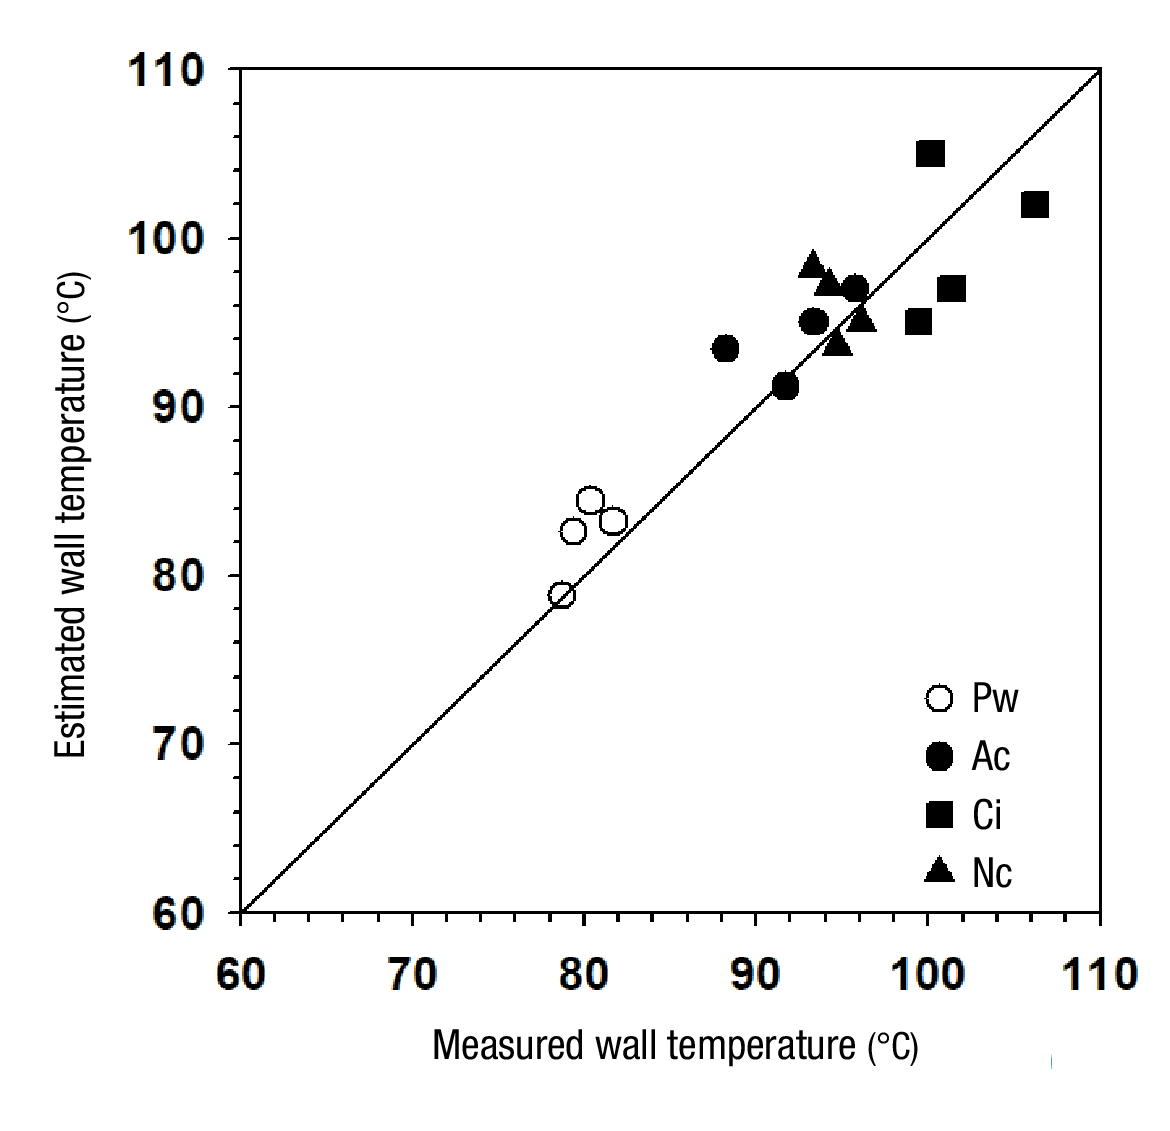
Utility validation
Physical measurements of the wall temperature of the process fluid container pipe were made with an infrared surface temperature sensor (Multimeter EXTECH™, EX810, USA), until a stabilized condition was reached. The experimental data were compared with those estimated with the modeling routine through a one-to-one representation (Figure 7). The measured-estimated data pairs were subjected to a linear regression routine, from which a determination coefficient (R 2 ) equal to 0.8083 was obtained, indicating that the estimate made using the Matlab® lsqnonlin.m routine was able to predict the system wall temperature data by 80.8 %. In particular, the data corresponding to Pw showed a tendency to be overestimated, but in the rest there was no clear trend of under- or overestimation. In general, the estimation of thermal parameters made with the model was considered acceptable.
Operating efficiency
To evaluate the radiant energy collection system, three 500 W lamps were used, placed at a distance of 40 cm from the top of involutes of the system with a 30° inclination (Figure 2). The area of incidence of radiant energy was 1.6 m2, which generated an available energy flux of 937.5 W·m-2; while the area of the three involutes was 0.3343 m2, which indicated that the incidence of radiant energy on them was 313.41 W. Lee, Park, Walsh, and Xu (2012) found that even with a low concentration of nanoparticles (0.05 % by volume), the nanofluid achieved an energy collection efficiency of up to 70 % without any degree of inclination. Based on the absorbed heat data reported in Figure 6 for the 30° inclination, the radiant heat collecting efficiencies were 68.4 % for Ci, 63.2 % for Ac, 61.0 % for Nc and 44.6 % for Pw, which confirmed that the incorporation of particles in the receiving fluid significantly increased the efficiency of the CPC.
Conclusions
The increased angle of inclination caused a reduction in the CPC radiant energy collection capacity. The incorporation of particles into the process fluid significantly improved the performance of the CPC, compared to the system in which pure water was used as fluid. The best operating characteristics were obtained with the incorporation of Chinese ink, followed by the use of activated carbon, which are suitable alternatives for handling a CPC.

