


 texto em
  Inglês (pdf)
 Artigo em XML
 Referências do artigo
 Enviar este artigo por email
 Citado por SciELO
  Similares em
SciELO
Similares em
SciELO 
 Permalink
Introduction
The term evapotranspiration is used to describe the sum of evaporation and transpiration. The former takes into account soil water losses, canopy interception and water bodies, while the latter considers water losses in the form of vegetation vapor (Allen, Jensen, Wright, & Burman, 1989; Eslamian, Khordadi, & Abedi-Koupai, 2011). Estimating evapotranspiration from cultivated areas is an essential task in climatic and hydrological studies, as well as in projects related to water management in agriculture (Bakhtiari & Liaghat, 2011). In the latter, estimating evapotranspiration is commonly based on quantifying two parameters: atmospheric demand through the calculation of reference evapotranspiration (ETo) and the contribution of the surface from the crop coefficient (Kc), thus obtaining crop evapotranspiration (ETc) (Allen, Pereira, Raes, & Smith, 1998; Bakhtiari & Liaghat, 2011).
ETo is a climate-related parameter that expresses the evaporating power of the atmosphere at a specific locality and time of year (Allen, Pereira, Raes, & Smith, 2006), and can be calculated by several methods, although the Penman-Monteith procedure is the standard recommended by the Food and Agriculture Organization (FAO) of the United Nations (Allen et al., 1998; Droogers & Allen, 2002). However, one of the main limitations of this method is that it requires information on radiation, temperature, soil heat flux, relative humidity and wind speed, which is not always available (Gong, Xu, Chen, Halldin, & Chen, 2006). Therefore, it is common to use empirical and semi-empirical methods to determine ETo (Chávez-Ramírez et al., 2013).
In Mexico, studies aimed at the analysis of evapotranspiration are few, in addition to being considered as specific studies. This situation has occurred mainly due to the lack of information on the variables involved in the calculation of ETo. However, since the late 1990s, Mexico’s National Meteorological Service (SMN, for its acronym in Spanish) has been promoting the installation of a network of automatic weather stations, which consists of 189 weather stations and 87 synoptic ones dedicated to monitoring and gathering information on variables such as temperature, relative humidity, atmospheric pressure, solar radiation, precipitation, and wind speed and direction (SMN, 2016).
In recent years, authors such as Goyal (2004) have pointed out that any change observed in climatic parameters, on which evapotranspiration depends, can significantly affect it, as well as have a specific impact on crop water needs. In this sense, Bakhtiari and Liaghat (2011), Estévez, Gavilán, and Berengena (2009), Gong et al. (2006), and Tabari and Hosseinzadeh (2014) found, in studies carried out using the Penman-Monteith method, that ETo is very sensitive to changes in temperature, radiation and relative humidity. In addition, they observed that the degree of ETo sensitivity varies according to the time of year and the geographic location of the site analyzed, which can have a direct impact on rainfed agriculture. Ruiz-Corral, Ramírez-Díaz, Flores-Mendoza, and Sánchez-González (2000) point out that rainfed cropping systems are the most sensitive to climatic variations, since they depend solely on rainwater for production. According to Rockström (2003), a change in climatic conditions can cause serious problems due to the fact that, worldwide, rainfed agriculture accounts for around 80 % of cultivated land.
The Lerma-Chapala basin is home to 11 % of the country's population and partially covers the territory of five states: State of Mexico, Querétaro, Michoacán, Guanajuato and Jalisco (Diario Oficial de la Federación [DOF], 2006). Historically, this basin has maintained numerous cultures, which adapted their production systems to the natural availability of water. Currently, the basin supplies mainly the services and commerce sector, followed by industry and agriculture (Sotelo et al., 2005). However, the farm sector occupies 56 % of the basin's surface area and is mostly used for rainfed agriculture (DOF, 2006). In this context, and considering that studies conducted in other countries have observed an important effect on the behavior of evapotranspiration when there are significant changes in climatic parameters, the objectives of this work were focused on evaluating ETo by the Penman-Monteith method using data from the network of SMN automatic weather stations and on analyzing the behavior of ETo during the rainy season on a daily, monthly and seasonal basis.
Materials and methods
Description of study area
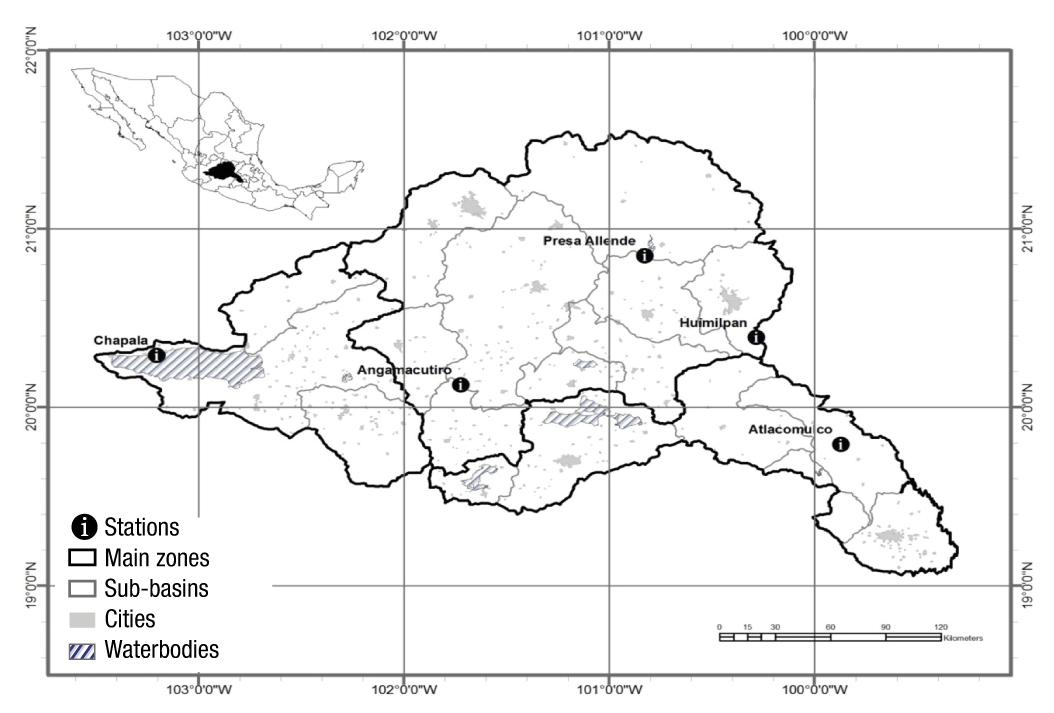
The Lerma-Chapala basin is located in the central western part of Mexico (Figure 1) and has an area of 51 887 km2, which represents approximately 3 % of the country’s total area. The average annual precipitation in the Lerma-Chapala River’s hydrological zone is 771 mm, considering the average recorded during the period 1940-2001, although this value is very variable in time and space. Available precipitation records show, year by year, a wide range of variation spanning from 460 to 1 070 mm. The average monthly temperature inside the basin varies from 14.6 °C in January to 21.3 °C in May (DOF, 2006).
Information used
For the development of this work, daily data series for temperature, radiation, atmospheric pressure, relative humidity and wind speed were obtained from nine SMN-operated automated weather stations, for the period 2001-2010. These data series were analyzed to determine the amount of missing data at each station and to discard those that presented more than 10 % missing data. This is because, according to the World Meteorological Organization (WMO), missing data can decisively affect data-related analyses (OMM, 2011). Considering the above, four stations were discarded, so only the stations described in Table 1 were ultimately used. The data series were divided to take into account, within the calculations, only the months from May to September of each year, since this is the period in which rainfed agricultural activities are commonly carried out and corresponds to the time in which between 75 and 80 % of annual rainfall occurs (Ruiz-Corral et al., 2000).
Table 1 Automatic weather stations used to calculate reference evapotranspiration.
| Station | Location | Latitude (N) | Longitude (O) | Elevation (m asl) |
|---|---|---|---|---|
| Atlacomulco | State of Mexico | 19º 47’ 30’’ | 99º 52’ 11’’ | 2 600 |
| Huimilpan | Querétaro | 20º 23’ 24’’ | 100º 17’ 00’’ | 2 280 |
| Presa Allende | Guanajuato | 20º 50’ 54’’ | 100º 49’ 33’’ | 1 915 |
| Angamacutiro | Michoacán | 20º 07’ 31’’ | 101º 43’ 21’’ | 1 730 |
| Chapala | Jalisco | 20º 17’ 25’’ | 103º 12’ 06’’ | 1 493 |
Analysis method
The Penman-Monteith method quantifies atmospheric demand taking into account a reference crop with a height of 0.12 m, a fixed surface resistance of 70 s·m-1 and an albedo of 0.23 m, which resembles the evaporation that occurs in an extensive surface of green grass of uniform height, actively growing and well irrigated (Allen et al., 2006). The equation established in this model is described below:
where ETo is the reference evapotranspiration (mm·day-1), Rn is the net radiation at the crop surface (MJ·m-2·day-1), G is the soil heat flux density (MJ·m-2·day-1), T is the mean air temperature (°C), u 2 is the wind speed (m·s-1), e s is the saturation vapor pressure (kPa), e a is the actual vapor pressure (kPa), ( is the slope vapor pressure curve (kPa·°C-1) and ( is the psychrometric constant (kPa·°C-1).
Statistical analysis
The results obtained from the ETo calculation, as well as the temperature, radiation, relative humidity and wind speed records, were subjected to a descriptive statistical analysis consisting of the calculation of the central tendency and dispersion measurements. In addition, an analysis of variance and Tukey's multiple comparison test (P ≤ 0.05) were performed to determine statistically significant differences among the treatments (stations) in ETo. Finally, a correlation analysis was carried out to determine the degree of relationship between ETo and the climatic parameters used in the calculations (Triola, 2013). The open source statistical platform R (R Core Team, 2013) was used to undertake the calculations and graphs.
Results and discussion
The results of the daily-scale ETo calculation showed important fluctuations during the rainy season at the five stations analyzed, which can be a product of the changing weather conditions from one day to the next due to the decrease in radiation received on cloudy days and the increase in relative humidity resulting from rainy days. These results showed, on average, values higher than 6 mm·day-1 at the beginning of the rainy season and lower than 2 mm·day-1 at its end. ETo behavior during the rainy season followed a decreasing pattern characterized by being non-linear, showing the most important decrease during the first two months of the season (Figure 2). This behavior is similar in all seasons, which may be due to the presence of a microclimate inside the basin (González-Sosa et al., 2010). Despite this similarity, the magnitude observed among the stations showed statistically significant differences with the exception of the Chapala and Huimilpan stations (Table 2 and 3).
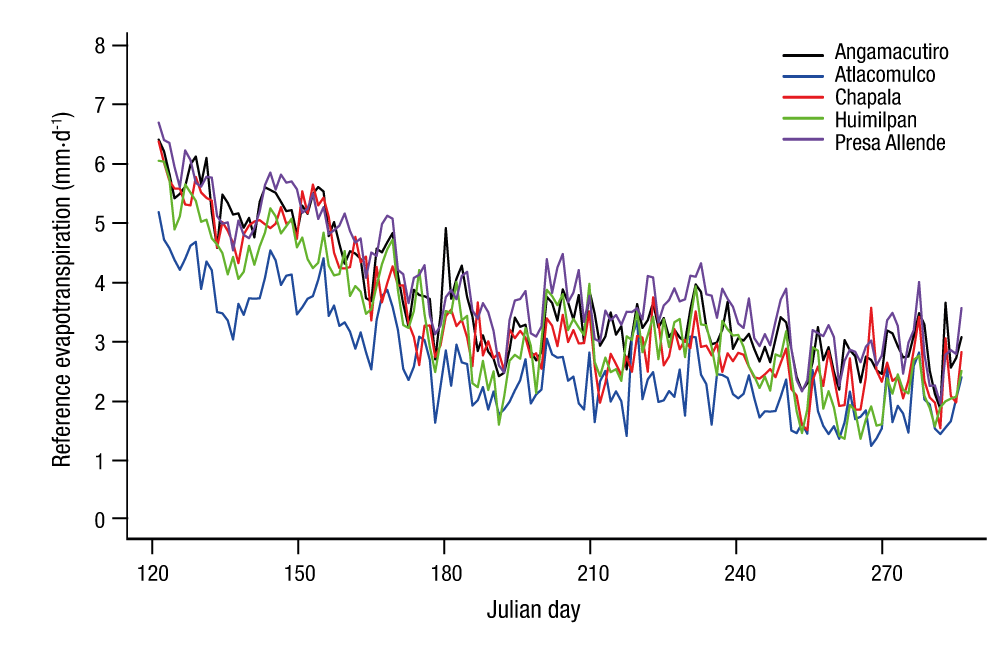
Figure 2 Behavior of average daily reference evapotranspiration for the period 2001-2010 in the Lerma-Chapala basin.
Table 2 Analysis of variance of daily reference evapotranspiration.
| Degrees of freedom | Sum of squares | Root mean square | F | P | |
|---|---|---|---|---|---|
| Stations | 4 | 154.1 | 38.53 | 34.02 | <2 x 10-16*** |
| Residuals | 755 | 855.2 | 1.13 | ||
| Total | 759 | 1009.3 |
*** = P ≤ 0.001
Table 3 Comparison of means of the reference evapotranspiration values of the stations studied.
| Difference in levels | Difference in means | 95 % confidence interval | Adjusted P-value | |
|---|---|---|---|---|
| Atlacomulco - Angamacutiro | -1.0957668 | -1.429593 | -0.76193988 | 0.0000000 |
| Chapala - Angamacutiro | -0.3352835 | -0.669110 | -0.01456619 | 0.0048396 |
| Huimilpan - Angamacutiro | -0.4546521 | -0.788479 | -0.12082516 | 0.0019621 |
| Presa Allende - Angamacutiro | 0.2207373 | 0.113089 | 0.55456424 | 0.0036958 |
| Chapala - Atlacomulco | 0.7604833 | 0.426656 | 1.09431017 | 0.0000000 |
| Huimilpan - Atlacomulco | 0.6411147 | 0.307287 | 0.97494162 | 0.0000019 |
| Presa Allende - Atlacomulco | 1.3165041 | 0.982677 | 1.65033104 | 0.0000000 |
| Huimilpan - Chapala | -0.1193685 | -0.453195 | 0.21445835 | 0.8652756 |
| Presa Allende - Chapala | 0.5560209 | 0.222194 | 0.88984777 | 0.0000600 |
| Presa Allende - Huimilpan | 0.6753894 | 0.341562 | 1.00921632 | 0.0000004 |
Differences in means with Tuckey’s test (P ≤ 0.05).
Table 4 shows the descriptive ETo statistics of the five analyzed stations. The values reported in this table are within the ranges obtained by González-Sosa et al. (2010) and Vásquez-Méndez, Ventura-Ramos, and Acosta-Gallegos (2011) in investigations carried out in Michoacán and Querétaro, respectively, and by Allen et al. (2006) for humid and sub-humid climates in the tropics and subtropics. The most important differences in ETo were found at the Atlacomulco, Chapala and Presa Allende stations, which are located in the upper, lower and middle part of the basin, and the average ETo value was the lowest, intermediate and highest, respectively. These results show that ETo does not depend on the elevation of the site studied, but it can play an important role in evaporative demand, since as the elevation decreases, the temperature increases, which also increases the capacity of the air to retain water vapor (Goyal, 2004). Chávez-Ramírez et al. (2013) reported similar results in the Nazas River basin by obtaining higher ETo values in the lower part of the basin than in the middle part.
Table 4 Descriptive statistics of average daily evapotranspiration.
| Station | Maximum (mm) | Mean (mm) | Standard deviation (mm) | Coefficient of variation (%) |
|---|---|---|---|---|
| Atlacomulco | 8.18 | 2.6579 | 1.57602 | 59.3 |
| Huimilpan | 10.37 | 3.2969 | 1.77412 | 53.8 |
| Presa Allende | 10.08 | 3.9732 | 1.73415 | 43.6 |
| Angamacutiro | 10.54 | 3.7532 | 1.77541 | 47.3 |
| Chapala | 10.57 | 3.4408 | 1.69678 | 49.3 |
Table 5 shows the descriptive statistics of the variables used to calculate ETo. In this table, it can be observed that radiation and temperature have an inversely proportional relationship with the elevation of the site under study. In the case of temperature, this condition is known as vertical thermal gradient (Comino, 2013). According to these results, it can be expected that the middle and lower part of the basin are the regions with the greatest amount of energy available to direct the evapotranspiration process.
Table 5 Descriptive statistics of climatological variables associated with reference evapotranspiration.
| Climatological variable | Station | Minimum | Maximum | Mean | Standard deviation | Coefficient of variation (%) |
|---|---|---|---|---|---|---|
| Radiation (MJ·m-2·d-1) | Atlacomulco | 3.53 | 38.16 | 13.93 | 3.91 | 28/.1 |
| Huimilpan | 2.99 | 45.59 | 15.40 | 3.79 | 24.6 | |
| Presa Allende | 3.90 | 48.80 | 15.85 | 3.89 | 24.5 | |
| Angamacutiro | 1.60 | 52.66 | 15.91 | 3.98 | 25.0 | |
| Chapala | 4.99 | 51.38 | 16.18 | 3.63 | 22.4 | |
| Temperature (°C) | Atlacomulco | 10.95 | 21.70 | 16.43 | 1.37 | 8.3 |
| Huimilpan | 11.60 | 23.70 | 17.92 | 1.56 | 8.7 | |
| Presa Allende | 14.15 | 27.45 | 20.94 | 1.71 | 8.2 | |
| Angamacutiro | 15.80 | 30.90 | 21.60 | 1.93 | 8.9 | |
| Chapala | 14.30 | 35.45 | 22.78 | 1.68 | 7.4 | |
| Relative humidity (%) | Atlacomulco | 23.50 | 95.00 | 68.21 | 10.18 | 14.9 |
| Huimilpan | 19.50 | 97.50 | 66.39 | 12.24 | 18.4 | |
| Presa Allende | 24.00 | 96.00 | 64.55 | 11.18 | 17.3 | |
| Angamacutiro | 24.50 | 97.50 | 68.17 | 13.06 | 19.2 | |
| Chapala | 26.50 | 100.00 | 66.02 | 14.14 | 21.4 | |
| Wind speed (km·h-1) | Atlacomulco | 0.18 | 6.04 | 2.55 | 0.83 | 32.5 |
| Huimilpan | 0.19 | 5.46 | 2.31 | 0.70 | 30.3 | |
| Presa Allende | 0 | 6.00 | 1.81 | 0.78 | 43.1 | |
| Angamacutiro | 0 | 5.57 | 1.79 | 0.94 | 52.5 | |
| Chapala | 0.07 | 4.93 | 2.14 | 0.62 | 28.9 |
Table 6 shows that the highest Pearson linear correlation coefficients were found by relating ETo to relative humidity and radiation. In four of the five stations analyzed, the climatic parameter with the highest correlation coefficient was relative humidity, indicating that this parameter is dominant in the evapotranspiration process at the sites studied. These results coincide with those reported by Eslamian et al. (2011) and Gong et al. (2006) in Iran and China, respectively.
Table 6 Pearson linear correlation of the reference evapotranspiration at each station with the climatological variables used.
| Atlacomulco | Huimilpan | Presa Allende | Angamacutiro | Chapala | |
|---|---|---|---|---|---|
| Radiation | 0.78 | 0.79 | 0.84 | 0.75 | 0.68 |
| Relative humidity | -0.84 | -0.85 | -0.80 | -0.78 | -0.80 |
| Temperature | 0.45 | 0.58 | 0.59 | 0.66 | 0.68 |
| Wind speed | 0.12 | 0.09 | 0.09 | 0.001 | -0.04 |
Figure 3 shows that the behavior of the monthly-level daily ETo average has a decreasing pattern as the rainy season progresses; in addition, the differences found at each site analyzed are observed. The ETo at the Chapala station is, on average, 30 % higher than that of Atlacomulco, while Presa Allende exhibits an ETo 52 % higher than that of Atlacomulco. The same figure shows the similar behavior of ETo at the Huimilpan and Chapala stations, which did not show statistically significant differences in the average daily magnitude of ETo (Table 3).
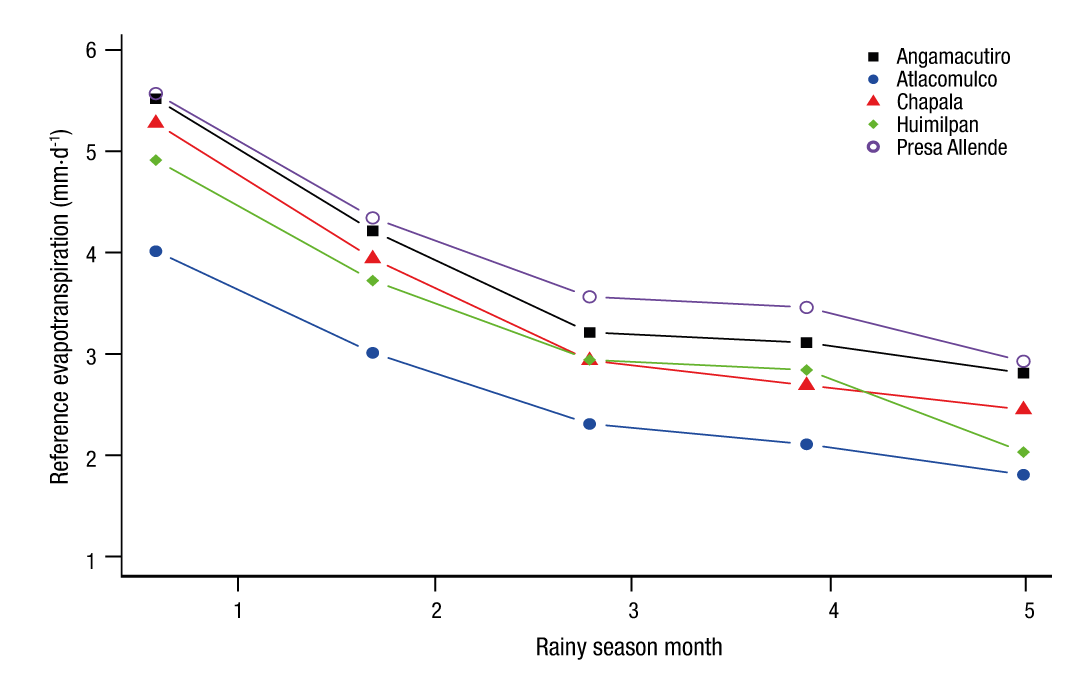
According to the monthly average, it was found that the percentage decrease in ETo during the first two months of the rainy season is within the range of 40 to 50 % of the value calculated at its beginning. This behavior can be viewed as normal if it is considered that, in order for evapotranspiration to occur, there needs to be water availability, energy availability to carry out the water phase change and an air humidity deficit (Allen et al., 2006). Thus, it is to be expected that at the beginning of the rainy season the availability of energy presents its maximum values and relative humidity its low values, which produces high ETo levels. As the rainy season progresses, the available energy decreases due to the presence of cloudiness and the relative humidity increases because of the rainfall that occurs, resulting in a decrease in the magnitude of ETo.
In the interannual behavior of daily ETo, seasonally averaged, it can be seen that during the ten years analyzed the value of the lowest ETo was maintained at the Atlacomulco station, intermediate at Chapala and high at Presa Allende (Figure 4). The same figure shows that all stations exhibit significant fluctuations in the values calculated from one year to the next, which range from -19 to 38 % with respect to the value calculated the previous year in the case of Atlacomulco, between -12 and 26 % at Huimilpan, between -9 and 12 % at Presa Allende, between -12 and 28 % at Angamacutiro and between -31 and 42 % at Chapala.

Figure 4 also shows that the lowest fluctuations occur at the Presa Allende station, suggesting the presence of a homogeneous climate in this part of the basin. The highest fluctuations were found at the Chapala station, where there is the highest energy availability (Table 5), in addition to the presence of Lake Chapala, which can significantly influence ETo behavior. Among the ETo fluctuations observed, the years 2005 and 2009 stand out, since in the first one significant increases were observed (22 to 42 %) with respect to the value observed the previous year in three of the five analyzed stations, while in the second one the indicated increase (7 to 38 %) was observed at all stations (Figure 4).
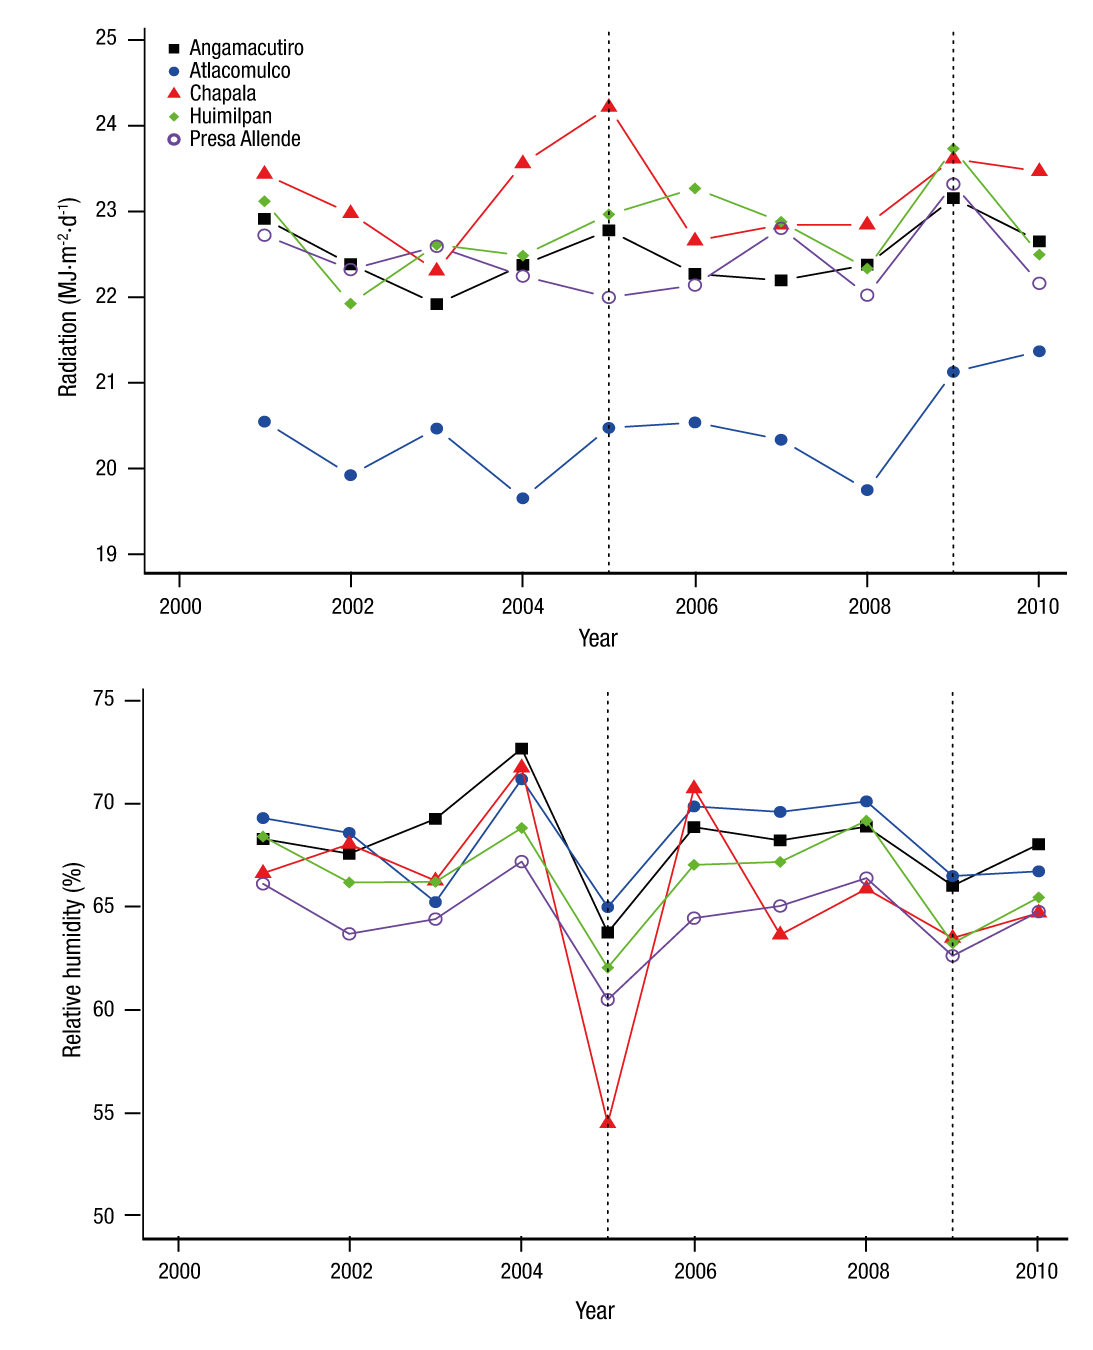
On the other hand, the interannual behavior of radiation and relative humidity is presented in Figure 5. In 2005 there were increases in radiation levels ranging from 1.8 to 4.2 % of the values observed the previous year, while in relative humidity there were decreases in the range of 8.7 to 24 % compared to 2004. In 2009, increases in radiation were in the range of 3.4 to 7 %, and the decrease in relative humidity between 3.6 and 8.5 %, both parameters relative to the values measured the previous year. These results show that the peak ETo observed in 2005 was mainly influenced by the decrease in relative humidity, while in 2009 the increase indicated in ETo is a product of both the increase in radiation and the decrease in relative humidity. This shows that the sites under study have experienced significant increases in ETo levels, probably caused by the behavior of radiation and relative humidity.
Goyal (2004) states that changes in climatic parameters may affect evapotranspiration, which is in line with what is reported in this paper, and may specifically affect crop water needs, especially in the case of rainfed agriculture. This type of agriculture has as a limiting factor the lack of sources additional to rain to irrigate crops, which results in low productivity that can even lead to economic losses (Eslamian et al., 2011).
Conclusions
Evapotranspiration (ETo) during the rainy season follows a decreasing pattern characterized by being non-linear, showing the most significant decline during the first two months, which is a product of high energy availability and low relative humidity observed at the start of that season. ETo showed a similar behavior among the sites studied, which was differentiated only by the magnitude observed, which had statistically significant differences in most of the stations. The observed ETo values are within the internationally reported ranges for humid and sub-humid climates, in the tropics and subtropics.
ETo behavior, in the analyzed stations, does not depend on the elevation of the site; however, it was observed that site elevation can have a significant impact on the magnitude of evaporative demand. Results of the ETo correlation analysis, with the climatological variables used, show that ETo behavior in the sites studied mainly depends on the observed relative humidity and solar radiation values.
The results obtained can serve as a basis for determining the water requirements of rainfed crops in areas close to the study sites. In addition, the values obtained show the need to formulate strategies aimed at reducing the probability of crop losses due to fluctuations that can occur in ETo, and thereby meet crop water needs.

