


 texto en
  Inglés (pdf)
 Artículo en XML
 Referencias del artículo
 Enviar artículo por email
 Citado por SciELO
  Similares en
SciELO
Similares en
SciELO 
 Permalink
Introduction
Cooling of fruit and vegetable products involves the rapid removal of field heat to reduce the temperature to a value close to that of storage. Cooling is used in food technology, in general, to reduce metabolic activity and extend shelf life (Espinosa-Solares et al., 2014). In the case of handling fresh fruit and vegetable products, cooling is applied to slow the metabolism and the rate of decay prior to postharvest transport and handling (Defraeye, Verboven, Opara, Nicolai, & Cronjé, 2015; Brosnan & Sun, 2001).
In air cooling, which is one of the most commonly used methods, the fluid is made to circulate at low temperature between the hollow spaces left by the product, causing a heat flow inside it towards this fluid and thence towards the outside of the packed units through a forced convection mechanism (Ferrua & Singh, 2011; Thompson, Mitchell, & Kasmire, 2002). When air flows through the porous region left by the product, it undergoes a pressure drop and, to compensate for it, fans whose dimensioning strongly depends on the magnitude of this pressure drop are used (Amanlou & Zomorodian, 2011). In different studies (Alvarez, Bournet, & Flick, 2003; Amanlou & Zomorodian, 2011; Dehghannya, Ngadi, & Vigneault, 2010; Delele et al., 2008), it has been postulated that the Ergun equation (Ergun, 1952) can be used to represent the pressure drop, relating it to parameters such as porosity, the characteristics of the packed objects, the properties of the fluid and the velocity thereof.
The Ergun equation has been used to adequately predict the pressure drop in processes such as towers of packed particles (Seader, Henley, & Roper, 2011). However, its application is subject to compliance with certain criteria; among them, the ratio of the diameter of the container to the particle diameter must be greater than 10 and also the porosity must be greater than 50 %. Because such criteria are often not met, in different studies involving fluid flow in porous media the need to review the structure of the Ergun equation in order to get a better representation of the pressure drop has been shown (Alvarez et al., 2003; Alvarez & Flick, 2007; Karimpour, Safdari, Mousavian, & Zadakbar, 2008). In this context, the aim of the present study was to evaluate the application of the Ergun equation to estimate the pressure drop in a packed system similar to that used in cooling systems for fruit and vegetable products.
Materials and methods
Object of study
A PVC pipe 3.0 m in length and 15.5 cm in diameter (D L ) was used. At the inlet an air feed system consisting of a centrifugal fan and a butterfly valve, where five positions for flow control were marked, was connected. At the outlet a reducing nozzle of 7 cm in diameter (D e ), where the linear velocity of the air was assessed, was placed. At 2.0 m away from the intake point, two wire grids were placed 30.0 cm apart. The space between the grids was filled with Styrofoam spheres and represented a macroporous medium similar to a fruit packing unit placed in a cooling process, with lateral air entry. It was proposed that the pressure drop ((P, Pa) can be represented with the Ergun model (Equation 1):
where ( is the density (kg·m-3) of the air at the average pressure between the inlet and outlet; G 0 is the mass flux (kg·s-1·m-2) of the fluid, expressed as the product [(·v 0 ]; v 0 is the superficial velocity, which represents the average linear velocity (m·s-1) that the fluid would have in the package if there were no product; D p is the diameter (m) of the filling unit (a sphere in this c ase), expressed by the quotient (6·a v -1 ); a v is the specific surface of particles in bed, given as the ratio of the total surface of filling objects (adding all units) to the volume of the packing; L is the length (m) of the porous bed in the flow direction; Ɛ is the porosity or void fraction (dimensionless) and Re is the Reynolds number (dimensionless). Additionally, k 1 and k 2 are constants characteristic of the Ergun equation, with values of 150 and 1.75, respectively.
Research structure
Two research stages were conducted. In the first, the effectiveness of the Ergun equation for estimating the pressure drop ((P est ) through the packed unit was assessed. In the second, the constants k 1 and k 2 of Equation (1) were calibrated to optimize the (P est prediction.
Evaluation of the Ergun equation
An experiment at two thermal conditions, one in the range of 10 to 12 °C and the other from 24 to 26 °C, was performed. Five sizes of packed objects consisting of Styrofoam spheres, which are generically named as particles or filling objects, were tested. In each case a sufficient number of particles were placed in the pipe to attain the packing equivalent to what it would normally have with biological material. Thus, the diameters (D p ) used and the number of objects housed (N) were: 2, 3, 4, 5 and 7 cm, with 772, 215, 86, 42 and 14 objects, respectively. For each particle size the Ɛ was evaluated using Equation 2, where V L is the volume of the porous bed (0.00566 m3) and V p the volume of a filling object (Equation 3).
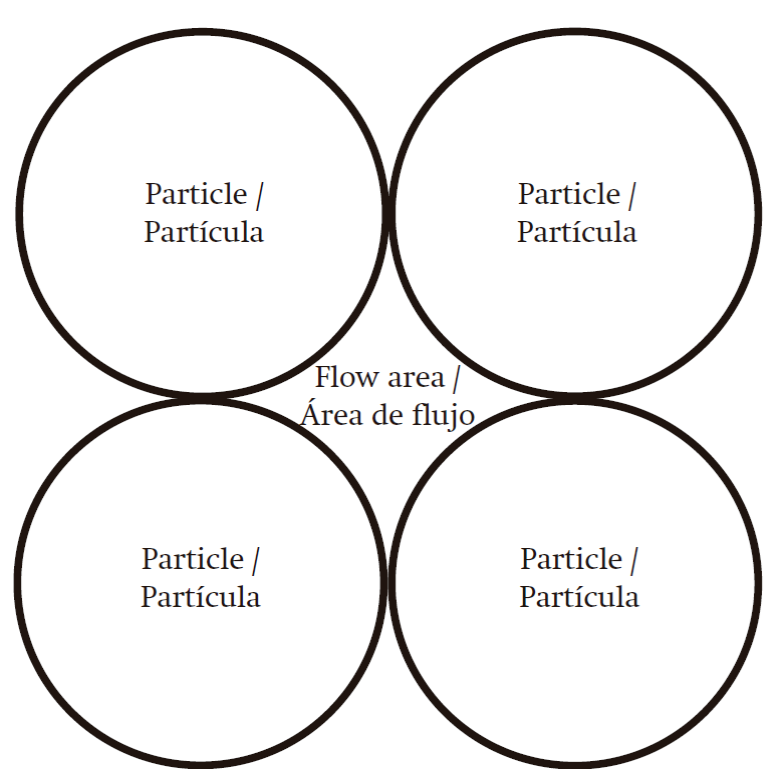
Using Equation 4 and based on Figure 1, the hydraulic diameter (D h ) of the airflow area in the porous bed was determined for each particle size.
Additionally, for each D
p
, five airflow conditions in the pipe (F
1
, F
2
, F
3
, F
4
and F
5
), controlled by the butterfly valve positions, were tested. This
structure resulted in 25 experimental conditions, which represented treatments (D
p
-F
j
). Each treatment was subjected, in triplicate, to experimental
measurement of pressure drop (∆P
exp
) through a data acquisition system (LabQuest, Vernier Software &
Technology, LLC, USA) equipped with a sensor for measuring gauge pressure.
Additionally, the air velocity was measured (v
e
, m·s-1) at the outlet of the packed unit with an anemometer
(Kestrel 4000 Pocket Weather Meter, USA). The flow was calculated (
Finally, the Ergun model (Equation 1) was used to obtain an estimated value of the pressure drop ((P est ), considering the original values of k 1 = 150 and k 2 = 1.75.
Calibration of the Ergun equation
Based on the experimental data, the parameters k 1 and k 2 of Equation 1 were calibrated numerically, using an ordinary least squares approach; for this, the lsqnonlin.m subroutine, available in the MatLab® optimization toolbox (The Mathworks Inc., 1990-2006), with the Levenberg-Marquardt optimization algorithm, was used. In this process, the nominal values k 1 = 150 and k 2 = 1.75 were taken as reference. For both parameters, the domain restrictions given by Equations 9 and 10, respectively, were defined. Also, the function f(x) to minimize was shown by Equation 11, where (P exp corresponds to the experimental data and (P est to the data calculated with Equation 12:
Data analysis
The experimental evaluation of the pressure drop was performed in a manner consistent with a 2 × 5 × 5 factorial design, wherein the variation factors were temperature (ranges from 10 to 12 and 24 to 26 °C), the diameter of filling elements (2, 3, 4, 5 and 7 cm) and flow control, given by five valve opening positions in the feed. The data were subjected to analysis of variance and comparison of means tests using the Tukey statistic (α = 0.05). The experimental pressure drop data were compared with the estimates of the Ergun model through comparison of means tests performed with the Tukey statistic (α = 0.05). All analysis was performed using the Statistical Analysis System statistical package, ver. 8.0 (SAS, 1999).
Results and discussion
Void fraction (Ɛ) and hydraulic diameter (D h )
The Ɛ ranged between 0.43 and 0.56, and increased linearly as the particle diameter increased (R2 = 0.9873, Figure 2). In the case of D h , the variation was in the range of 0.55 to 1.91 cm and a linear increase with D p was also taken, although in this case the values are based on the theoretical arrangement of the particles (Figure 1, Equation 4), thus the coefficient of determination (R2) was equal to unity.
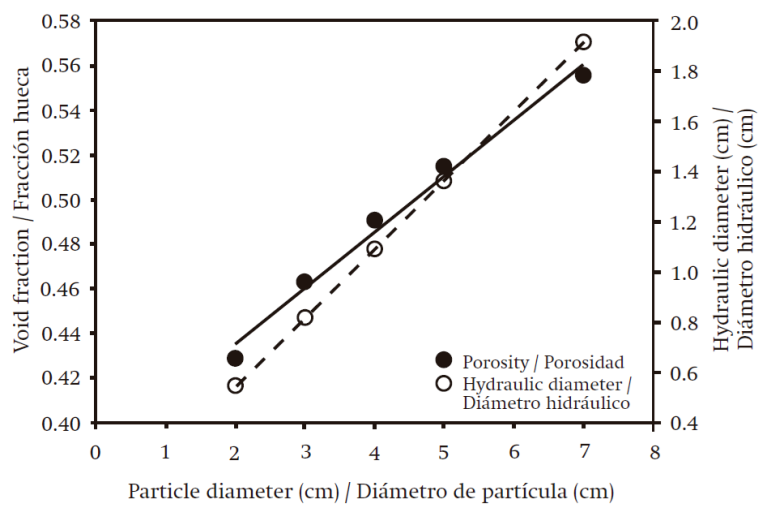
Figure 2 Relationship of the void fraction (Ɛ) and hydraulic diameter (D h ) with the filling particle diameter (D p ) in the packed bed.
Table 1 Effect of temperature, particle diameter and valve opening on volumetric flow rate, Reynolds number and pressure drop in the macroporous bed.
| Variation factor | Volumetric flow rate (m3·s-1) | Reynolds number (dimensionless) | Pressure drop (Pa) |
|---|---|---|---|
| Temperature (T) | |||
| 10 a 12 °C | 0.0201 b | 4876.76 b | 274.93 a |
| 24. a 26 °C | 0.0218 a | 5243.49 a | 257.07 b |
| HSD | 0.0004 | 97.96 | 13.547 |
| Particle diameter (Dp) | |||
| 2 cm | 0.0182 d | 1727.48 e | 438.67 a |
| 3 cm | 0.0199 c | 3007.27 d | 313.33 b |
| 4 cm | 0.0214 b | 4559.33 c | 229.33 c |
| 5 cm | 0.0219 b | 6100.11 b | 206.76 |
| 7 cm | 0.0232 a | 9906.43 a | 142.81 |
| HSD | 0.0008 | 216.72 | 29.95 |
| Valve opening (AV) | |||
| AV1 | 0.0350 a | 8615.70 a | 554.67 a |
| AV2 | 0.0277 b | 6733.73 b | 386.15 b |
| AV3 | 0.0194 c | 4652.53 c | 220.94 c |
| AV4 | 0.0137 d | 3244.21 d | 118.43 d |
| AV5 | 0.0088 e | 2054.46 e | 50.33 e |
| HSD | 0.0008 | 216.72 | 29.95 |
| Interaction effects | |||
| T*Dp | Ns | Ns | ns |
| T*AV | Ns | Ns | ns |
| Dp*AV | ** | ** | ** |
| Coefficient of variation | 5.45 | 5.98 | 15.73 |
Means with the same letters do not differ statistically. HSD: Honest significant difference (Tukey, P ≤ 0.05). ns, **: not significant and significant.
Volumetric flow rate
The volumetric flow rate varied between 8.8 and 35.0 L·s-1 and the control valve positions allowed flows that were significantly different to each other (P ≤ 0.05, Table 1). At higher temperature there was 8.5 % more flow. In the air, as the temperature increases the density is reduced, but the viscosity increases (Kundu et al., 2012). The ratio of viscosity to density represents momentum diffusivity (δ, m2·s-1) and, based on Newton's Law of Viscosity (Bird, Stewart, & Lightfoot, 2006), the increase in temperature should correspond to greater momentum transport between the fluid and the packed particles, hindering the flow. However, the empirical evidence showed that there was actually greater velocity, suggesting the rearrangement of the particles when passing from the low to high temperature condition in the experimentation system.
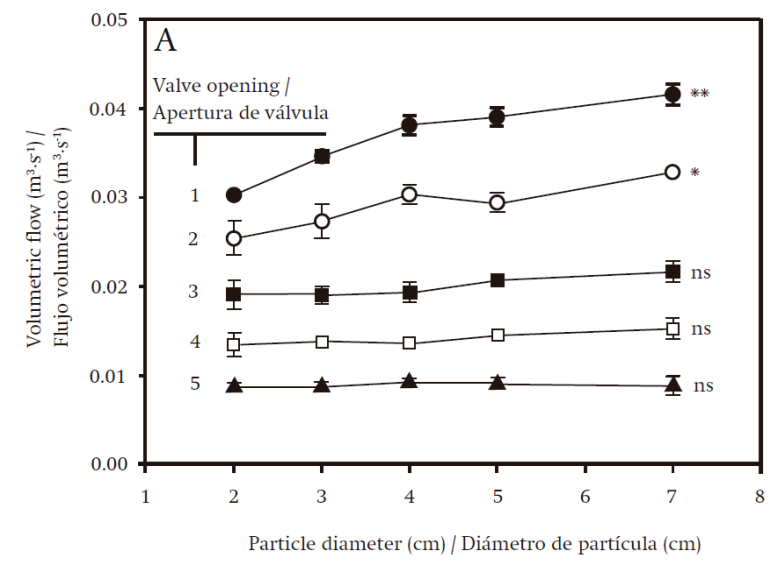
Similarly, the diameter of the filling particles affected the flow, and as the size thereof increased the flow was also higher (P ≤ 0.05). This situation was expected, since as the particle diameter was greater, porosity and hydraulic diameter also increased (Figure 2). Tortuosity is a measure of the lack of linear paths and lack of parallel currents in the flow of a fluid in a packed bed (Matyka, Khalili, & Koza, 2008). Thus, as Ɛ and D h increased, the moving fluid found higher flow areas, which meant less tortuosity, thereby facilitating increased flow. On the other hand, there was significant interaction (P ≤ 0.05) between the valve opening levels and particle diameter (Table 1), since with the largest opening the largest diameter of the filling spheres allowed greater flow, but at a lesser opening the diameter of the filling objects caused no variation in flow (Figure 3).
Reynolds number
The Reynolds number ranged between 2,054.5 and 8,615.7. In packed columns, the transition from laminar to turbulent flow occurs with values of between 10 and 1,000 (Bird et al., 2006), indicating that there was turbulent flow in all tested conditions. Just as happened with the volumetric flow rate, the Reynolds number was affected by temperature and was higher in the 24-26 °C condition, although the contrast was only 7.5 % compared to the value observed in the 10-12 °C condition, and can have no practical significance. Also, the Reynolds number was affected by the size of the packed particles, and had significantly higher values with the larger particles than the smaller ones (P ≤ 0.05, Table 1), which is explained by the larger hydraulic diameters and greater porosity. Similarly, in a manner consistent with the increased flow obtained by further opening the valve, the Reynolds number increased as the flow increased.
Experimental pressure drop
The pressure drop varied between 50 and 555 Pa. This loss was greater in proportional form to the volumetric rate in which there was greater turbulence, which was established by larger Reynolds numbers. However, the pressure drop was reduced as the size of the packed bed particles increased, and this confirmed that there was less tortuosity as the hydraulic diameter increased. The pressure drop was also affected by temperature. Higher values occurred with the lowest thermal condition, and it is believed that this occurred due to a rearrangement of the particles that allowed greater flow, whereas the pressure drop was lower at the highest temperature.
Pressure drop prediction
The pressure drop is one of the most important elements to consider in designing a cooling process, because the dimensioning of fans in forced-air systems is based on this parameter (Amanlou & Zomorodian, 2011). Although eventually this variable can be determined experimentally, it is more useful to have mathematical relationships that allow an adequate prediction. In the present study the performance of the Ergun model (Equation 1) with the original constants k 1 = 150 and k 2 = 1.75 was assessed, in order to predict the pressure drop in the packed system used in the experimental phase. The prediction data were compared with the experimental information, and it was found that in both thermal conditions there was significant (P ≤ 0.05) discrepancy between the two data sets and, according to Figure 4, the Ergun model in its original format clearly underestimated the measurements, with average prediction errors on the order of 72.2 %.
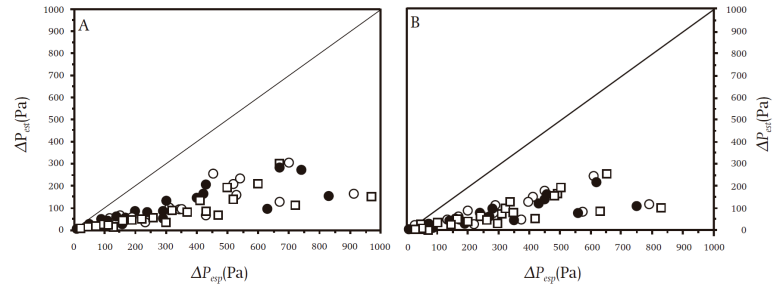
Figure 4 A 1: 1 representation between the pressure drop data calculated with the original Ergun equation and the experimental data. Panels A and B correspond to the thermal conditions of 10 to 12 and 24 to 26 °C, respectively. The symbols ●, ○ and □ indicate different replications. The reference diagonal shows the condition of similarity between experimental and calculated data.
In addition, the application of comparison of means routines using the Tukey statistic (α = 0.05) showed that while at experimental level an average pressure drop of 266.0 Pa was recorded, the original Ergun model predicted a significantly different value of 72.0 Pa. By submitting the data to comparison of means routines, an honest significant difference (HSD) equal to 49.5 Pa (Table 2), which was lower than the prediction error, was obtained, confirming the original model’s poor ability to reproduce the experimental data. This situation was consistent with the fact that the Ergun equation, in its original format, describes the laminar and transitional flow region in packed particle beds. In the present work, however, turbulent regime flow conditions were used (see Reynolds number subsection), which explains the discrepancy between the estimated and calculated values.
Table 2 Evaluation of pressure drop in packed beds of spherical particles.
| Method of evaluating pressure drop | (P (Pa) | E (%) |
|---|---|---|
| Experimental | 266.0 a | --- |
| Prediction with original Ergun equation | 71.7 b | 72.2 |
| Prediction with calibrated Ergun equation | 250.9 a | 29.8 |
| HSD | 49.5 | --- |
Means with the same letters do not differ statistically. HSD: honest significant difference (Tukey, P ≤ 0.05).
DP: pressure drop and E: prediction error in relation to experimental data.
In this regard, it was necessary to develop calibration routines of the constants k 1 and k 2 of Equation 1. Applying the ordinary least squares method through the MatLab® optimization toolbox’s lsqnonlin.m subroutine (The Mathworks Inc., 1990-2006) produced the values of k 1 = 10,628.67 (± 4,636.97) and k 2 = 3.44 (± 0.96). When these calibrated parameters were used in Equation 1, a better estimate of the pressure drop in the packed bed (Figure 5) was obtained, with average values of 250.9 Pa. Although this magnitude still differed by 29.8 % compared to the experimental data, applying the comparison of means routines with the calibrated Ergun equation achieved a pressure drop prediction that was statistically equal to the average value of 266.0 Pa obtained experimentally (Table 2). This finding was confirmed with a HSD value (49.5 Pa) higher than the prediction error. However, the discrepancy still observed suggests that there may be elements of the studied system that have not been taken into account, which is a common situation because usually any mathematical model can represent some characteristics of the phenomenon but not all (Vargas-Castañeda, Ibáñez-Castillo, & Arteaga-Ramírez, 2015).
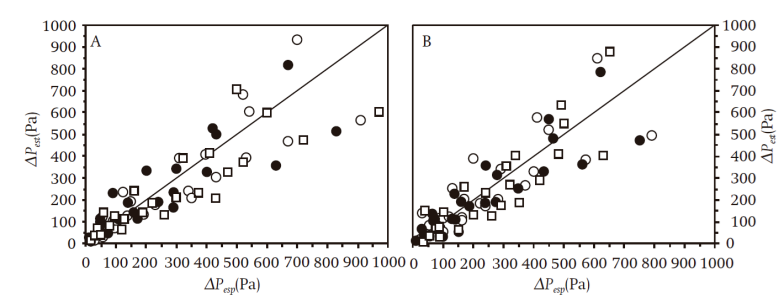
Figure 5 A 1:1 representation between the pressure drop data calculated with the calibrated Ergun equation and experimental data. Panels A and B correspond to the thermal conditions of 10 to 12 and 24 to 26 °C, respectively. The symbols ●, ○ and □ indicate different replications. The reference diagonal shows the condition of similarity between experimental and calculated data.
Additionally, the above results were verified using the differential evolution algorithm (Price, Storn, & Lampinen, 2005), which is considered a global optimization method known for its effectiveness and efficiency in solving multimodal problems. The valuesobtained were again k 1 = 10,628.67 and k 2 = 3.44, which are the same as those obtained by ordinary least squares. This allows deducing that the estimate was correct. Therefore, the flow dynamics in the tubular system used as a cooling device behaves according to Equation 13, which is a calibrated Ergun equation:
However, based on Figure 5, as the pressure drop increased so did the discrepancy between the experimental and calculated data, which was more apparent from 400 Pa, so this value was considered to be the usefulness limit of the proposed model.
Conclusions
The Ergun equation, in its original format, did not adequately estimate the pressure drop in a macroporous medium similar to a fruit and vegetable cooling system operating under turbulent flow conditions. For an adequate estimate, the characteristic parameters of the Ergun equation must be calibrated. Applying an ordinary least squares method is a useful alternative for calibrating the characteristic parameters of the Ergun equation. Due to the geometry of the packed objects in the cooling system, the results are applicable to fruit such as apples, oranges, peaches, lemons and plums, among others.

