SciELO - Scientific Electronic Library Online

 
vol.29 número2Partición de la precipitación en dos arbóreas leguminosas nativas en la región Andina, ColombiaCrecimiento de plantas de Pinus arizonica Engelm. inoculadas con Pisolithus tinctorius y Astraeus hygrometricus en invernadero índice de autoresíndice de materiabúsqueda de artículos
Home Pagelista alfabética de revistas  

Servicios Personalizados

Revista

Articulo

Indicadores

Links relacionados

  • No hay artículos similaresSimilares en SciELO

Compartir


Revista Chapingo serie ciencias forestales y del ambiente

versión On-line ISSN 2007-4018versión impresa ISSN 2007-3828

Rev. Chapingo ser. cienc. for. ambient vol.29 no.2 Chapingo may./ago. 2023  Epub 05-Abr-2024

https://doi.org/10.5154/r.rchscfa.2022.09.063 

Scientific articles

Loss of riparian vegetation cover due to dewatering of the Pitillal River in Jalisco

Eréndira Canales-Gómez1 
http://orcid.org/0000-0002-1297-2822

Karen E. Peña-Joya1  * 
http://orcid.org/0000-0002-7237-5894

Bartolo Cruz-Romero1 
http://orcid.org/0000-0002-2981-0301

Jorge Téllez-López1 
http://orcid.org/0000-0002-2313-7400

1Universidad de Guadalajara, Centro Universitario de la Costa, Laboratorio de Ecología, Paisaje y Sociedad. Av. Universidad núm. 203, Delegación Ixtapa. C. P. 48280. Puerto Vallarta, Jalisco, México.


Abstract

Introduction:

Anthropogenic disturbances such as dredging affect the structural and functional components of riparian forests, compromising their capacity to provide ecosystem services.

Objectives:

To quantify the loss of vegetation cover of a riparian forest by dredging activities in the Pitillal River (Puerto Vallarta, Jalisco).

Materials and methods:

The multispectral NDVI index was used with land use and vegetation change matrices to determine the extent, loss of vegetation cover and impact at the time of dredging and one year after the event.

Results and discussion:

The dredging area was 6.93 ha, of which 2.82 ha (40.7 %) were severely affected areas with total loss of vegetation cover; bare soil increased in surface area by 736 %. One year after clearing, the beginning of a succession process was identified, with bare soil being replaced by herbaceous plants and shrubs.

Conclusion:

This forest was severely damaged by dredging but showed possible recovery after the impact.

Keywords: spatial analysis; anthropic disturbances; succession process; bare soil; land use

Resumen

Introducción:

Los disturbios antrópicos como los desazolves afectan los componentes estructurales y funcionales de los bosques riparios, comprometiendo su capacidad de proveer servicios ecosistémicos.

Objetivos:

Cuantificar la pérdida de cobertura vegetal de un bosque ripario por acciones de desazolve en el río Pitillal (Puerto Vallarta, Jalisco).

Materiales y métodos:

Se utilizó el índice multiespectral NDVI en conjunto con matrices de cambio de uso de suelo y vegetación para determinar la extensión, pérdida de cobertura vegetal e impacto al momento del desazolve y un año después del suceso.

Resultados y discusión:

La superficie de desazolve fue 6.93 ha, de las cuales 2.82 ha (40.7 %) fueron áreas severamente afectadas con pérdida total de cobertura vegetal; el suelo desnudo incrementó superficialmente en 736 %. Un año después del desazolve se identificó el inicio de un proceso de sucesión, siendo el suelo desnudo reemplazado por herbáceas y arbustos.

Conclusión:

El bosque presentó daño severo a causa del desazolve, pero mostró posible recuperación después del impacto.

Palabras clave: análisis espacial; disturbios antrópicos; proceso de sucesión; suelo desnudo; uso de suelo

Highlights:

  • The dredging area of the Pitillal River was 6.93 ha.

  • The areas severely affected with total loss of vegetation cover represented 40.7 %.

  • Bare soil increased in surface area by 736 %.

  • One year after dredging, bare soil was replaced by herbaceous plants and shrubs.

Introduction

The riparian forest of the Pitillal River, located in the tourist city of Puerto Vallarta, Jalisco, was intervened between the first and third week of June 2020 to carry out actions of dredging as a flood prevention measure, resulting in loss of vegetation cover. These actions generated debates and divided opinions among the population, academia and municipal government, where the main issues were the size of the impact and its possible implications. It is known that riparian forests provide a number of benefits to the biodiversity of aquatic and terrestrial environments, providing ecosystem services to human populations (Cole et al., 2020; Riis et al., 2020). These include climate regulation, erosion control, flood protection, food and timber supply, as well as intangible benefits by providing spaces for recreation, physical and mental health, cultural manifestations and cognitive development (Canales-Gómez et al., 2022; Flores-Díaz et al., 2014; Grizzetti et al., 2019; Pandey et al., 2022). However, these environments are considered among the most vulnerable in the world, due to anthropogenic activities such as land use change, channel alteration, damming, water extraction and pollution, and flood control works (Albert et al., 2020). These threats modify species composition (Brice et al., 2016), alter hydrological and sediment regimes (Van Looy et al., 2017), and diminish the capacity of these systems to provide the aforementioned ecosystem services and benefits (Pandey et al., 2022).

The Pitillal River is located in an area where accelerated urbanization processes take place, including the establishment of hotel complexes, condominiums and shopping centers at its mouth river (Cárdenas-Gómez & Rodríguez-Bautista, 2012). For several years, the lower part of the river has undergone modifications in its banks and surrounding land use. At the beginning of the 20th century, commercial banana plantations and other crops were established (Gómez-Encarnación, 2021). Among the most important alterations is the diversion of the riverbed (initiated in 1998) as a measure to prevent floods such as those occurred in 1971 and 1998 (Martínez-Hernández et al., 2014). This modification consisted of rectifying the meander near the mouth river for a distance of 1 250 m and widening the channel to 160 m and a depth of 4 m (Morales, López, 2018). Subsequent to this intervention, no maintenance actions were carried out until the dredging analyzed in this study. This favored the expansion of the vegetation, eventually forming a forest composed of forest vegetation such as willows (Salix humboldtiana Willd.), fig trees (Ficus insipida Willd.), camichines (Ficus padifolia Kunth), jarretaderas (Acacia hindsii Benth.), guamuchiles (Pithecellobium dulce [Roxb.] Benth.), guamuchilillos (Pithecellobium lanceolatum [Humb. & Bonpl. ex Willd.] Benth.) and Elephant's Ear Trees (Enterolobium cyclocarpum [Jacq.] Griseb.); grasses and herbaceous plants of rapid growth and short life cycles such as quelite (Amaranthus hybridus L.); several species of the genus Cyperus known as coquillos; shrub species such as huizache (Acacia farnesiana [L.] Willd.); and higuerilla (Ricinus communis L.) in the most disturbed sites (Aréchiga et al., 2022). Most species coincide with historical flora records (prior to 1960) for the site (Gómez-Encarnación, 2021).

Based on the above background, and given the importance of the riparian forest for the biodiversity of the region and the ecosystem services provided to the population, the objective of this study was to quantify the loss of vegetation cover in the riparian forest of the Pitillal River as a result of dredging and to evaluate the change one year after the event. The hypothesis is that dredging actions impacted the riparian forest, reducing the natural protection that these ecosystems provide against floods, thereby affecting human settlements located in the area.

Materials and Methods

Study area

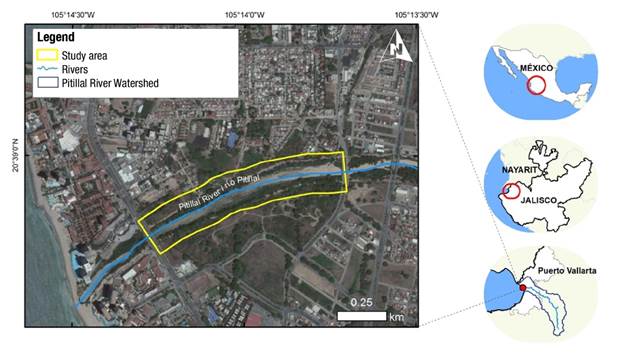
The study area includes the area of intervention for dredging the Pitillal River in June 2020. This area covers a linear distance of 1 064.5 m, next to the mouth of the water body, in the municipality of Puerto Vallarta, Jalisco, Mexico (Figure 1). For this study, a polygon of 21.29 ha was delimited from a zone of influence of 100 m on both sides of the river.

Spatial analyses

The spatial analyses were carried out based on Sentinel-2A satellite images with a spatial resolution of 10 m (European Space Agency [ESA], 2021) and considering three times: before dredging (2020/05/25), immediately after (2020/06/19) and one year later (2021/05/12). The images were automatically preprocessed with the atmospheric corrections of the Dark Object Subtraction method (Chavez, 1988) and were also automatically corrected to convert the digital numbers to reflectance values. This preprocessing was carried out using the Semi-Automatic Classification Plugin (Congedo, 2021) for QGIS 3.6 (Quantum GIS Development Team, 2016).

Vegetation cover and land use

Classification and extent of vegetation cover and land use were estimated with the Normalized Difference Vegetation Index (NDVI) (Rouse & Space, 1973). This index has been widely used for primary productivity assessment (Xiao et al., 2005), phenological monitoring (Fisher et al., 2006; Weiss et al., 2004) and vegetation classification (Jia et al., 2014), including riparian vegetation (Fu & Burgher, 2015; Jeong et al., 2016; Montilla-Pacheco & Pacheco-Gil, 2017). In addition, the sensitivity of the index allows it to be applied in the assessment of impacts and damages in the riparian zone and as a support in decision making (Gandhi et al., 2015; Yang, 2007).

NDVI is derived from arithmetic combinations between two bands related to the spectral characteristics of vegetation according to the formula NDVI = NIR - R / NIR + R; where, NIR is the atmospherically corrected reflectance corresponding to the near infrared and R is the atmospherically corrected reflectance corresponding to the red. The index includes values between -1 and 1, from which land cover and land use are classified; positive values are associated with vegetation cover. This study determined four categories based on the criteria of Cartaya Ríos et al. (2014): 1) closed vegetation, 2) open vegetation, 3) sparse vegetation, and 4) bare soil (Table 1).

Table 1 NDVI values related to land cover and land use. 

Cover and land use Description NDVI values
Closed vegetation Dense growing plants, deciduous and semi-deciduous species >0.40
Open vegetation Woody vegetation and shrubs 0.25-0.40
Sparse vegetation Sparse grasses and shrubs 0.15-0.25
Bare soil Soils with no vegetation cover, dead vegetation, buildings and rocks <0.15

Loss of vegetation cover and dredging impact

The loss of vegetation cover due to dredging activities was determined using a land cover and land use change matrix (Pontius et al., 2004). The severity of the impact was estimated from the difference in NDVI values between the date before and after the event. The values were classified into six impact categories, following the method of generating natural breaks, which is a classification based on the nature of the data (Jenks, 1967; Osaragi, 2002). The categories were: null to very low (0.59 to 0.11), very low (0.12 to 0.02), low (0.03 to -0.04), medium (-0.05 to -0.12), high (-0.13 to -0.39) and severe (-0.40 to -0.93). The area of impact was considered to be that corresponding to the high, severe and medium categories, because they represent the most significant changes in land cover and land use.

Evaluation one year after the impact

The follow-up evaluation one year after dredging included the calculation of the rate of change between June 2020 and May 2021 based on the formula proposed by FAO (Food and Agriculture Organization of the United Nations, 1995) in the land cover and land use change matrices:

δn=S2S11n-1

where,

δn = rateo f change (ha)

S1 = map area date 1 (ha)

S2 = map area date 2 (ha)

n = number of years between both dates.

The significance of spatial correspondence between maps used to identify land cover and land use change was determined by calculating the following indices (Maass & Regil García, 2010; Pérez-Rubio et al., 2021): Kappa index (Cohen, 1960), χ 2, Cramer's V index and Kappa index of agreement (KIA). The last two range from 0 to 1, with 1 indicating perfect agreement and 0 indicating a pattern due to chance (De Smith et al., 2018). These values were calculated using the IDRISI 17.02 Selva software (Eastman, 2012).

Results and Discussion

Prior to dredging, the area had 88.96 % (18.94 ha) of closed vegetative cover (Figures 2A and 3A; Table 2). Post-impact, bare soil increased from 0.47 ha to 3.93 ha, an increase of 736 % (Figure 2B; Table 2). The affected area comprised 32 % of the total area, distributed mainly along the river margin; severely impacted areas occupied 13 %, while high and medium impact represented 10 % and 9 %, respectively (Figure 2D).

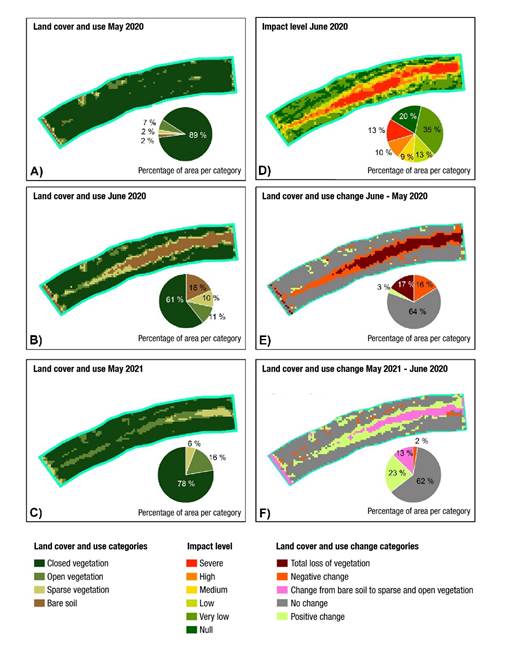
Figure 2 Land cover and land use of the study area prior to (A), immediately after (B) and one year after (C) dredging; level of impact (D) and change in cover and land use after dredging (E) and after one year (F). The graphs show the percentages of area occupied by each category. 

Table 2 Area and rate of change of cover and land use in the riparian forest affected by dredging activities in the Pitillal River. 

Cover and land use Area Rate of change 2020-2021 (ha)
may-20 jun-20 may-21
(ha) (%) (ha) (%) (ha) (%)
Closed vegetation 18.94 88.96 12.88 60.5 16.54 77.69 -3.40
Open vegetation 1.39 6.53 2.32 10.90 3.53 16.58 1.14
Sparse vegetation 0.49 2.30 2.16 10.15 1.19 5.59 -0.30
Bare soil 0.47 2.20 3.93 18.46 0.03 0.14 -1.44
Total 21.29 100 21.29 100 21.29 100

The analysis of land use change indicated that 17 % of the area registered total loss of vegetation cover and 16 % had a negative change from closed to open cover and from open to sparse cover (Figures 2E and 3B). In total, 6.49 ha occupied by closed vegetation were replaced by the three remaining coverages: bare soil, sparse vegetation and open vegetation (Table 3).

Table 3 Matrix of land cover and land use change (ha) June 2020 - May 2020. 

may-20 June 2020
Closed vegetation Open vegetation Sparse vegetation Bare soil Total (ha)
Closed vegetation 12.45 1.52 1.74 3.23 18.94
Open vegetation 0.42 0.68 0.19 0.1 1.39
Sparse vegetation 0.01 0.11 0.18 0.19 0.49
Bare soil 0 0.01 0.05 0.41 0.47
Total 12.88 2.32 2.16 3.93 21.29

Kappa index = 0.7488, χ2 = 6390.16, g. l. = 16, P < 0.001; Cramer's V = 0.5527.

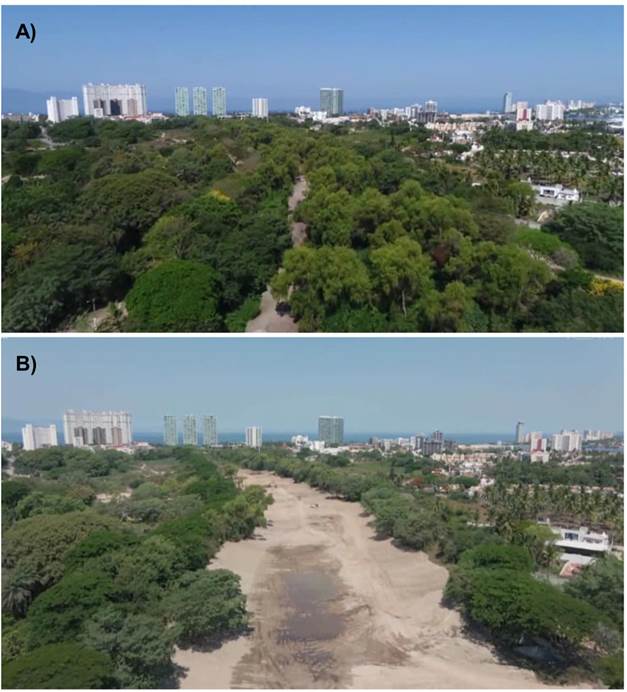
Figure 3 Panoramic view of the study area showing vegetation cover before (A) and after (B) dredging. Source: Carolina Arévalo. 

One year after the event, changes in land cover and land use in the intervened area were identified, characterized by an increase in the area corresponding to closed vegetation with a gain of 3.66 ha, which went from 12.88 ha in 2020 to 16.54 ha in 2021 (Table 2), located mainly in the area adjacent to the unchanged areas and where a medium level of impact was recorded. Furthermore, the change in the severe impact zone was notable, where bare soil was replaced by sparse and open vegetation cover (Figure 2F; Table 4). Annual rate of land cover and land use change identified a loss of 3.4 ha of closed vegetation and a gain of 1.14 ha of open vegetation (Table 2).

Table 4 Land cover and land use change matrix (ha) May 2021 - June 2020. 

June 2020 may-21
Closed vegetation Open vegetation Sparse vegetation Bare soil Total
Closed vegetation 12.42 0.46 0 0 12.88
Open vegetation 1.59 0.65 0.08 0 2.32
Sparse vegetation 1.31 0.75 0.1 0 2.16
Bare soil 1.22 1.67 1.02 0.02 3.93
Total 16.54 3.53 1.2 0.02 21.29

Kappa index = 0.7351, χ2 = 8066.19, g. l. = 20, P < 0.001; Cramer’s V = 0.5963.

Riparian forests are dynamic ecosystems with high resilience to natural disturbances (Naiman et al., 2010); however, anthropogenic disturbances such as dredging affect their structural and functional components (Cornejo-Denman et al., 2018). In this study, it was found that dredging generated loss of closed vegetation cover, especially in the area adjacent to the Pitillal riverbed. It is important to maintain such vegetation because it helps to mitigate erosion and flood impacts, regulate water quality, and maintain aquatic-terrestrial biodiversity and its associated ecosystem services (Cole et al., 2020; Riis et al., 2020). It has been documented that anti-flood measures such as the maintenance of riparian forests and reforestation in the watershed uplands provide greater benefits and better cost-benefit ratios in comparison to measures such as dredging and infrastructure construction (Daigneault et al., 2016). For example, it has been estimated that 1 ha of riparian forest can mitigate flood damages up to a value of 1 900 EUR per year (Barth & Döll, 2016). Other authors such as Gallay et al. (2021) estimate similar values (1 700 EUR) for the case of forested cover; however, such estimates are based on undisturbed riparian forests. One year after dredging, the area showed signs of the onset of a successional process, where bare ground was replaced by herbaceous and shrub cover, coinciding with that reported by Stępień et al. (2019). Suganuma and Durigan (2015) estimate that a gallery forest can reach the status of a secondary forest in a period of between 40 and 70 years. In this period, the succession process may take different trajectories depending on intrinsic and extrinsic factors, so that even after the end of succession, the area may not provide the same pre-disturbance ecosystem functions and services (Warren et al., 2016). The results of this study are a diagnosis of the impact of a deficient implementation of preventive measures against flooding, which, based on the above, could result in repercussions greater than the risk it was intended to prevent. It is important to note that, in spite of the fact that the impacts generated by dredging actions have been scientifically recorded, the government sector and some sectors of the population continue to accept this measure as a preventive alternative. According to Smith et al. (2019) this is due to an erroneous understanding of the causes that generate floods and the effects that poor urban planning has had on rivers. Therefore, conducting studies that diagnose the degradation and ecohydrological status of urban rivers is a priority for the design and implementation of specific restoration measures that mitigate the consequences of vegetation cover loss and other historical alterations (Cochero et al., 2016; Guimarães et al., 2021).

Conclusions

Dredging activities in the Pitillal River had an impact on the gallery forest, most classified as high and severe. Most of the disturbed area changed from natural vegetation cover to bare soil, sparse vegetation and open vegetation. Because of the impact caused, conservation and restoration actions are needed to protect the natural barriers that gallery forests provide in this area. Government and some sectors of the population continue to accept dredging as a preventive alternative. Therefore, it is necessary to increase interventions in terms of scientific dissemination and environmental education that promote awareness and the participation of civil society to demand efficient and sustainable solutions.

Acknowledgments

This research was supported by Project No. 266080 through the Programa de Fortalecimiento de la Investigación y el Posgrado de la Universidad de Guadalajara granted to the Laboratorio de Ecología, Paisaje y Sociedad, CUCOSTA-UdeG and by Project No. 265189 of the Program to Programa de Apoyo a la Mejora en las Condiciones de Producción de los Miembros del SNI y SNCA (PROSNI).

References

Albert, J. S., Destouni, G., Duke-Sylvester, S. M., Magurran, A. E., Oberdorff, T., Reis, R. E., Ripple, W. J. (2020). Scientists’ warning to humanity on the freshwater biodiversity crisis. Ambio, 50, 85‒94. https://doi.org/10.1007/s13280-020-01318-8 [ Links ]

Arechiga, J., Esquivel, T., Camacho, A., Delgado-Rodríguez, M. R., Vargas-González, P., & Quijas, S. (2022). Diversidad florística y estructural de la vegetación riparia a lo largo de un gradiente urbano-natural del río Pitillal, Jalisco, México. Revista U. D. C. A. Actualidad & Divulgación Científica, 25(1), 1‒14. https://doi.org/10.31910/rudca.v25.nSupl.1.2022.2196 [ Links ]

Barth, N.-C., & Döll, P. (2016). Assessing the ecosystem service flood protection of a riparian forest by applying a cascade approach. Ecosystem Services, 21, 39‒52. https://doi.org/10.1016/j.ecoser.2016.07.012 [ Links ]

Brice, M. -H., Pellerin, S., & Poulin, M. (2016). Environmental filtering and spatial processes in urban riparian forests. Journal of Vegetation Science, 27(5), 1023‒1035. https://doi.org/10.1111/jvs.12425 [ Links ]

Canales-Gómez, E., Díaz-Gómez, R., Cervantes-Ríos, J., & Téllez-López, J. (2022). Mapeo y amenazas de los servicios ecosistémicos culturales de la pesca artesanal para el desarrollo regional en una subcuenca antropizada del occidente de México. Revista EURE-Revista de Estudios Urbano Regionales, 48(143), 1‒16. https://doi.org/10.7764/EURE.48.143.10 [ Links ]

Cárdenas-Gómez, E. P., & Rodríguez-Bautista, J. J. (2012). La transformación urbana de Puerto Vallarta, Jalisco. Espacios Públicos, 15(34), 208‒230. https://www.redalyc.org/pdf/676/67623463016.pdfLinks ]

Cartaya Ríos, S., Zurita Alfaro, S., Rodríguez Ríos, E., & Montalvo Párraga, V. (2014). Comparación de técnicas para determinar cobertura vegetal y usos de la tierra en áreas de interés ecológico, Manabí, Ecuador. UD y la Geomática, 9, 5‒17. https://doi.org/10.14483/23448407.7883 [ Links ]

Chavez, P. S. (1988). An improved dark-object subtraction technique for atmospheric scattering correction of multispectral data. Remote Sensing of Environment, 24(3), 459‒479. https://doi.org/10.1016/0034-4257(88)90019-3 [ Links ]

Cochero, J., Cortelezzi, A., Tarda, A. S., & Gómez, N. (2016). An index to evaluate the fluvial habitat degradation in lowland urban streams. Ecological Indicators, 71, 134‒144. https://doi.org/10.1016/j.ecolind.2016.06.058 [ Links ]

Cohen, J. (1960). A coefficient of agreement for nominal scales. Educational and Psychological Measurement, 20(1), 37‒46. https://doi.org/10.1177/001316446002000104 [ Links ]

Cole, L. J., Stockan, J., & Helliwell, R. (2020). Managing riparian buffer strips to optimize ecosystem services: A review. Agriculture, Ecosystems & Environment, 296, 106891. doi: https://doi.org/10.1016/j.agee.2020.106891 [ Links ]

Congedo, L. (2021). Semi-automatic classification plugin: A Python tool for the download and processing of remote sensing images in QGIS. Journal of Open Source Software, 6(64), 3172. https://doi.org/10.21105/joss.03172 [ Links ]

Cornejo-Denman, L., Romo-Leon, J., Castellanos, A., Diaz-Caravantes, R., Moreno-Vázquez, J., & Mendez-Estrella, R. (2018). Assessing riparian vegetation condition and function in disturbed sites of the arid Northwestern Mexico. Land, 7(1), 13. http://doi.org/10.3390/land7010013 [ Links ]

Daigneault, A., Brown, P., & Gawith, D. (2016). Dredging versus hedging: Comparing hard infrastructure to ecosystem-based adaptation to flooding. Ecological Economics, 122, 25‒35. https://doi.org/10.1016/j.ecolecon.2015.11.023 [ Links ]

De Smith, M. J., Goodchild, M. F., & Longley, P. A. (2018). Geospatial analysis: A comprehensive guide to principles, techniques and software tools (6th ed.). The Winchelsea Press. [ Links ]

Eastman, J. R. (2012). IDRISI Selva. Guía para SIG y procesamiento de imágenes. http://www.clarklabs.org/Links ]

European Space Agency (ESA). (2021). Copernicus Open Access Hub. https://scihub.copernicus.eu/dhus/#/homeLinks ]

Fisher, J., Mustard, J., & Vadeboncoeur, M. A. (2006). Green leaf phenology at Landsat resolution: Scaling from the field to the satellite. Remote Sensing of Environment, 100(2), 265‒279. https://doi.org/10.1016/j.rse.2005.10.022 [ Links ]

Flores-Díaz, A. C., Castillo, A., Sánchez-Matías, M., & Maass, J. M. (2014). Local values and decisions: views and constraints for riparian management in western Mexico. Knowledge and Management of Aquatic Ecosystems, 414, 6. https://doi.org/10.1051/kmae/2014017 [ Links ]

Food and Agriculture Organization of the United Nations (FAO). (1995). Forest resources assessment 1990. Author. https://www.fao.org/3/w0015e/w0015e00.htmLinks ]

Fu, B., & Burgher, I. (2015). Riparian vegetation NDVI dynamics and its relationship with climate, surface water and groundwater. Journal of Arid Environments, 113, 59‒68. https://doi.org/10.1016/j.jaridenv.2014.09.010 [ Links ]

Gallay, I., Olah, B., Gallayová, Z., & Lepeška, T. (2021). Monetary valuation of flood protection ecosystem service based on hydrological modelling and avoided damage costs. An example from the Čierny Hron River Basin, Slovakia. Water, 13(2), 198. https://doi.org/10.3390/w13020198 [ Links ]

Gandhi, G. M., Parthiban, S., Thummalu, N., & Christy, A. (2015). Ndvi: Vegetation change detection using remote sensing and Gis - A case study of Vellore District. Procedia Computer Science, 57, 1199‒1210. https://doi.org/10.1016/j.procs.2015.07.415 [ Links ]

Gómez-Encarnación, E. (2021). Crónica histórica asociada al río Pitillal, Puerto Vallarta Jalisco. Acta Pesquera, 7(13), 11‒16. http://cimateuan.education/revistav2/index.php/AP/article/view/85/98Links ]

Grizzetti, B., Liquete, C., Pistocchi, A., Vigiak, O., Zulian, G., Bouraoui, F., & Cardoso, A. C. (2019). Relationship between ecological condition and ecosystem services in European rivers, lakes and coastal waters. Science of the Total Environment, 671, 452‒465. https://doi.org/10.1016/j.scitotenv.2019.03.155 [ Links ]

Guimarães, L. F., Teixeira, F. C., Pereira, J. N., Becker, B. R., Oliveira, A. K. B., Lima, A. F., Miguez, M. G. (2021). The challenges of urban river restoration and the proposition of a framework towards river restoration goals. Journal of Cleaner Production, 316, 128330. https://doi.org/10.1016/j.jclepro.2021.128330 [ Links ]

Jenks, G. F. (1967). The data model concept in statistical mapping. In K. Frenzel (Ed.), International yearbook of cartography (vol. 7, pp. 186‒190). George Phillip. [ Links ]

Jeong, S. G., Mo, Y., Kim, H. G., Park, C. H., & Lee, D. K. (2016). Mapping riparian habitat using a combination of remote-sensing techniques. International Journal of Remote Sensing, 37(5), 1069‒1088. https://doi.org/10.1080/01431161.2016.1142685 [ Links ]

Jia, K., Liang, S., Zhang, L., Wei, X., Yao, Y., & Xie, X. (2014). Forest cover classification using Landsat ETM+ data and time series MODIS NDVI data. International Journal of Applied Earth Observation and Geoinformation, 33, 32‒38. https://doi.org/10.1016/j.jag.2014.04.015 [ Links ]

Maass, S. F., & Regil García, H. H. (2010). IDRISI como herramienta para la evaluación de Áreas Naturales Protegidas. El caso del Parque Nacional Nevado de Toluca. Revista Geográfica de América Central, 1, 127‒149. https://www.redalyc.org/pdf/4517/451744661005.pdfLinks ]

Martínez-Hernández, V., González-Ruelas, M. E., Carrillo-González, F. M., & Cornejo-López, V. M. (2014). Desastres por eventos meteorológicos y su percepción social en Puerto Vallarta, Jalisco. Acta Republicana, 13(13), 61‒70. http://148.202.18.157/sitios/publicacionesite/pperiod/republicana/pdf/ActaRep13/6.pdfLinks ]

Montilla-Pacheco, A. d. J., & Pacheco-Gil, H. A. (2017). Comportamiento temporal y espacial del bosque ribereño en el curso bajo del río Portoviejo y la Quebrada Chilán, Provincia de Manaví, Ecuador. Revista Internacional de Contaminación Ambiental, 33(1), 21‒35. https://doi.org/10.20937/RICA.2017.33.01.02 [ Links ]

Morales López, D. A. (2018). Impactos ambientales del desarrollo urbano en las márgenes del río el Pitillal en Puerto Vallarta, Jalisco, 2014 - 2016 [Tesis de Maestría, Universidad de Guadalajara]. Repositorio Institucional de la Universidad de Guadalajara. https://www.riudg.udg.mx/handle/20.500.12104/84499Links ]

Naiman, R. J., Decamps, H., & McClain, M. E. (2010). Riparia: Ecology, conservation and management of streamside communities. Elsevier Science. https://doi.org/10.1016/B978-0-12-663315-3.X5000-X [ Links ]

Osaragi, T. (2002). Classification methods for spatial data representation. https://discovery.ucl.ac.uk/id/eprint/254/1/Paper40.pdfLinks ]

Pandey, S., Kumari, T., Verma, P., Singh, R., & Raghubanshi, A. S. (2022). Impact of anthropogenic stresses on riparian ecosystem and their management perspectives. In S. Madhav, S. Kanhaiya, A. Srivastav, V. Singh, & P. Singh (Eds.), Ecological significance of river ecosystems (pp. 299‒324). Elsevier. [ Links ]

Pérez-Rubio, I., Flores, D., Vargas, C., Mende, A., & Jiménez, F. (2021). Análisis comparativo de susceptibilidad de erosión y evaluación de incertidumbre en la subcuenca del Río Claro, Costa Rica. Revista de Ciencias Ambientales, 55(1), 271‒293. http://doi.org/10.15359/rca.55-1.13 [ Links ]

Pontius, R. G., Shusas, E., & McEachern, M. (2004). Detecting important categorical land changes while accounting for persistence. Agriculture, Ecosystems & Environment, 101(2), 251‒268. https://doi.org/10.1016/j.agee.2003.09.008 [ Links ]

Quantum GIS Development Team. (2016). Quantum GIS Geographic Information System (version 2.10.1) [software]. Open Source Geospatial Foundation Project. http://qgis.osgeo.orgLinks ]

Riis, T., Kelly-Quinn, M., Aguiar, F. C., Manolaki, P., Bruno, D., Bejarano, M. D., & Dufour, S. (2020). Global overview of ecosystem services provided by riparian vegetation. BioScience, 70(6), 501‒514. https://doi.org/10.1093/biosci/biaa041 [ Links ]

Rouse, J. W., & Haas, R. H., Schell, J. A., & Deering, D. W. (1973). Monitoring the vernal advancement and retrogradation (green wave effect) of natural vegetation. Type II report for the period April 1973-September 1973. https://ntrs.nasa.gov/citations/19730017588Links ]

Smith, W. S., Da Silva, F. L., & Biagioni, R. C. (2019). River dredging: when the public power ignores the causes, biodiversity and science. Ambiente & Sociedade, 22, e00571. http:// doi.org/10.1590/1809-4422asoc0057r1vu19l1ao [ Links ]

Stępień, E., Zawal, A., Buczyński, P., Buczyńska, E., & Szenejko, M. (2019). Effects of dredging on the vegetation in a small lowland river. PeerJ, 7, e6282. https://doi.org/10.7717/peerj.6282 [ Links ]

Suganuma, M. S., & Durigan, G. (2015). Indicators of restoration success in riparian tropical forests using multiple reference ecosystems. Restoration Ecology, 23(3), 238‒251. https://doi.org/10.1111/rec.12168 [ Links ]

Van Looy, K., Tormos, T., Souchon, Y., & Gilvear, D. (2017). Analyzing riparian zone ecosystem services bundles to instruct river management. International Journal of Biodiversity Science, Ecosystem Services & Management, 13(1), 330‒341. https://doi.org/10.1080/21513732.2017.1365773 [ Links ]

Warren, D. R., Keeton, W. S., Kiffney, P. M., Kaylor, M. J., Bechtold, H. A., & Magee, J. (2016). Changing forests-changing streams: riparian forest stand development and ecosystem function in temperate headwaters. Ecosphere, 7(8), e01435. https://doi.org/10.1002/ecs2.1435 [ Links ]

Weiss, J. L., Gutzler, D. S., Coonrod, J. E. A., & Dahm, C. N. (2004). Long-term vegetation monitoring with NDVI in a diverse semi-arid setting, central New Mexico, USA. Journal of Arid Environments, 58(2), 249‒272. https://doi.org/10.1016/j.jaridenv.2003.07.001 [ Links ]

Xiao, X., Zhang, Q., Saleska, S., Hutyra, L., De Camargo, P., Wofsy, S., & Moore III, B. (2005). Satellite-based modeling of gross primary production in a seasonally moist tropical evergreen forest. Remote Sensing of Environment, 94(1), 105‒122. https://doi.org/10.1016/j.rse.2004.08.015 [ Links ]

Yang, X. (2007). Integrated use of remote sensing and geographic information systems in riparian vegetation delineation and mapping. International Journal of Remote Sensing, 28(2), 353‒370. https://doi.org/10.1080/01431160600726763 [ Links ]

Received: September 01, 2022; Accepted: March 13, 2023

*Corresponding author: karen.joya@academicos.udg.mx; tel.: +52 322 170 5006.

Creative Commons License This is an open-access article distributed under the terms of the Creative Commons Attribution License