


 texto en
  Inglés (pdf)
 Artículo en XML
 Referencias del artículo
 Enviar artículo por email
 Citado por SciELO
  Similares en
SciELO
Similares en
SciELO 
 Permalink
Highlights:
Baseline C stock (2015): Bahía del Tóbari = 52.1 Mg∙ha-1, El Sargento = 71.7 Mg∙ha-1.
Largest C stock: Avicennia germinans in Bahía del Tóbari and Laguncularia racemosa in El Sargento.
Avoided CO2e emissions (2020): Bahía del Tóbari = 69 368.2 tCO2∙TA-1 and El Sargento = 116 696 tCO2∙TA-1.
These mangroves recorded higher economic value in the voluntary carbon market than in the World Bank.
Introduction
Coastal ecosystems such as mangroves provide several ecosystem services, including carbon (C) storage (Mehvar, Filatova, Dastgheib, de Ruyter van Steveninck, & Ranasinghe, 2018). This is called blue C and accumulates in biomass and organic detritus in sediments (Herrera-Silveira, 2019), where it remains for millennia (International Union for Conservation of Nature and Natural Resources [IUCN], 2021), contributing to mitigating global warming (Sasmito et al., 2020).
Mangroves have the largest C stocks (386 Mg∙ha-1) compared to other coastal ecosystems such as salt marshes (255 Mg∙ha-1) or seagrasses (108 Mg∙ha-1) (Howard, Hoyt, Isensee, Telszewski, & Pidgeon, 2014); however, the loss of mangroves decreases biomass and releases CO2 and CH4 to the atmosphere, which reverses their C sequestration capacity and transforms them into greenhouse gas (GHG) emitters (Troxler et al., 2015). Modifications in sedimentation rate, soil erosion, and vegetation loss also cause mangroves to emit GHGs at concentrations of 66.3 % MgCO2e∙ha-1 (Kauffman, Hernández-Trejo, García, Heider, & Contreras, 2016).
From 1980 to 2005, 35 600 km2 of mangroves were destroyed (Hernández-Blanco, Costanza, & Cifuentes-Jara, 2018) on a global scale; that is, 20 % of the global area (Rossi, Archer, Giri, & Layman, 2020). In Mexico, mangrove loss is estimated at an annual rate of 2 % for the Pacific slope and 2.8 % for the Gulf of Mexico (Hernández et al., 2016). Even so, Mexico is the fifth country with the largest mangrove area (775 555 ha), which represents 5 % of the global coverage (Valderrama-Landeros et al., 2017) and 0.4 % of the national area (Comisión Nacional para el Conocimiento y Uso de la Biodiversidad [CONABIO], 2017). Therefore, it is important to quantify the C stock in mangroves and to use its economic value (EV) as a conservation strategy (Guerra-Cano, Guerra-Martínez, Urrea-Mariño, & Romero, 2020).
EV is defined as the availability of payment for goods or services or to compensate for their loss and is measured as the total EV (value of the ecosystem service in the area occupied by the ecosystem in a given period), the average value of the ecosystem by area or time, and the marginal value (value gained or lost by increases in the provision of ecosystem services) (Mehvar et al., 2018).
The EV of the C store includes replacement cost techniques (it is evaluated according to what it would cost to replace that service) and avoided costs (value of the ecosystem service that avoids expenditures for prevention and mitigation concepts) (Hernández-Blanco et al., 2018). In this context, mangroves have an ecosystem value that, expressed in economic terms, represents an incentive for their conservation (blue C). This can be obtained through international guidelines of the United Nations Framework Convention on Climate Change or national guidelines such as the National Strategy for Reducing Emissions from Deforestation and Degradation (ENAREDD+) for forests and rainforests (Commission for Environmental Cooperation [CEC], 2017). In this regard, there are two types of market for C sequestration: mandatory (regulated) and voluntary (VM), in which the purchase of GHG emission rights occurs in tons of CO2 equivalent (tCO2e) (CEC, 2017); each tCO2e is a credit (currency) of C (Food and Agriculture Organization of the United Nations [FAO], 2010) and represents the CO2 stored in biomass and soil (avoided emissions in the atmosphere).
On the other hand, C offsets consist of financing projects to reduce CO2 emissions through the purchase of C credits. These offsets have a constant price in the regulated market, but it is variable in the VM, where it is subject to the law of supply and demand (López-Toache, Romero-Amado, Toache-Berttolini, & García-Sánchez, 2016). Thus, the average prices of tCO2e in the period 2014-2018 were 3.80, 3.26, 3.10, 3.17 and 3.01 USD (Ecosystem Marketplace, 2018). In the case of Latin America, the costs of forestry and land use change projects have been quoted between 0.1 and 70 USD∙tCO2e-1 (Ecosystem Marketplace, 2018), indicating the opportunity for mangroves to access this type of funding.
The importance of the study of mangroves in Bahía del Tóbari (BT) and El Sargento (Sonora, Mexico) lies in the fact that BT is a site recognized regionally and internationally for hosting endangered species (Western Hemisphere Shorebird Reserve Network [WHSRN], 2019), while El Sargento is a pristine mangrove that maintains a high ichthyological diversity, in addition to providing a variety of ecosystem services (López-Medellín, Acosta-Velázquez, & Vázquez-Lule, 2009).
Therefore, the objective of this study was to estimate the EV of the C stocks of the aboveground biomass of the mangroves of BT and El Sargento, Sonora (Mexico), so that decision makers can implement management actions by considering the environmental values and evaluate the possibility of integrating them into financing mechanisms. This, together with Mexico's recent "unconditional" international commitments to reduce its GHG emissions by 210 million metric tons of CO2e (MtCO2e) by 2030, suggests that these mangroves can access C markets under biodiversity conservation and maintenance schemes.
Materials and methods
Study area
The study was conducted in the northern part of BT (Table 1; Figure 1) and in the El Sargento estuary (Figure 2) in Sonora, Mexico. For both sites, García and CONABIO (1998) report a BW(h')hw climate, very dry and warm with mean annual temperature >22 °C, warm summer and intermediate rainfall regime between summer and winter. White (Laguncularia racemosa [L.] Gaertn), red (Rhizophora mangle L.) and black (Avicennia germinans [L.] L.) mangrove species, listed as "threatened" in NOM-059-SEMARNAT-2010 (Secretaría del Medio Ambiente y Recursos Naturales [SEMARNAT], 2019), are distributed in the area.
BT is characterized as a resting, refuge and breeding site for marine species, migratory and resident waterbirds (WHSRN, 2019). However, BT is deteriorating because its freshwater supply was channeled to irrigation district 041, while it receives untreated wastewater from agricultural and urban activities (containing phosphates, nitrates and nitrites) (Domínguez, 2010). In addition, El Sargento is a site for the development, reproduction and shelter of several biological species (López-Medellín et al., 2009), which shows deterioration due to contamination and siltation (Domínguez, 2010).
Table 1 Characteristics of the study sites in Sonora, Mexico
| Mangrove | Location | Total area (ha) | Mangrove area 2015-2020 (ha) | Acknowledgements | Fuente |
|---|---|---|---|---|---|
| Bahía del Tóbari | 27° 01ˈ- 27° 07ˈ LN | 16 700 | 362.79 - 431.57 | Islands of the Gulf of California Flora and Fauna Protection Area | Carmona et al. (2015); WHSRN (2019) |
| 109° 54ˈ-10° 03ˈ18" LO | Priority Wetland for Migratory Waterfowl in Mexico | ||||
| Priority Wetland for Shorebirds in Mexico | |||||
| Important Bird Conservation Area, Priority Area for Marine and Coastal Conservation in Mexico | |||||
| Natural World Heritage Site | |||||
| El Sargento | 29° 19ˈ- 29° 34" LN | 717 | 468.32 - 443.41 | Gulf of California Pristine Area | López-Medellín et al. (2009) |
| 112.3° - 112° 22ˈ LO |
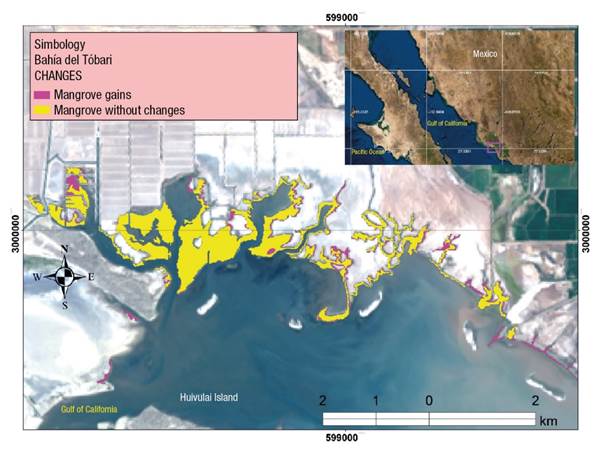
Figure 1 Location of Bahía del Tóbari (Sonora, Mexico) and changes in coverage 2015-2020. Source: compiled by the authors with information from CONABIO (2021).

Figure 2. Location of El Sargento (Sonora, Mexico) and changes in coverage 2015-2020. Source: Compiled by the authors with information from CONABIO (2021).
Biomass and carbon stock estimation defining the 2015 baseline
The study by Bautista-Olivas et al. (2018) describes in detail the field phase and estimates of aboveground biomass of BT and El Sargento, according to the technique of Kauffman, Donato, and Adame (2013) and the allometric equations of Day, Conner, Ley-Lou, Day, and Navarro (1987). At each site, the aboveground biomass of mangrove species was determined according to their density per unit area (ha), while the sum of their average values indicated the biomass per ha. This value was multiplied by the conversion factor 0.5 and thereby the C stock was obtained (Intergovernmental Panel on Climate Change [IPCC], 2013).
Estimates of biomass and C stock per ha for each site were extrapolated to their respective total areas covered by mangrove, determined by CONABIO (2016) and cross-checked in this study with Landsat 8 satellite images (United States Geological Survey [USGS], 2022) (Table 2). In this way, reference characteristics, which form part of the "baseline (2015)" for both sites, were established.
Estimation of aboveground biomass and carbon stock for 2020
The information reported by CONABIO (2021), which indicated gain, loss or unchanged permanence of wetland, was used to know the behavior of the area covered by mangrove in both sites in 2020. These areas were compared with Landsat 8 satellite images (USGS, 2022) (Table 2). Based on this information and the baseline of 2015, the biomass and C stocks of 2020 were recalculated.
Table 2 Characteristics of Landsat 8 satellite images used to estimate aboveground biomass and carbon stocks
| Site | Date of purchase | Code |
|---|---|---|
| El Sargento | 09/02/2015 | LC80360402015040LGN01 |
| 07/02/2020 | LC80360402020038LGN00 | |
| Bahía del Tóbari | 10/01/2015 | LC80340412015010LGN01 |
| 25/02/2020 | LC80340412020056LGN00 |
Source: USGS, 2022.
Avoided CO2e emissions (2020) and economic valuation
As C sequestration has a market price in terms of tCO2e, the determined C content was transformed into those units with the factor 3.7 (Howard et al., 2014), while the EV (USD) of the reserve was calculated with a direct method using the following formula (Valera & Carvajal, 2014):
where,
CO2e = avoided emissions (t·ha-1)
TA = total area covered by mangrove (ha)
Vc = marginal cost of reducing one tCO2e (Hernández-Blanco et al., 2018).
World Bank (WB, 1.9 USD) (World Bank Group [WGB], 2019) and global VM (2.6 USD) (Ecosystem Marketplace, 2018) average prices were considered.
Statistical analysis
Statistically significant differences between the means of the C contents of both study sites, regarding each mangrove species and total stores, were estimated with the t-student test for independent samples. The homoscedasticity of the data was evaluated with the F-test (P ≤ 0.05), to estimate heterogeneity in variances, using the Statistical Package for the Social Sciences software ver. 23.0 (IBM Corp. Released, 2015).
Results and Discussion
Biomass and carbon stock for the baseline for 2015
The areas covered by mangrove at BT and El Sargento are smaller than their geographic boundaries (Table 1). In BT, densities were 3 162 trees∙ha-1 and 1 147 144.8 trees∙TA-1 (362.79 ha) with biomass of 104.1 ± 19.0 Mg∙ha-1 and 37 756.7 ± 6 901.6 Mg∙TA-1 and dominance of A. germinans (83.4 %) over R. mangle (16.6 %) (Table 3).
The densities at El Sargento were 4 406 trees∙ha-1 and 2 063 432 trees∙TA-1 (468.32 ha); i.e., 1.4 times more than BT (same ratio compared to mangrove area), which was attributed to its pristine character. The species L. racemosa dominated (60.1 %) over A. germinans (34.0 %) and R. mangle (5.8 %). Biomass was estimated at 143.3 ± 31.9 Mg∙ha-1 and 67 119.7 ± 14 948.4 Mg∙TA-1.
When comparing the mangroves of Balandra, Zacatecas and Enfermería (Baja California Sur, Mexico), it was found that these had lower tree densities (12 924, 11 094 and 5 775 trees∙ha-1, respectively) and biomasses (68.7, 51.7 and 29.6 Mg∙ha-1 and 1 662.5, 931.32 and 56.24 Mg∙TA-1, respectively) than BT and El Sargento (Ochoa-Gómez et al., 2019), which was related to their respective areas and coverages (24.2 ha and 66 %; 18 ha and 77 %; 1.9 ha and 14 %).
C stores in BT were estimated at 52.1 ± 9.5 MgC∙ha-1 and 71.7 ± 16 MgC∙ha-1 in El Sargento, while TA recorded 18 901 ± 3 446.5 MgC and 33 579 ± 7 493.2 MgC, respectively (Table 3). Like biomass, C stock in A. germinans was 2.2 times higher than in R. mangle in BT, and L. racemosa was 2.7 times higher than A. germinans at El Sargento
When contrasting the mean values of C content between BT and El Sargento, no statistically significant differences were found for total stores (t = 1.41; P = 0.17 and F = 0.048) and A. germinans (t = -1.58; P = 0.12 and F = 0.82). The opposite was observed for R. mangle (t = -2.57; P = 0.02 and F = 9.4 x 10-39), which was associated with the disproportionate abundance in BT (16.6 %) and El Sargento (5.82 %); L. racemosa was excluded from the analysis because it was only found in El Sargento.
Table 3 Baseline (2015): aboveground biomass (BA) and carbon sequestration in mangrove forest in Bahía del Tóbari and El Sargento, Sonora.
| Species | Density (tree∙ha-1) * | Percentage (%)* | BA (Mg∙ha-1)* | Carbon in BA (MgC∙ha-1)* | Densidad (tree∙AT-1) | Biomass (Mg∙AT-1) | Carbono in BA (MgC∙AT-1) | t test |
|---|---|---|---|---|---|---|---|---|
| Bahía del Tóbari | ||||||||
| Avicennia germinans | 2 637 | 83.4 | 71.7 ± 10.3 | 35.9 ± 5.1 | 956 679.6 | 26 022.7 ± 3 734.0 | 13 024.2 ± 1 850.2 | a |
| Rhizophora mangle | 525 | 16.6 | 32.3 ± 12.2 | 16.2 ± 6.1 | 190 465.2 | 11 734.0 ± 4 440.9 | 5 877.2 ± 2 213.0 | a |
| Total | 3 162 | 100 | 104.1 ± 19.0 | 52.1 ± 9.5 | 1 147 144.8 | 37 756.7 ± 6 901.6 | 18 901 ± 3 446.5 | a |
| El Sargento | a | |||||||
| A. germinans | 1500 | 34.04 | 39.2 ± 10.2 | 19.6 ± 5.1 | 702 484.8 | 18 350.1 ± 4 788.5 | 9 179.1 ± 2 388.4 | a |
| Laguncularia racemosa | 2 650 | 60.14 | 104.1 ± 32.3 | 52.1 ± 16.1 | 1 241 056.5 | 48 758.9 ± 15 118.8 | 24 399.6 ± 7 540.0 | - |
| R. mangle | 256 | 5.82 | 0.023 ± 0.02 | 0.01 ± 0.01 | 119 890.7 | 10.6 ± 8.4 | 5.2 ± 4.2 | b |
| Total | 4 406 | 100 | 143.3 ± 31.9 | 71.7 ± 16.0 | 2 063 432.0 | 67 119.7 ± 14 948.4 | 33 579 ± 7 493.2 | a |
*Source: Bautista-Olivas et al. (2018). AT is the total area covered by mangrove (Bahía del Tóbari, 362.79 ha; El Sargento, 468.32 ha). ± Standard error of the mean; 95 % confidence interval. Different letters indicate statistically significant differences (Student's t, P = 0.05) between the means of the C contents of both study sites, regarding each mangrove species and total stores.
Baseline (2015) - prediction for 2020
Mangrove cover changed from 2015 to 2020 in both study sites; in the case of BT there was an increase of 68.77 ha. Because atmospheric CO2 fixation in mangrove depends on density, productivity, basal area, height and age of trees (Sitoe, Comissario, & Guedes, 2014), and in the absence of such information to define concrete values of biomass and C stocks in the area gained in BT, this was excluded from the prediction for 2020; however, for the area that remained constant, a biomass of 37 756.7 ± 6 901.6 Mg∙TA -1 was reported and a C reserve of 18 901.4 ± 3 447 Mg∙TA -1 (Table 4). According to Kauffman et al. (2016), mangrove loss emits GHG amounts greater than 66.3 %.
Table 4 Estimates of biomass and carbon sequestration in the mangrove of Bahía del Tóbari and El Sargento, Sonora, for the year 2020.
| Species | Density (tree∙TA-1) | Biomass (Mg∙TA-1) | Carbon (MgC∙TA-1) |
|---|---|---|---|
| Bahía del Tóbari | |||
| Avicennia germinans | 956 679.6 | 26 022.7 ± 3 734.0 | 13 024.2 ± 1 850.2 |
| Rhizophora mangle | 190 465.2 | 11 734.0 ± 4 440.9 | 5 877.2 ± 2 213.0 |
| Total | 1 147 144.8 | 37 756.7 ± 6 901.6 | 18 901.4 ± 3 447 |
| El Sargento | |||
| A. germinans | 665 112.5 | 17 373.9 ± 4 533.7 | 8 690.8 ± 2 261.4 |
| Laguncularia racemosa | 1 175 032.0 | 46 165.0 ± 14 314.5 | 23 101.6 ± 7 138.9 |
| R. mangle | 113 512.5 | 10.1 ± 7.9 | 4.9 ± 4.0 |
| Total | 1 953 657.0 | 63 548.9 ± 14 153.1 | 31 792.4 ± 7 095 |
TA is to the total area covered by mangrove (Bahía del Tóbari, 362.79 ha; El Sargento, 443.4 ha). ±Standard error of the mean; 95 % confidence interval.
Avoided CO2e emissions and economic valuation (2015-2020)
In 2015, estimated avoided CO2e emissions in BT were higher in A. germinans than in R. mangle, and together totaled 191.2 ± 41.1 tCO2e∙ha-1 and 69 368.2 ± 14 912.2 tCO2e∙AT-1 (Table 5). At El Sargento, emissions were higher for L. racemosa and lower for R. mangle; together they totaled 263.2 ± 77.8 tCO2e∙ha-1 and 123 253 ± 36 452.9 tCO2e∙AT-1. The highest amount of avoided CO2e emissions placed Sargento above BT.
In 2020, the EV of avoided emissions of tCO2e∙ha-1 in BT were 131 799.5 ± 28 333.1 USD (WB) and 180 357.21 ± 38 771.6 USD (VM) (Table 5); because of its abundance, A. germinans represented the largest economic contribution in both markets (Figures 3 and 4). For El Sargento (2020), EV were 221 722.2 ± 65 575.8 USD (WB) and 303 409.4 ± 89 735.3 USD (VM) (Table 5); by dominance, L. racemosa had the highest EV in both markets (Figures 3 and 4). As in 2015, BT achieved a lower price than El Sargento in both markets (Table 5), despite changes in TA.
Table 5 Estimates of avoided CO2e emissions in the mangroves of Bahía del Tóbari and El Sargento (Sonora) and economic valuation.
| Species | CO2e (tCO2e∙ha-1) | CO2e (tCO2e∙TA-1) | CO2e (tCO2e∙TA-1) | World Bank (1.9 USD·tCO2e-1) | Voluntary carbon market (2.6 USD·tCO2e-1) |
|---|---|---|---|---|---|
| 2015 | 2015 | 2020 | 2020 | 2020 | |
| Bahía del Tóbari | |||||
| Avicennia germinans | 131.8 ± 18.7 | 47 798.8 ± 6790.4 | 47 798.8 ± 6 790.4 | 90 817.7 ± 12 901.7 | 124 276.85 ± 17 654.9 |
| Rhizophora mangle | 59.5 ± 22.4 | 21 569.4 ± 8 121.8 | 21 569.4 ± 8 121.8 | 40 981.8 ± 15 431.4 | 56 080.36 ± 21 116.7 |
| Total | 191.2 ± 41.1 | 69 368.2 ± 14 912.2 | 69 368.2 ± 14 912.2 | 131 799.5 ± 28 333.1 | 180 357.21 ± 38 771.6 |
| El Sargento | |||||
| A. germinans | 71.9 ± 18.7 | 33 687.4 ± 8 765.6 | 31 895.2 ± 8 299.3 | 60 601.0 ± 15 768.6 | 82 927.6 ± 21 578.1 |
| Laguncularia racemosa | 191.2 ± 59.1 | 89 546.7 ± 27 671.8 | 84 782.8 ± 26 199.7 | 161 087.3 ± 49 779.4 | 220 435.2 ± 68 119.1 |
| R. mangle | 0.04 ± 0.03 | 18.9 ± 15.5 | 17.9 ± 14.6 | 34.0 ± 27.8 | 46.5 ± 38.1 |
| Total | 263.2 ± 77.8 | 123 253 ± 36 452.9 | 116 696 ± 34 513.6 | 221 722.2 ± 65 575.8 | 303 409.4 ± 89 735.3 |
Voluntary carbon market (Ecosystem Marketplace, 2018); World Bank (WBG, 2019). ± Standard error of the mean; 95 % confidence interval.

Figure 3 Economic value of avoided CO2e emissions in mangroves Bahía del Tóbari and El Sargento, Sonora (2020) based on World Bank price (1.9 USD∙tCO2e-1). Bars indicate standard error of the mean; 95 % confidence interval.
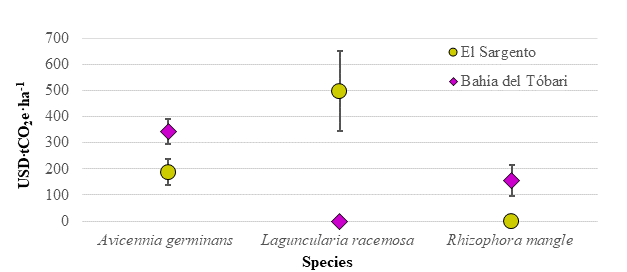
Figure 4 Economic value of CO2e emissions avoided in the mangroves Bahía del Tóbari and El Sargento, Sonora (2020) based on the voluntary carbon market price (2.6 USD∙tCO2e-1). Bars indicate standard error of the mean, 95 % confidence interval.
Reduction of mangrove cover in El Sargento implied a C loss of 1 786.4 ± 398.6 MgC∙TA-1, equivalent to emissions of 6 556.1 tCO2e∙TA-1 to the atmosphere, with an economic loss in C stock of 12 458.5 ± 3684.7 USD according to the WB or 17 048.4 ± 5 042.2 USD according to the VM (Table 6).
Herrera et al. (2016) found that the C stored in the biomass of BT and El Sargento was 1.24 times higher (in both cases) compared to the overall assessment of the North Pacific mangroves. For comparison purposes, this study took the C reference values reported by Herrera et al. (2016) and estimated avoided CO2e emissions. Thus, the North Pacific recorded 154.47 t∙ha-1, while the extreme values corresponded to the Yucatan Peninsula (171.68 tCO2e∙ha-1) and the South Pacific (512.52 tCO2e∙ha-1) (Table 7). While the calculated EVs for the North Pacific were 401.6 USD (WB) and 293.5 tCO2e USD (VM) (Table 7), the estimates for BT and El Sargento were 1.24 and 1.7 times higher. After the North Pacific region, the Yucatan Peninsula recorded the lowest EV (446.4 USD∙ tCO2e-1 [VM] and 326.2 USD∙ tCO2e-1 [WB]) and the South Pacific the highest.
In other North Pacific mangroves, such as the Marismas Nacionales Biosphere Reserve (Nayarit), aboveground biomass was estimated at 361 ± 296 and 43.83 ± 21.39 Mg∙ha-1 in the northern and southern zones, respectively, with reserves of 159. 9 ± 132.6 and 19.73 ± 9.5 MgC∙ha-1 in the north and 586.30 ± 486.20 and 72.34 ± 34.83 tCO2∙ha-1 in the south (Quintero-Morales, Plata-Rocha, Olimón-Andalon, Monjardín-Armenta, & Nemiga-Antonio, 2021). These biomasses are higher compared to BT (104.1 ± 19.0 Mg∙ha-1) and El Sargento (143.3 ± 31.9 Mg∙ha-1), even though the reserve experiences anthropogenic pressure and frequent hydrometeorological events. Biomass, C stocks and avoided CO2 emissions were higher in the northern zone of that reserve, where A. germinans predominated; these results are contrary to those of the present study, since this species dominated in BT where the lowest values were recorded.
According to Agraz-Hernández et al. (2020), the EV of avoided CO2 emissions in the reserve amounts to 4 431,826.7 USD, based on a market price per tCO2e of 5.5 USD and a TA of 3 280 ha. This area is higher than that of BT (362.8 ha) and El Sargento (443.31 ha), as well as the tCO2e price considered in this study (WB and VM, 1.9 and 2.6 USD, respectively).
The C stock of the mangrove biomass of the Nuevas Grandes-La Isleta Bay (in Cuba) was calculated at 13.27 t∙ha-1, and the VE of the TA (2 631.3 ha) at 1 353 372.55 Cuban pesos (Díaz, González, Pérez, & Reyes, 2018), without specifying the tCO2e price. That C stock is lower than that recorded for BT and El Sargento (52.1 ± 9.5 and 71.7 ± 16 MgC∙ha-1 respectively).
Table 6 Losses of biomass, carbon and economic value of avoided CO2e emissions in El Sargento, Sonora.
| Species | Density (árbol∙AT-1) | Biomass (Mg∙AT-1) | Carbon (MgC∙AT-1) | CO2e (tCO2e∙AT-1) | World Bank (1.9 USD·t CO2e-1) | Voluntary carbon market (2.6 USD·tCO2e-1) |
|---|---|---|---|---|---|---|
| Avicennia germinans | 37 372.3 | 976.2 ± 254.7 | 488.33 ± 127.1 | 1 792.2 ± 466.3 | 3 405.1 ± 886.0 | 4 659.7 ± 1 212.5 |
| Laguncularia racemosa | 66 024.5 | 2 594.0 ± 804.3 | 1 298.07 ± 401.1 | 4 763.9 ± 1 472.1 | 9 051.4 ± 2 797.1 | 12 386.1 ± 3 827.6 |
| Rhizophora mangle | 6 378.2 | 0.6 ± 0.4 | 0.27 ± 0.2 | 1.0 ± 0.8 | 1.9 ± 1.6 | 2.6 ± 2.1 |
| Total | 109 775 | 3 570.8 ± 795.3 | 1 786.4 ± 398.6 | 6 556.1 ± 1 463.0 | 12 458.5 ± 3 684.7 | 17 048.4 ± 5 042.2 |
Table 7 Estimated avoided CO2e emissions and economic value in the study mangroves and other regions of Mexico (values calculated in this study from Herrera et al., 2016§).
| Mangrove/Region | Carbon (MgC∙ha-1) | CO2e (t∙ha-1) | Voluntary carbon market (2.6 USD·tCO2e-1) | World Bank (1.9 USD·tCO2e-1) |
|---|---|---|---|---|
| Bahía del Tóbari | 52.1 | 191.21 | 497.1 | 363.3 |
| El Sargento | 71.7 | 263.18 | 684.3 | 500 |
| Pacific Center | 101.75§ | 373.42 | 970.9 | 709.5 |
| North Pacific | 42.09§ | 154.47 | 401.6 | 293.5 |
| South Pacific | 139.65§ | 512.52 | 1 332.5 | 973.8 |
| Yucatan Peninsula | 46.78§ | 171.68 | 446.4 | 326.2 |
| Gulf of Mexico | 137.32§ | 503.96 | 1 310.3 | 957.5 |
Access to financial mechanisms
In order to access financing mechanisms, it is necessary to demonstrate that the C stock can be increased, and CO2 emissions can be reduced with additional economic incentives in BT and El Sargento. Therefore, the C baseline is defined (Herold et al., 2011) and the amount of C stored in the area in a certain time, with and without project (conservation, maintenance, rehabilitation or recovery). The CEC (2017) highlights mangrove financing if linked to climate change mitigation and adaptation strategies (contemplated in the National Climate Change Strategy) and biodiversity (National Biodiversity Strategy), because of the importance and vulnerability of priority ecosystems and their role as biodiversity "aggregators". Although the quantification of edaphic C stores is recommended to complement the present study, neither the type of reservoir nor the extension of the mangrove are limiting factors for requesting financing, since it can be managed under maintenance and conservation strategies as occurs with mangroves in other countries (Table 8).
Table 8 Avoided CO2e emissions in mangroves and financing mechanisms.
| Mangrove | Coutry | Area (ha) | Stock | CO2e (t∙ha-1) | CO2e (t∙yr-1) | CO2e (t∙TA-1) | EV objective | Source |
|---|---|---|---|---|---|---|---|---|
| Bahía del Tóbari | Mexico | 431.57 | B | 191.2 | - | 69 368.2 | C | Present study |
| El Sargento | Mexico | 443.41 | B | 263.2 | - | 116 695.92 | C | Present study |
| Manglares de México | Mexico | - | B | 1 336* | - | - | SV | Herrera et al. (2016) |
| Ciénaga Grande de Santa Marta | Colombia | 29 800 | B | 393.8 | - | - | SE | De la Peña, Rojas, and De la Peña (2010) |
| Ciénaga de la Virgen | Colombia | 3 025 | B | - | 2 654.22 | - | - | Carbal, Muñoz, and Solar (2015) |
| Batam City | Indonesia | 115 | B | - | - | 114 623Ϸ | CDM (A, R) | CDM and UNFCCC (2019) |
| Islas Bengkalis, Riau, Simeulue and Aceh | Indonesia | 1 500 a 15 000 | S, B | - | 1 000-2 000¶ | - | REDD+ (C) | Broadhead (2011) |
| Bahía Gazi | Kenya | 117 | S, B | - | 2 023 | - | VM (R) | Broadhead (2011) |
| Manglares de Panamá | Panama | 2 000 | NE | - | - | 885 791§ | CDM (C, R) | Broadhead (2011) |
| Sine Saloum and Casamance | Senegal | 1 700 | B | - | 2 262 | 67 850.9Ϸ | CDM (R) | CDM and UNFCCC (2019) |
Stock: B = biomass, S = soil, NE = no specified. Economic value (EV): A = aforestación; C = conservation; CDM = clean development mechanism; R = reforestation; REDD+ = reducing emissions from deforestation and forest degradation program; VM = voluntary carbon market; SV = no economic valuation in 30Ϸ, 25¶ and 22§ years. *Average value.
Limitations of this study include the lack of annual field measurements to generate a continuous record of biomass and soil C increments and determine the annual sequestration rate, as well as the lack of standardized methods for carbon quantifications and EV. This topic is particularly important because it allows the establishment of a baseline and the determination of C sequestration over time that is comparable between regions.
This suggests the development of the following lines of research: (i) edaphic C baseline and continuous monitoring of C in biomass and soil, since considering all C stocks would provide an integral evaluation and, with it, a complete scenario of C stock and its trend over time; (ii) integral EV of C stocks (biomass and soil) that would increase their cost and facilitate their insertion in the market; iii) standardized methodologies for the EV of this environmental service, which would avoid under- or overvaluation of the C stock and, consequently, favor an impartial market; and iv) development and implementation of strategies for accessing blue C financing mechanisms, which would benefit the conservation and maintenance of mangrove ecosystem services, including climate change.
Conclusions
For 2020, in Bahía del Tóbari, avoided emissions were estimated at 69 368.2 tCO2e in the total area (TA) with a value of 131 799.5 USD according to the World Bank and 180 357.21 USD according to the voluntary carbon market. For the case of El Sargento, avoided emissions of 116 696 tCO2e∙AT-1 were calculated with a price of 221 722.25 USD in the World Bank and 303 409.39 USD in the voluntary carbon market. This research establishes a first approximation of the economic value that the C stock represents in the mangroves studied. Although it is necessary to complement with other studies on edaphic carbon stocks and the annual capacity of the systems to maintain or increase the C content, it is estimated that Bahía del Tóbari and El Sargento can enter the carbon market or other payment schemes for environmental services to promote maintenance and conservation.

