


 texto en
  Inglés (pdf)
 Artículo en XML
 Referencias del artículo
 Enviar artículo por email
 Citado por SciELO
  Similares en
SciELO
Similares en
SciELO 
 Permalink
Highlights:
Precipitation reconstructed with tree rings of Pseudotsuga menziesii, Pinus arizonica and Pinus strobiformis.
A 359-year regional series (1660-2018) was developed.
October-June precipitation had the highest impact on annual ring´s growth.
A drought recurrence every 50 years was identified.
The reconstructed precipitation variability is significantly modulated by ENSO.
Introduction
Droughts are one of the most important processes of natural climate variability, where precipitation levels are significantly lower than normal; due to current climate change, these events are likely to be magnified (Pokhrel et al., 2021). Even if we meet with the Paris Agreement to limit the global average temperature increase to 1.5 °C compared to pre-industrial levels, an increase in the intensity or frequency of droughts and precipitation deficits is expected in some regions of the world (Grupo Intergubernamental de Expertos sobre el Cambio Climático [IPCC], 2019). While there is still uncertainty, there is enough knowledge to affirm that the north of Mexico will be impacted with more prolonged and intense droughts (Magaña-Rueda & Neri, 2012).
The border region of the states of Chihuahua and Sonora, located in an arid to semi-arid zone in the northwest part of Mexico, is frequently affected by severe droughts with considerable impact on the agricultural and livestock economy (Reyes-Gómez, Díaz, Brito-Castillo, & Núñez-López, 2013). Thanks to the diversity of these ecosystems, the area is a refuge for a significant variety of flora and fauna species that provide important environmental services for the population. The region is also rich in water resources due to the headwaters of the Fuerte, Yaqui and Humaya rivers that flow on both sides of the Sierra Madre Occidental, which recharge the aquifers (González-Elizondo, González-Elizondo, Tena-Flores, Ruacho-González, & López-Enríquez, 2012).
Therefore, it is essential to analyze trends in hydroclimatic variability to understand the impact of atmospheric circulation phenomena, to help developing plans to address future water scarcity events. However, the availability of climate records is limited because stations located in the area lack extensive and quality data (Servicio Meteorológico Nacional [SMN], 2019).
Annual tree growth rings are one option to generate information on past climate (Guibal & Guiot, 2021). It is possible to obtain information on the historical variability of the climate of a region (Lüttge, 2017). In the bordering areas of Chihuahua and Sonora, paleoclimatic reconstructions are scarce (Irby, Fulé, Yocom, & Villanueva-Díaz, 2013; Villanueva-Díaz et al., 2015), thus, the generation of a greater number of series could help in the improvement of knowledge and understanding of the climate variability experienced and possible repercussions.
Therefore, the present study has the following objectives: 1) to reconstruct the variability of precipitation for the western region of the state of Chihuahua based on annual growth rings of Pseudotsuga menziesii (Mirb.) Franco, Pinus arizonica Engelm. and Pinus strobiformis Engelm., 2) to determine the frequency of extreme events (droughts) and 3) to analyze the influence of El Niño Southern Oscillation (ENSO) on the historical variability of climate.
Materials and Methods
Study area
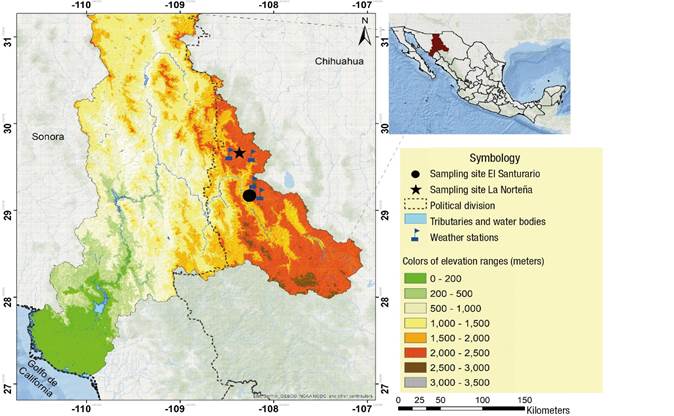
The Santuario de la Cotorra Serrana conservation area (29° 19’ 25” N, 108° 12’ 49° W) and the La Norteña site (29° 39' 08" N, 108° 28' 20" W), the latter corresponding to the Campo Verde Flora and Fauna Protection Area, are found in the municipality of Madera, Chihuahua, at an elevation gradient of 2 500 to 3 000 m (Figure 1). Both sites are located in the Yaqui river basin, which in turn belongs to the Región Hidrológica 9 Sonora Sur, with an area of 72 859.05 km2 and a perimeter of 2 333.03 km, within the Sierra Madre Occidental (Instituto Nacional de Estadística y Geografía [INEGI], 2019). Also, both sites belong to Regiones Terrestres Prioritarias (RTP) of Mexico (Comisión Nacional para el Conocimiento y Uso de la Biodiversidad [CONABIO], 2019).
The predominant climate in the area is semi-cold-subhumid with long cool summer (Cb’(w2)x’) (García, 1970). Mean annual precipitation ranges between 650 and 700 mm. Mean annual temperature of 11 °C with maximum temperatures of 28 °C in June and July, and minimum temperatures of -9 °C in December and January (SMN, 2019). The dominant vegetation type is conifers and oaks, while the soil type is Feozem (CONABIO, 2019).
Dendrochronological sampling and sample preparation
Tree ring samples were obtained by selective sampling. To maximize the climate signal, long-lived and climate-sensitive trees located in dry, rocky terrain were selected, seeking sites with minimal human disturbance (Fritts, 2001; Speer, 2010). Two to three samples were extracted per individual using a Pressler drill of 5 and 12 mm diameter and variable lengths (Hägloff). A total of 40 trees were sampled (18 P. menziesii, 15 P. arizonica and seven P. strobiformis) and a total of 91 samples were obtained at El Santuario. Sixty P. arizonica trees were sampled and a total of 132 samples were extracted at La Norteña. These were processed and predated following conventional techniques (Stokes & Smiley, 1996).
Dating and development of chronologies
For the predated samples, each of the annual growths (total ring, earlywood and latewood) were measured using a VELMEX sliding-phase system with 0.001 mm accuracy. Dating and measurement accuracy were verified with the COFECHA program (Grissino-Mayer, 2001; Holmes, 1983). Only series with intercorrelation values > 0.3281 (P < 0.01) were included in the construction of the final chronology (Holmes, 1983). Chronologies or growth indices (standard, residual and arstan), with mean 1.0 and homogeneous variance (Fritts, 2001), were generated with the ARSTAN program (Cook, 1987). This study used the standard and residual versions of the chronology because they provide the best association with precipitation.
Data analysis
A regional chronology was developed, and a Pearson correlation analysis was run between regional indices and observed regional precipitation data. Precipitation comprises quadrangles 51934 and 53212 (Terán-Cuevas, Gutiérrez-Castillo, & Davydova-Belitskaya, 2010) and the climatological stations Madera and Mesa del Huracán (SMN, 2019) (Figure 1; Table 1).
Table 1 Weather stations used in the dendrochronological analysis for the western region of Chihuahua.
| Weather stations | Latitude (N) | Longitude (W) | Elevation (m) | Period |
|---|---|---|---|---|
| Madera 8097 | 29° 11’ 24” | 108° 08’ 29” | 2 102 | 1957-2007 |
| Mesa del Huracán 8103 | 29° 38’ 00” | 108° 14’ 01” | 2 107 | 1957-1990 |
| Cuadrante 51934 | 29° 19’ 22” | 108° 13’ 01” | --- | 1950-2015 |
| Cuadrante 53212 | 29° 39’ 08” | 108° 28’ 22” | --- | 1950-2015 |
The relationship between monthly precipitation and regional indices of total ring width, earlywood and latewood in their standard and residual versions was evaluated by correlation analysis. Eighteen months of data were considered: six months before the growing year and 12 months during the growing season. According to Cleaveland, Stahle, Therrell, Villanueva-Díaz, and Burns (2003), climate conditions recorded before the beginning of the growing season influence the development of subsequent annual growth.
For the highest significant correlation (P < 0.05) between cumulative precipitation and regional total ring index, a transfer equation was developed, using the program R version 3.6.1 (R Core Team, 2019). Precipitation was reconstructed with this model for the time span covered by the observed records. Using the Verify subroutine of the University of Arizona Dendrochronological Programs package (Holmes, 2001), a calibration test was applied to half of the observed and reconstructed climate data (1998-2015, n = 18) and the remaining half (1980-1997, n = 17) was assigned a verification test (Fritts, 2001). The equation obtained was applied to reconstruct precipitation over the total period of the regional series. A 10-year spline curve was fitted to the precipitation reconstruction to highlight dry and rainy events (Cook, 1987). A spectral analysis was applied to the reconstructed series to identify recurrence of dominant anomalies (droughts). For the most severe droughts, a spatial correlation analysis was performed between the reconstructed precipitation and the Palmer Drought Severity Index (PDSI) (Stahle et al., 2016). Finally, to determine the impact of ENSO on hydroclimatic variability, the reconstructed precipitation and the Niño 3.4 SST index (Rayner et al., 2003) were related using MATLAB version 8.5 (The MathWorks Inc., 2015). For this purpose, annual resolution plots of wavelet spectra and wavelet coherence plots were used.
Results
Dating of samples
From a total of 223 growth cores, 159 samples (71 %) were dated to the exact year of formation. The COFECHA results indicated that the intercorrelation of the series was statistically significant (Table 2). Two chronologies were identified: El Santuario of 156 years (1863-2018) and La Norteña of 359 years (1660-2018). A significant correlation (r = 0.580; P < 0.01) was determined between the two chronologies and a regional chronology was developed (Figure 2). This showed a expressed population signal (EPS) > 0.85 with more than 10 cores starting in 1739, a statistically robust sample size (Figure 2).

Figure 2 Composite total ring chronology of Pseudotsuga menziesii, Pinus arizonica and Pinus strobiformis. The time series shows the climate variability over the last 359 years for the western region of Chihuahua. The bottom gray line represents the annual variability; the dotted horizontal line, the mean; the black highlighted line is a 10-year spline that allows the observation of low frequency events; and the gray area indicates the sample size for each segment of the regional chronology. The red line represents an expressed population signal value (EPS) > 0.85.
Table 2 Statistical parameters of total ring chronologies of Pseudotsuga menziesii, Pinus arizonica and Pinus strobiformis for the western region of Chihuahua.
| Site | Total ring correlation | Length of chronology | Sensitivity |
|---|---|---|---|
| El Santuario | 0.610 (P < 0.01) | 1863-2018 (156 years) | 0.265 |
| La Norteña | 0.605 (P < 0.01) | 1660-2018 (359 years) | 0.313 |
| Regional | 0.580 (P < 0.01) | 1660-2018 (359 years) | 0.3 |
Response function
Figure 3 shows that the highest correlations between precipitation and chronologies are found with the standard version. Regarding monthly precipitation, the period from September of the previous year to June of the current year showed a positive relationship with the regional chronology of total ring, earlywood and latewood in its standard and residual version. The months of October and November of the previous year and February of the current year showed significant correlation (P < 0.05) with both standard and residual chronology for total ring, earlywood and latewood (Figure 3A and 3C).
In the case of cumulative precipitation, correlations were significant (P < 0.01) in all three indices (total ring, earlywood and latewood) throughout the year for standard and residual chronology (Figure 3B and 3D). However, the seasonal October-June cumulative precipitation period of the standard chronology recorded the highest correlation for total ring (r = 0.73, P < 0.01), earlywood (r = 0.71, P < 0.01), and latewood (r = 0.71, P < 0.01) (Figure 3B). The regional standard total ring chronology has the greatest potential to be used as a proxy for seasonal precipitation variability in the October-June period (r = 0.73, P < 0.01).
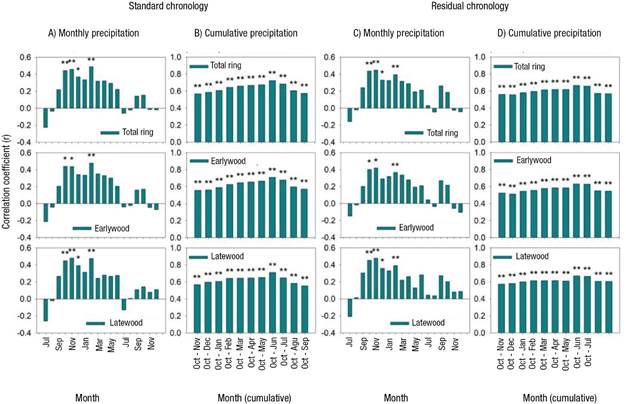
Figure 3 Response function analysis between precipitation (monthly and cumulative) and regional standard (A and B) and residual (C and D) chronology of Pseudotsuga menziesii, Pinus arizonica and Pinus strobiformis for the western region of Chihuahua. *P< 0.05 and **P< 0.01 indicate the degree of significance of correlation between both variables.
Precipitation reconstruction
Figure 4A shows highly significant association (r = 0.73, P < 0.01) between the seasonal precipitation period October-June and the total ring width index for the common period 1980-2015. A linear regression model was developed that allowed reconstructing the variability of observed data precipitation in that period (Figure 4B). The model was as follows:
where,
Yt = precipitation value (mm) October-June, reconstructed for a specific t year
Xt = total ring width index for a specific t year.
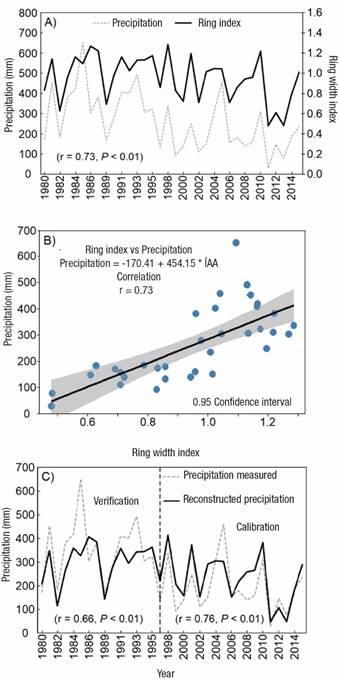
Figure 4 Association between the ring width index (RWI) of Pseudotsuga menziesii, Pinus arizonica and Pinus strobiformis and regional October-June precipitation for the period 1980-2015 in the western region of Chihuahua (A); linear regression model between both variables (B); and comparison of reconstructed October-June precipitation (solid line) and measured precipitation (dotted line) in the period 1980-2015, verification and calibration of the regression model (C).
Model calibration and verification
Figure 4C indicates the variability of reconstructed precipitation for the common period of measured data (1980-2015). The model calibration process indicated highly significant correlation (r = 0.76, r2 = 0.58, P < 0.01) between measured and reconstructed precipitation, and explained 58 % of the precipitation variability. On the other hand, the verification showed highly significant correlation r = 0.66 (r2 = 0.44, P< 0.01), which explained 44 % of precipitation variability (Tables 3 and 4). Since both subperiods show significant correlations, the model for the total period of measured data (1980-2015) was considered statistically valid with r = 0.75 (r2 = 0.56, P < 0.01) and was applied to the total chronology to reconstruct precipitation variability (Table 3).
Table 3 Calibration and statistics of the regression between October-June precipitation and total ring standard chronology index of Pseudotsuga menziesii, Pinus arizonica and Pinus strobiformis for the western part of Chihuahua.
| Period | R2 adj | Coefficients | Standard error | T test | Probability | ||||
|---|---|---|---|---|---|---|---|---|---|
| β0 | β1 | β0 | β1 | β0 | β1 | β0 | β1 | ||
| 1980-1997 | 0.44 | -136.28 | 463.61 | 155.5 | 148.6 | -0.87 | 3.11 | 0.39 | 0.007 |
| 1998-2015 | 0.58 | -110.69 | 342.51 | 65.33 | 71.48 | -1.69 | 4.79 | 0.1 | 0 |
| 1980-2015 | 0.56 | -170.41 | 454.15 | 74.93 | 76.59 | -2.27 | 5.93 | 0.029 | 0 |
Table 4 Verification statistics for seasonal precipitation October-June for the western part of Chihuahua.
| Period | Pearson correlation (r) | Error reduction | Sign test | T test | First significant difference |
|---|---|---|---|---|---|
| 1980-1997 | 0.66** | 0.69* | 2* | 4.2* | 3* |
| 1998-2015 | 0.76** | 0.82* | 4* | 4.3* | 3* |
| 1980-2015 | 0.75** | 0.55* | 6* | 4.7* | 6* |
*P < 0.05, ** P < 0.01
Variability of reconstructed precipitation
Figure 5 shows the October-June reconstructed precipitation variability covering the period 1660-2018. The series indicates high interannual and multiannual variability with dry and wet periods that varied in extent and intensity. For the last three and a half centuries, significant frequencies (P < 0.05) of extreme events were determined every 50 years (Figure 6), at approximately mid-century and between the end and beginning of the century. Spatial correlation analysis between PDSI and four of the most severe droughts (1695-1707, 1751-1768, 1807-1810, 1945-1956) indicated areas of significant correlation (P < 0.05), showing the magnitude and geographic extent of these episodes (Figure 7).

Figure 5 Reconstruction of winter-spring precipitation (359 years) for the western region of Chihuahua. The gray line at the bottom indicates annual variability and the smoothed 10-year curve, highlighted in black, indicates low-frequency events (in blue dry periods and in red wet periods). Average precipitation is 277.4 mm.

Figure 6 Spectral analysis of reconstructed regional precipitation for the western part of Chihuahua. Numbers indicate the frequencies reported in the series; in bold, the frequencies of 2 and 5 years indicate relationship with the ENSO phenomenon and the frequencies of 51 and 91 years correspond to extreme events with cycles of about 50 years.
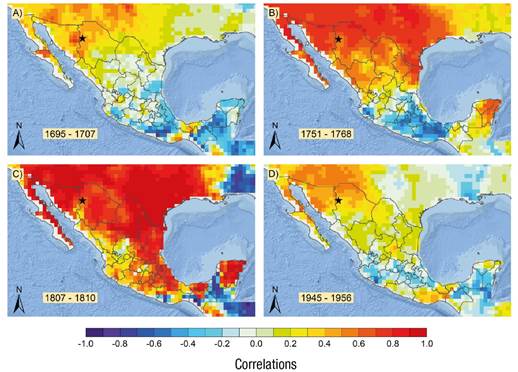
Figure 7 Spatial correlation between reconstructed precipitation and Palmer Drought Severity Index (PDSI) for the months of June, July and August (Stahle et al., 2016) for four extreme drought events. The star indicates the study area.
Impact of ENSO on precipitation variability
Figure 8A shows the wavelet spectrum for the reconstructed precipitation, significant areas (P < 0.05) corresponding to periods of one (1902-1904, 1988-1989), three (1995-2002) and six years (2006-2018). On the other hand, Figure 8B indicates the wavelet spectrum of the ENSO phenomenon and its irregular cycle from one to seven years for the intervals 1912-1920, 1942-1958, 1968-1973, 1978-2006 and 2008-2015. Spectral wavelet coherence analysis determined significant (P < 0.05) areas of in-phase relationship between the reconstructed precipitation and the Niño 3.4 index for the period 1900-2018 at frequencies of one to seven years (Figure 8C). Significant (P < 0.05) periods in phase were determined for the intervals 1900-1910, 1932-1940, 1934-1963, 1920-1950 and 1995-2018 at frequencies of 1-7, 1-2, 4-7, 10-16 and 5-7 years, respectively.
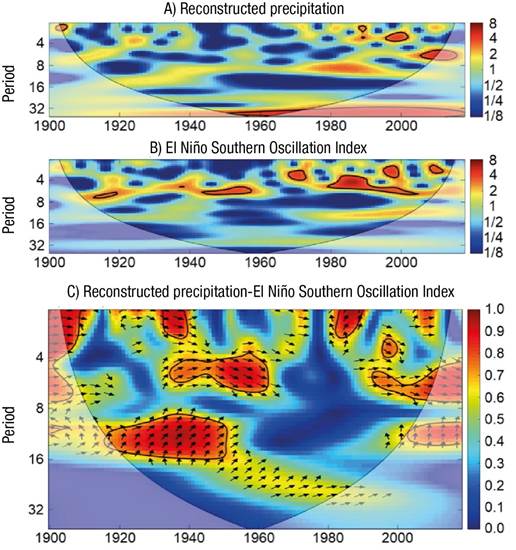
Figure 8 Wavelet spectra for the reconstructed precipitation (A) and the ENSO 3.4 index (B). Wavelet coherence analysis between the reconstructed precipitation series and the ENSO 3.4 index (C). Areas in red delimited by a black line indicate a significant relationship (P < 0.05) between the two variables. Horizontal arrows to the right indicate that both phenomena are in phase (positive relationship). On the other hand, arrows to the left indicate an anti-phase or negative relationship.
Discussion
Series sensitivity
The regional chronology generated exceeds the correlation parameter determined by the COFECHA program (Holmes, 1983), which establishes r = 0.3281 as the minimum significant correlation (P < 0.01) between growth series. This indicates that the species used have good sensitivity to environmental changes, showing potential for the reconstruction of regional climate variability.
Common variability of the series
P. menziesii, P. arizonica and P. strobiformis all show common climate variability through time, suggesting that annual growth is influenced by meteorological conditions modulating the regional climate. Multiple studies have found a common response between species from the Sierra Madre Oriental (Cerano-Paredes et al., 2011a; Cerano-Paredes, Villanueva-Díaz, Valdez-Cepeda, Méndez-González, & Constante-García, 2011) and the Sierra Madre Occidental (Chávez-Gándara et al., 2017; Irby et al., 2013; Villanueva-Díaz et al., 2015), even when they are separated; this implies that species capture the variability of larger scale climatic phenomena. A similar fluctuation in growth among species is due to the common limiting factor that is precipitation (Fritts, 2001).
Response of chronology to precipitation variability
Precipitation significantly influences the growth of tree species in the western part of Chihuahua, especially the seasonal October-June precipitation. Villanueva-Díaz et al. (2015) report similar results in the northwestern region of Chihuahua. The response of conifer growth to winter-spring precipitation in the northwestern part of Mexico and southwestern United States has been corroborated by several paleoclimatic studies (Cerano-Paredes et al., 2011a, 2012; Chávez-Gándara et al., 2017; Cleaveland et al., 2003; D’Arrigo & Jacoby, 1991). An explanation for the above is that rainfall during winter is usually of low intensity, favoring infiltration and soil saturation; meanwhile, low evapotranspiration in those months makes water saturate the soil and be available for the following tree growth period (Zywiec et al., 2017). Several paleoclimatic studies have documented and discussed the response of conifer growth to winter-spring precipitation in Chihuahua (Cerano-Paredes et al., 2009; Irby et al., 2013; Villanueva-Díaz et al., 2015). This common species response has made it possible to reconstruct droughts and analyze their impact at national level (Stahle et al., 2011).
Reconstructed droughts
There is little historical information available on the occurrence of droughts and their ravages in Mexico; with respect to the northern part, records begin in the second half of the eighteenth century when the area was colonized and populated (García-Acosta, 1993). In Chihuahua, the records report drought affectations during several periods: in the mid-1720s, the late 1730s and early 1740s, between 1748 and 1766, in the first three years of the 1770s, in the mid-1780s, the first two decades of the 19th century, between 1890 and 1897, and during the 20th century in the 1930s, 1950s and 1990s (Endfield & Fernández-Tejedo, 2006). The present reconstruction recorded all reported events except for the period from the late 1730s to the early 1740s, which validates the annual resolution quality of the reconstruction.
Drought in the late 17th and early 18th centuries (1695-1707) has been reported in other paleoclimatic reconstructions from Chihuahua (Villanueva-Díaz et al., 2015) and Durango (Cerano-Paredes et al., 2012); moreover, PDSI spatial correlation analysis shows that the greatest intensity of this drought was concentrated in those states (Figure 7A). Drought affectation in the mid-18th century, with a duration of almost 20 years (1751-1768), extended over a large part of northern Mexico and southern United States (Figure 7B), corroborating that reported by Cook et al. (2009) and Cerano-Paredes et al. (2011a). On the other hand, the effects of one of the widely documented droughts known as "El Año del Hambre (1785-1786)", considered the most severe event in the history of agriculture in New Spain (Therrell, Stahle, Villanueva-Díaz, Cornejo-Oviedo, & Cleaveland 2006), were less severe in the northern part compared to central Mexico, a region that suffered from famine and epidemics, with more than 300 000 people dying (Florescano, 1986).
The beginning of the armed struggle for Mexican independence was preceded by droughts and bad harvests in 1807, 1808 and 1809, which, in 1810, caused excessively high maize prices, food shortages and crises throughout the viceroyalty (O'Hara & Metcalfe, 1997). This created unemployment in the countryside and cities, social tension in the populations, epidemics and popular riots (Florescano, 1980). The reconstruction of precipitation variability for the western part of Chihuahua, as well as the spatial correlation analysis with the PDSI (Figure 7C) confirm this information, as it shows that the entire territory of New Spain was severely affected.
For the last years of the period known as “El Porfiriato” (1908-1911), below-average precipitation was again reconstructed. This drought caused massive food shortages, which subsequently led to social unrest (Irby et al., 2013). Florescano (1980) points out a close relationship between the drought conditions that affected mainly Querétaro and Hidalgo in the center of the country and Chihuahua, Coahuila and Nuevo León in the northern part, with the outbreak of the Mexican Revolution, key locations where insurrection took place.
The droughts of the 1930s, 1950s and 1990s have been recorded in other paleoclimatic reconstructions of Chihuahua (Cerano-Paredes et al., 2009; Irby et al., 2013; Villanueva-Díaz et al., 2015) recording water shortages, crop and livestock loss. Spatial correlation analysis (Figure 7D) shows that the mid-20th century drought impacted much of the southwestern United States and northern Mexico (Cleaveland et al., 2003; O'Hara & Metcalfe, 1997). This episode caused a great economic crisis in the rural areas of northern Mexico, causing tens of thousands of farmers to migrate to large Mexican cities and to the United States in search of opportunities (Florescano, 1980).
Severe droughts have been observed every mid-century and between the end or beginning of each century, a recurrence of 50 years (Figure 6), which synchronizes with results from other studies for both central (Therrell et al., 2006) and northern Mexico (Cerano-Paredes et al., 2011b, 2012; Chávez-Gándara et al., 2017). The most severe drought episodes reconstructed for the western part of Chihuahua synchronize with events recorded in most of northern and central Mexico and southern United States, with variations in intensity between regions. This can be attributed to large-scale climate phenomena affecting geographic regions with different intensity.
ENSO impact on precipitation
ENSO strongly influences the interannual variability of the winter-spring climate of northern Mexico (Magaña-Rueda, 1999; Stahle et al., 1998). The prolonged dry and wet regimes in this region reflect the high relationship between decadal variability and annual variance in both cool and warm season precipitation (Cleaveland et al., 2003). Cool-season precipitation in northern Mexico and the southwestern United States correlates significantly with ENSO (Magaña-Rueda, Vázquez, Pérez, & Pérez, 2003). This teleconnection of ENSO with the climate of northern Mexico is clearly recorded in the growth of trees in the Sierra Madre Occidental (Cerano-Paredes et al., 2009; Chávez-Gándara et al., 2017; Cleaveland et al., 2003).
The October-June precipitation reconstruction contain has a strong ENSO signal in the time and frequency domains. Spectral ondelta coherence analysis shows that the precipitation variability is significantly modulated by ENSO at different time and frequency scales over the last 100 years (Figure 8). Significant coherence was determined between the reconstructed precipitation and the Niño 3.4 index. According to Gergis and Fowler (2009), the last three most important drought events in this northern region of the country at the beginning, middle and end of the 20th century and the beginning of the 21st century are significantly related to ENSO. Trenberth (1997) notes that two of the most intense ENSO events in its cold phase occurred in the mid-20th century (1950-1951 and 1954-1956) and caused significant reductions in precipitation and severe droughts in a large part of northern Mexico, forcing tens of thousands of farmers to migrate (Florescano, 1980).
Conclusions
The reconstruction of 359 years of October-June precipitation variability for the western part of Chihuahua has provide an analysis of the recurrence of extreme events every 50 years and the influence of ENSO on the hydroclimatology of the region. Currently, thanks to technological advances in ENSO monitoring, its behavior can be known in advance and, consequently, the positive or negative impact it will have on the region, which is related to a greater or lesser recharge of aquifers. The generation of knowledge on climate variability for this region provides greater elements on an annual and multidecadal scale to contribute to the sustainable management of natural resources, especially the water that is captured in these forests and drains to the Yaqui river basin, a necessary resource for the agricultural and livestock development of the region which thousands of people need for their survival.

