


 texto en
  Inglés (pdf)
 Artículo en XML
 Referencias del artículo
 Enviar artículo por email
 Citado por SciELO
  Similares en
SciELO
Similares en
SciELO 
 Permalink
Highlights:
Growth of P. chiapensis was estimated using the generalized algebraic difference approach.
A Levakovic II equation had higher predictive ability of dominant height and site index.
The dynamic equation generates polymorphism and multiple asymptotes simultaneously.
Site index curves were constructed for 25, 32 and 39 m with a base age of 50 years.
The equation exhibited better performance compared to a previously reported polymorphic equation.
Introduction
Estimating the productive potential of forest sites is important for forest management because it helps to determine the annual harvest, establish the rotation and select the most suitable species for an area (Burkhart & Tomé, 2012). Forest productivity as a complex biological concept is estimated indirectly by growth models (Tamarit-Urias et al., 2014). The usual way to reference productivity is to use the dominant height-age relationship using the site index (SI), which is defined as the average height reached by the dominant trees in a stand at a given base age (Quiñonez-Barraza et al., 2015). With SI equations, curves are constructed that show the height growth pattern of trees of a species in an ecoregion (Akbas & Senyurt, 2018).
Growth curves generated by dynamic equations should meet the following attributes: biological realism, sigmoid growth, inflection point, polymorphism, variable asymptotes, base age and simulation path invariance, and height at base age should be equal to the SI (Guerra-Hernández et al., 2021). Base age invariance has been formalized using the algebraic difference approach, where a single parameter of the basic model is expressed according to the site; however, the main limitation of this approach is that the derived equations generate only anamorphic or polymorphic curves, restricting the possibility of describing a wider variety of common growth conditions in forest soils (Cieszewski, 2021).
In Mexico, despite the limitations of the algebraic difference, in the last decades of the last century and even in the first decade of the present century, forest managers used this approach to develop SI equations for species of the genus Pinus. Therefore, there is a need to update these models using more flexible modeling approaches and techniques. Thereby, according to Seki and Sakici (2017) and Özçelik, Cao, Gómez-García, Crecente-Campo, and Eler (2019), greater reliability and accuracy in the estimates of dominant height growth and SI will be improved. For this purpose, the generalized algebraic difference approach (GADA) is available. In this approach, the basic model is expanded so that two of its parameters are expressed according to the site by a theoretical variable X, which is assumed to include the site productivity factors. GADA derives dynamic equations that reproduce polymorphic SI curves with multiple asymptotes with higher biological realism (Cieszewski, 2021; Socha, Tyminska-Czabańska, Grabska, & Orzel, 2020; Sprengel, Spiecker, & Wu, 2022).
Pinus chiapensis (Martínez) Andresen is a subtropical conifer endemic to Mexico and Guatemala and forms part of the cloud forest in Puebla, Veracruz, Guerrero, Chiapas and Oaxaca. The species is noted for its rapid growth and high timber potential; it is naturally distributed at altitudes of 600 to 2 200 m, with an average annual rainfall of 1 500 to 2 000 mm, temperatures of 20 to 22 °C and steep slopes with acidic soils (Perry, 2009). This species plays key ecological and economic roles in the neotropics, is a valuable genetic resource (Del Castillo, Trujillo, & Saénz-Romero, 2009) and is listed with special protection status (Chávez-Pascual et al., 2013). The generation of a new SI function by GADA may be of higher predictive capacity than previous polymorphic models derived from algebraic difference.
The objective of this study was to develop a dynamic SI equation using the generalized algebraic difference approach as a silvicultural tool to describe the dominant height growth pattern and classify the productivity of natural stands of P. chiapensis in Puebla and Veracruz, Mexico.
Materials and Methods
Study area
The study area was the forest management unit (UMAFOR) 2103 “Teziutlán” of Puebla and 3012 “Valle y Cofre de Perote” of Veracruz, Mexico. The UMAFOR 2103 is located at 20° 02’ 34” - 19° 36’ 34” N and 97° 43’ 46” - 97° 22’ 23” W, at an average altitude of 2 220 m with an average annual temperature of 12 to 22 °C and Luvisol soils. The UMAFOR 3012 is located at 19° 56’ 16.80” - 19° 16’ 48.00” N and 96° 53’ 42.00” - 97° 25’ 01.20” W at an altitude between 500 and 1 600 m. The climate of this UMAFOR is temperate sub-humid with rainfall in summer with an average rainfall of 600 to 1 000 mm. The soils are Andosol and Lithosol, and the relief has steep slopes. The arboreal stratum in both regions is mainly composed of species of the genus Pinus, including P. chiapensis, and Quercus and Liquidambar taxa typical of the cloud forest (Rodríguez-Acosta & Arteaga-Martínez, 2005).
Data
The database consisted of a sample of 31 dominant and co-dominant trees of P. chiapensis, which was similar to that used by Rodríguez-Acosta and Arteaga-Martínez (2005). In both UMAFOR, the specimens were collected from vegetation belonging to cloud forest; according to Ruiz-Jiménez, Téllez-Valdés, and Luna-Vega (2012), this type of ecosystem maintains similar physiographic, climate, and floristic conditions when the regions are close to each other, as in the present case. This study expanded the observed age range by adding 28 pairs of observations corresponding to ages older than 55 years, generating 385 pairs of age and dominant height data, the basic statistics are shown in Table 1. The specimens represented several growth conditions of the study area. Each tree was felled and sectioned along the stem, starting at stump height and then every 2.55 m in length; 5 cm thick slices were obtained from the lower end of each section. Dominant height and age were determined using a stem analysis methodology (Pretzsch, Dauber, & Biber, 2013); overestimation in height measurements was corrected based on the Carmean method and the Newberry modification indicated by Cancino, Acuña, and Espinosa (2013) and Subedi and Sharma (2010).
Table 1 Basic descriptive statistics of the variables analyzed in 31 Pinus chiapensis trees belonging to two forest management units (UMAFOR 2103 and 3012) in Puebla and Veracruz, Mexico.
| Variable | Minimum | Average | Maximum | Standard deviation | Coefficient of variation (%) |
|---|---|---|---|---|---|
| Dominant height (m) | 0.10 | 16.50 | 51.13 | 11.07 | 67.07 |
| Age (years) | 2.00 | 19.48 | 116.00 | 17.33 | 89.99 |
Dynamic equations in generalized algebraic differences
An exploratory analysis on the fit of 50 dynamic equations, derived from the application of GADA, made possible the pre-selection of six functions as candidates for modeling the dominant height growth and SI of P. chiapensis (Table 2). In all cases, two parameters of each basic model were specific to site productivity. The theoretical growth models used as a basis were consigned by Burkhart and Tomé (2012), Panik (2014) and Hernández-Cuevas, Santiago-García, De los Santos-Posadas, Martínez-Antúnez, and Ruiz-Aquino (2018). These models are the Chapman-Richards model from which the dynamic equation labeled M1 was generated, the Korf model from which equations M2 and M3 were derived, the Hossfeld model that gave rise to equations M4 and M5, as well as the Levakovic II model from which equation M6 was obtained.
The general implicit structure of the dynamic equations has the following form Y = f(t, t 0 , Y 0 , β i ), where Y is the average dominant height to be estimated at age t; Y 0 is defined as a parameter during fitting, it is the dominant height observed at age t 0 ; β i are the parameters to be estimated; and Y 0 and t 0 are initial conditions (Tamarit-Urias et al., 2014).
Table 2 Dynamic equations in generalized algebraic difference approach evaluated to model growth in dominant height and site index of Pinus chiapensis.
| Basic model | Specific parameters | X 0 with initial values at t 0 and Y 0 | Dynamic equation | ||
|---|---|---|---|---|---|
| Chapman-Richards |
|
|
|
M1 | |
| Korf |
|
|
|
M2 | |
|
|
|
|
M3 | ||
| Hossfeld |
|
|
|
M4 | |
|
|
|
|
M5 | ||
| Levakovic II |
|
|
|
M6 | |
Y = height at age t, Y 0 = height at age t 0 , A = Age (years); a, b and c = parameter of each basic model; X = theoretical variable representing site productivity factors; F 0 and R 0 = components of the dynamic equation; β i = parameters of each dynamic equation to be estimated
Fitting strategy
The parameters of the dynamic equations were estimated with the Dummy variable method, described and illustrated by Sghaier et al. (2012) and in Pyo (2017), which is invariant with respect to the base age. This method considers measurement errors and randomness of the data, so, from the individual growth series it estimates local parameters for each tree and global parameters for all individuals corresponding to the β i of the equations.
Since observations correspond to multiple measurements per tree with hierarchical and longitudinal structure, also, stem analyses, ages at which the dominant heights are determined with not equidistant, show problems of autocorrelation and heteroscedasticity (Quiñonez-Barraza, García-Espinoza, & Aguirre-Calderón, 2018; Trim, Coble, Weng, Stovall, & Hung, 2020). To control autocorrelation, covariance structure involving the error term (e ij ) was modeled by a continuous autoregressive structure of order ρ (Panik, 2014), whereby the error term was expressed in the following manner:
where,
e ij = j-th ordinary residue of the i-th tree
e ij-k = j-th ordinary residual of the i-k-th tree
I k = 1 for j > k and is zero for j ≤ k
ρ k = autoregressive parameter of order k to be estimated
t ij ‒ t ij-k = distance separating the j-th of the j-k-th observation within each tree tij > tij-k
ε ij = error term under the independence condition
Heteroscedasticity was corrected by assuming that the error variance (σ2) can be modeled as a power function of the predicted dominant height
The estimation of the local and global parameters of each dynamic equation, together with the error covariance and variance structure, was programmed for simultaneous fitting with the MODEL procedure of the SAS/ETS statistical package (SAS Institute Inc., 2011). The autocorrelation correction was checked with the Durbin-Watson (DW) statistic (Panik, 2014) and the heteroscedasticity correction was checked by graphical inspection of the residuals against the predicted values.
The goodness-of-fit of the equations was quantitatively assessed by numerical comparisons of the goodness-of-fit statistics: coefficient of determination fitted for the number of parameters (
where,
n = total number of observations used in the fit
p = number of parameters in each dynamic equation
R2 adj, RCME, bias, AIC and DW were used to implement a quantitative rating criterion that, based on Tewari and Singh (2018), derives an overall rating for each model. This evaluation system provides a hierarchical ordering of the quality and statistical performance of the models, where the lowest total rating corresponds to the best model and vice versa.
The biological realism of the dynamic equations was evaluated by comparing the trajectories of the growth curves that each one described for logical values of SI, which were superimposed on the observed growth trends (Tamarit-Urias et al., 2014). With the selected equation and a reference age or base age (Eb) of 50 years, SI curves were constructed to classify the timber productivity of the stands into low, medium and high. The equation was compared with the SI model proposed by Rodríguez-Acosta and Arteaga-Martínez (2005) for the same species and study region. Based on Pretzsch (2009), differential calculus was applied to derive the expressions that determine the current and mean annual increments (CAI and MAI) in dominant height, as well as the respective maximum values for each SI class.
Result and Discussion
The fit of the dynamic equations indicated that all global and autocorrelation parameters (ρ
i
) were significant at the 5 % significance level (Table 3). The goodness-of-fit statistics, shown in Table 4, reveal that
Table 3 Parameters and significance of dynamic equations for modeling dominant height growth and site index of Pinus chiapensis.
| Dynamic equation | Parameter | Estimator | Standard error | T value | Significance |
|---|---|---|---|---|---|
| M1 | β1 | 3.1681 | 0.176 | 18.02 | <0.0001 |
| β2 | 0.0408 | 0.003 | 15.22 | <0.0001 | |
| ρ1 | 0.4582 | 0.023 | 20.05 | <0.0001 | |
| ρ2 | -0.5792 | 0.025 | -22.82 | <0.0001 | |
| M2 | β1 | 0.6234 | 0.037 | 16.92 | <0.0001 |
| β2 | 6.775 | 0.452 | 15 | <0.0001 | |
| ρ1 | 0.5193 | 0.029 | 17.71 | <0.0001 | |
| ρ2 | 0.6576 | 0.031 | 21.49 | <0.0001 | |
| ρ3 | 0.5454 | 0.036 | 15.14 | <0.0001 | |
| M3 | β2 | 27.7074 | 1.534 | 18.06 | <0.0001 |
| β3 | 0.6001 | 0.039 | 15.55 | <0.0001 | |
| ρ1 | 0.5244 | 0.03 | 17.38 | <0.0001 | |
| ρ2 | -0.655 | 0.032 | -20.71 | <0.0001 | |
| ρ3 | 0.5313 | 0.039 | 13.66 | <0.0001 | |
| M4 | β1 | 4 092.5190 | 550.5 | 7.43 | <0.0001 |
| β2 | 1.4722 | 0.062 | 23.75 | <0.0001 | |
| ρ1 | 1.0223 | 0.06 | 17.07 | <0.0001 | |
| ρ2 | 0.8922 | 0.045 | 19.65 | <0.0001 | |
| ρ3 | 0.657 | 0.054 | 12.28 | <0.0001 | |
| M5 | β1 | 3 199.3280 | 343.2 | 9.32 | <0.0001 |
| β2 | 1.3557 | 0.054 | 25.17 | <0.0001 | |
| ρ1 | 0.449 | 0.023 | 19.48 | <0.0001 | |
| ρ2 | -0.5703 | 0.026 | -22.02 | <0.0001 | |
| M6 | β1 | 7.4792 | 0.984 | 7.6 | <0.0001 |
| β2 | 11.9382 | 2.337 | 5.11 | <0.0001 | |
| ρ1 | 0.4474 | 0.023 | 19.54 | <0.0001 | |
| ρ2 | -0.5693 | 0.025 | -22.42 | <0.0001 |
Table 4 Goodness-of-fit statistics of the equations evaluated to model the dominant height growth and site index of Pinus chiapensis.
| Dynamic equation | R2 adj | RCME | Bias | AIC | DW | Order ρ | Total rating |
|---|---|---|---|---|---|---|---|
| M1 | 0.9808 | 1.54 | -0.004 | 304.11 | 1.61 | AR(2) | 25 |
| M2 | 0.9829 | 1.45 | 0.2032 | 258.09 | 1.82 | AR(3) | 14 |
| M3 | 0.9822 | 1.48 | 0.2042 | 276.07 | 1.84 | AR(3) | 17 |
| M4 | 0.984 | 1.4 | 0.1277 | 239.65 | 1.92 | AR(3) | 8 |
| M5 | 0.9817 | 1.5 | 0.0581 | 287.02 | 1.71 | AR(2) | 21 |
| M6 | 0.9818 | 1.49 | 0.0754 | 284.34 | 1.7 | AR(2) | 20 |
R2 adj = coefficient of determination fitted by the number of parameters; RCME = root mean square error; AIC = Akaike's information criterion, DW = Durbin-Watson; AR = autoregressive structure.
Standardized residuals against predicted values of the equations maintained a random trend distribution in all cases (Figure 1), suggesting that heteroscedasticity was minimized to achieve a homoscedastic pattern; therefore, it is inferred that the equations evaluated fit the observed data acceptably. Under this scenario, both corrections allow the estimators obtained in the adjustment to be minimum variance, unbiased and more efficient, which substantially improves the statistical and predictive properties of the equations. In this way, it is possible to estimate realistic confidence intervals and to perform statistical significance tests on parameters with propriety.
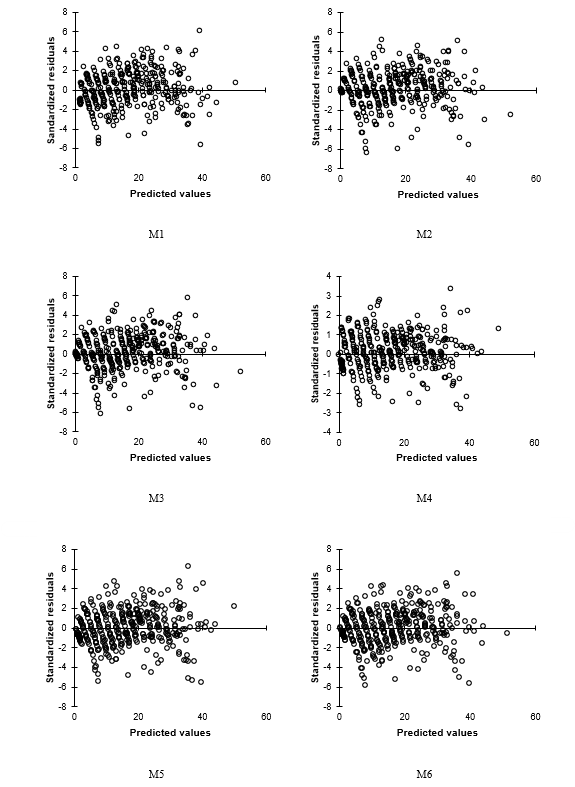
Figure 1 Graphical behavior of the standardized residuals compared to the predicted values of the dominant height of Pinus chiapensis for the equations evaluated.
Figure 2 shows the dominant height growth trends that dynamic equations reproduce for IS values of 22, 27, 32, 37 and 42 m (Eb = 50 years), superimposed on the observed growth trajectories. A close inspection shows that the M2 and M3 functions tend to overestimate the dominant heights at the best site quality at ages above 60 years; before this age, the trend suggests slight underestimation. On the other hand, equations M4 and M5 tend to slight underestimates in the best SI qualities for the whole age interval. Equation M1 exhibited the poorest behavior, as it underestimates in all SI at early ages. This trend of underestimation is maintained for the best sites at mature and long-lived ages.
In contrast, the dynamic equation M6 (Levakovic II base model) showed better biological realism, because growth trends described by this equation overlap better with the observed trajectories at all SI levels and over the entire age interval analyzed. For this reason, equation M6 was selected to describe the dominant height growth pattern and to classify the productivity of natural stands of P. chiapensis in the study area. This selection ratifies that indicated by Özçelik et al. (2019), in the sense that the functions with the best fit statistics do not always best reproduce the observed trends. In this case, statistically, equation M6 ranked second to last; however, given the biological realism it recreates, it clearly has the highest predictive ability. This choice rather than a pure exercise of statistical inference was the product of a compromise and balance between statistical performance and biological reasons. Equation M6 has parsimony with only two parameters, sufficient to reveal the true growth trends at the observed dominant heights.
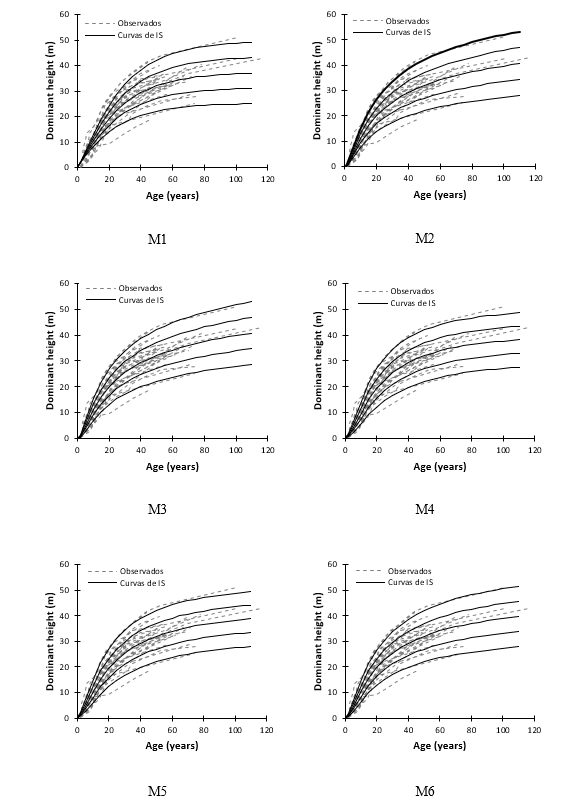
Figure 2 Behavior of the site index (SI) curves reproduced by the dynamic equations evaluated superimposed on growth trajectories observed in Pinus chiapensis.
Based on the parameter values of the dynamic equation M6 and an Eb = 50 years, SI curves were built for three productivity levels labeled as low, medium and high, whose mean values correspond to SI of 25, 32 and 39 m, respectively (Figure 3a). These curves together with their respective limits, in particular the lower and upper limits of the low and high classes, covered the amplitude and trends of all growth series in the analyzed age range. For this reason, the established SI classes were considered enough for productivity classification of natural P. chiapensis stands in the study area.
The GADA to generate the M6 equation in combination with the Dummy variable technique to fit it, together with the autocorrelation and heteroscedasticity corrections, achieve a robust dynamic equation for reliable predictions. This aspect is better appreciated when contrasting the SI curves with those reproduced by the SI model proposed by Rodríguez-Acosta and Arteaga-Martínez (2005) (Figure 3b), which corresponds to a polymorphic model, whose base model is the Chapman-Richards model. It is evident that for an Eb = 50 years and the IS values referred to the polymorphic model does not adequately describe the dominant height growth of P. chiapensis. The greatest deficiency is seen for the high SI class, where the growth trends are illogical because the curves collapse, because the value of the horizontal asymptote of the model is lower than the actual height suggested by the observed data. The differences can be explained from a mathematical-statistical point of view, because to generate the polymorphic model they used the algebraic difference approach, in which only the shape parameter was site-dependent and, autocorrelation and heteroscedasticity were not corrected.
The dominant heights of 25, 32 and 39 m estimated by the new equation, which are equivalent to the SI values (Eb = 50 years), are slightly higher than 24.2, 29.7 and 35.5 m (Eb = 50 years), heights determined by the model proposed by Sánchez and Del Castillo (2001). These authors used data from temporal sample plot and fitted linear models by growth condition in the estimation of SI for even-aged natural stands of P. chiapensis in the Sierra Norte de Oaxaca, Mexico. This difference suggests that growth conditions given by physical and environmental conditions at the Veracruz and Puebla sites are comparatively better. Del Castillo et al. (2009) report that long-lived individual trees of this species, in the best seasonal qualities, can reach heights of up to 50 m, as evidenced by the observations of the present study for the high IS class.
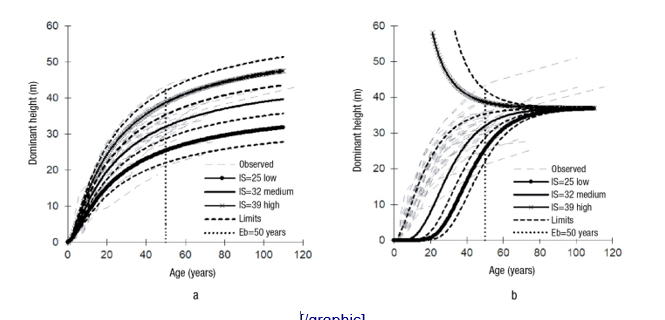
Figure 3 Graphical comparison of the site index (SI) curves generated by the (a) new dynamic equation and (b) the model of Rodríguez-Acosta and Arteaga-Martínez (2005).
An analysis of the polymorphic function derived by algebraic difference approach with the Hossfeld IV base model, developed by Fierros-Mateo, De los Santos-Posadas, Fierros-González, and Cruz-Cobos (2017) for the same species, showed that with an Eb = 8 years and SI classes of 6, 10, and 14 m, the dominant height growth of the observed data could be modeled acceptably up to 20 years; subsequently, it tends to a maximum asymptotic ceiling of 33 m, which is lower than the maximum observed heights. This disparity, even though the study area was similar (UMAFOR 2103), can be explained by the fact that this study processed information from young commercial plantations with an age range of 1 to 8 years.
With SI values of 25, 32 and 39 m and Eb = 50 years, the dynamic equation in GADA of the Chapman-Richards base model
Expressions 1 and 2, whose X 0 component is shown in Table 2, derived from the dynamic equation M6, are useful for bulding MAI and CAI curves per SI class. While expressions 3 and 4, derived from the same equation, are useful to determine the maximum mean annual increment (MAImax) and the maximum current annual increment (CAImax) by productivity level.
Results of the CAI, MAI and maximum increments show that the M6 equation consistently satisfies the logical assumption that the age at which such increments are reached decreases as the SI increases (Table 5). It is also satisfied that the increments are larger as the value of SI increases. In agreement with Seki and Sakici (2017) and Socha et al. (2020), it is ratified that the developed dynamic equation fully complies with the biological growth laws.
Table 5 Ages at which the maximum mean and current annual increments (MAI and CAI) and dominant height increments per site index (SI) class occur for Pinus chiapensis.
| SI class (m) | Age MAImax (years) | MAImax (m∙yr-1) | Age CAImax (year) | CAImax (m∙yr-1) |
|---|---|---|---|---|
| 25 | 12.4 | 0.8 | 6.2 | 0.95 |
| 32 | 11.08 | 1.07 | 5.54 | 1.25 |
| 39 | 10.11 | 1.35 | 5.05 | 1.57 |
The fact that these relevant assumptions are met is consistent with Ercanli, Kahriman, and Yavuz (2014) and Seki and Sakici (2017), that dynamic equations derived using GADA have greater flexibility to model a wide variety of growth trends. These equations meet all the desirable attributes that translate into consistency and biological realism, so they should be used to model natural and artificial forest growth. Hereby, it is considered that, for the development of new SI dynamic equations in Mexico, the use of the GADA should be prioritized and that two site-specific parameters should be used in each base growth model. Furthermore, some fitting method that is invariant to the base age should be used, such as the Dummy variable method (Sghaier et al., 2012), the nested iterative procedure (Sharma, Brunner, Eid, & Øyen, 2011) or the mixed effects model technique (Tamarit-Urias et al., 2014). Autocorrelation and heteroscedasticity should also be corrected to obtain more robust models that meet the theoretical assumptions of regression analysis. This will allow to be at the level of the international trend since, as Özçelik et al. (2019) refer, it is common that when data from stem analysis or permanent plots with remeasurements are available, the referred mathematical and statistical refinements are used.
By contrasting the ages when optimal technical rotation occurs (MAI = CAI) at the dominant height, per SI class of the dynamic equation M6, it is inferred that P. chiapensis tends to constant growth rates in the study area. This is because the differences in occurrence are small, leading to the fact that the SI curves could be considered quasianamorphic. This growth trend was also observed by Calegario, Daniels, Maestri, and Neiva (2005) in clones of the genus Eucalyptus in the states of Bahia and Espírito in Brazil.
Conclusions
The developed dynamic site index equation, derived from the Levakovic II growth model, has a biological basis and solid mathematical-statistical rigor; in addition, it generates polymorphic curves with variable asymptotes that closely match the reality of the observed growth. Moreover, the equation meets desirable logical attributes among which biological realism, invariance to base and path age, flexibility, parsimony and consistency stand out. Its use is recommended as a current and reliable tool for silvicultural management for predicting dominant height growth and determining the productive potential of natural stands of Pinus chiapensis in Puebla and Veracruz, Mexico. The equation can be used as a basic component of growth and timber yield systems. This new equation showed better performance due to a superior predictive capacity compared to a previous polymorphic site index model for the same species and region.

