


 texto en
  Inglés (pdf)
 Artículo en XML
 Referencias del artículo
 Enviar artículo por email
 Citado por SciELO
  Similares en
SciELO
Similares en
SciELO 
 Permalink
Highlights:
Climate change impact was assessed on the distribution of 10 tree species.
The impact for the 2050 and 2080 horizons and the RCP 4.5 and 8.5 emissions scenarios was assessed.
Juglans pyriformis increases its distribution in RCP 4.5 (2050 and 2080) and RCP 8.5-2050.
All 10 species studied reduce their distribution in the RCP 8.5 scenario by 2080.
Introduction
Climate change is causing problems in the environment as a consequence of complex interactions between climate and ecology, and with social, economic and political processes; it is predicted that these problems will become more severe (Villers-Ruiz & Trejo-Vázquez, 2004). This change is considered a threat to the conservation of many plants and animals; 50 % of vascular plant species are at risk of extinction as a result of such phenomenon (Intergovernmental Panel on Climate Change [IPCC], 2014).
Global climate change is expected to reduce the distribution of several species (Alfonso-Corrado et al., 2017; Manzanilla-Quijada, Treviño-Garza, Aguirre-Calderón, Yerena-Yamallel, & Manzanilla-Quiñones, 2020; Monterroso-Rivas, Gómez-Díaz, & Tinoco-Rueda, 2013), particularly terrestrial species (Ponce-Reyes et al., 2012). Many of them will become extinct (Alfonso-Corrado et al., 2017) and others will decrease their populations (Téllez-Valdés & Dávila-Aranda, 2003); however, new climatic conditions are expected to stimulate the ability of certain species to migrate and adapt to emerging environmental conditions (Gray, 2005; IPCC, 2014).
Species distribution models are a useful tool for assessing the potential impact of climate change. These models detect changes by comparing their current potential distribution areas with their potential distribution areas under future climatic conditions (Peterson et al., 2011).
Mexican temperate forests are included among the ecosystems with the greatest negative impact of climate change (Gual-Díaz & González-Medrano, 2014; Gutiérrez & Trejo, 2014; Ponce-Reyes et al., 2012; Villers-Ruiz & Castañeda-Aguado, 2013). Among temperate forests, the cloud forest (CF) is considered the type of vegetation that hosts the greatest diversity of species, both flora and fauna, in relation to its area (González-Espinosa, Meave, Lorea-Hernández, Ibarra-Manríquez, & Newton, 2011; Gual-Díaz & González-Medrano, 2014; Luna-Vega, Alcántara, Contreras-Medina, & Vargas, 2006; Rzedowski, 2006). It is estimated that CF is the habitat of more than 6 790 species of vascular plants, of which about 35 % are endemic (Luna-Vega & Magallón, 2010). The area covered by CF does not exceed 1 % of the national territory (Sánchez-Ramos & Dirzo, 2014). In Mexico has been reported the presence of CF in just over 100 localities distributed in the form of an archipelago with different size, from a few hectares to tens of thousands of hectares (González-Espinosa et al., 2011). This fragmented distribution is limited to mountainous areas with abrupt topography, in particular ravines and areas protected from solar radiation and strong winds (Luna-Vega & Magallón, 2010; Rzedowski, 2006).
Currently, Mexican CF and its remarkable biodiversity face threats caused by land-use change and continued population expansion into mountainous regions, coupled with the low representation of this ecosystem in the Mexican natural protected areas (Espejo-Serna, 2014; González-Espinosa et al., 2011; Jiménez-García & Peterson, 2019; Ponce-Reyes et al., 2012). Studies carried out with CF plants, using distribution modeling under climate change scenarios, show that, species tend to reduce their distribution areas (Alfonso-Corrado et al., 2017; Jiménez-García & Peterson, 2019; Manzanilla-Quijada et al., 2020; Monterroso-Rivas et al., 2013; Vásquez-Morales et al., 2014).
CF is a threatened type of vegetation, and therefore efforts are required for conservation and study. This study evaluated the distribution of 10 tree species characteristic of CF in the state of Oaxaca, including two climate change scenarios. For this purpose, species distribution models were used to predict the impact of climate change on current and future distribution.
Materials and Methods
Study area
Oaxaca has a land area of 93 758 km2. The state has the second largest area of CF with 2 273 km2 (Instituto Nacional de Estadística y Geografía [INEGI], 2016) distributed in the Sierra Norte (Sierra de Juárez), Cañada (Sierra Mazateca) and Istmo (Chimalapas area) regions on the Gulf slope, and in the Sierra Sur and Mixteca (Sierra Madre del Sur) regions on the Pacific slope (Figure 1). In Oaxaca, the CF is mainly located in areas with altitudes of 1 000 to 2 500 m (Torres-Colín, 2004), mean annual temperature between 16 and 20 °C, and mean annual precipitation of 2 000 to 4 500 mm. Semi-warm and humid temperate climates with frequent fog and summer rains predominate during May to October (Trejo-Vázquez, 2004).

Data collection
A total of ten species of tree genera characteristic of CF were selected (Table 1): Carpinus tropicalis (Donn. Sm.) Lundell, Juglans pyriformis Liebm., Liquidambar styraciflua L., Litsea glaucescens Kunth, Magnolia dealbata Zucc., Magnolia schiedeana Schltdl., Ostrya virginiana (Mill.) K. Koch, Symplocos coccinea Bonpl., Zinowiewia concinna Lundell and Taxus globosa Schltdl (Alcántara, Luna-Vega, & Velázquez, 2002; Rzedowski, 1996). All of these, except for L. styraciflua, are included in some risk category according to the Mexican Official Standard NOM-059 (Secretaría del Medio Ambiente y Recursos Naturales [SEMARNAT], 2010) and with threatened status according to the International Union for Conservation of Nature (IUCN) (González-Espinosa et al., 2011).
Species records were obtained exclusively from specimens deposited in botanical collections in the country: Herbario Nacional de México (MEXU) of the Instituto de Biología, UNAM; Herbario of the Escuela Nacional de Ciencias Biológicas of Instituto Politécnico Nacional (ENCB); Herbario of Instituto de Ecología, A. C. in Xalapa (XAL); Herbario Nacional Forestal (INIF); Herbario of CIIDIR-IPN, Unidad Oaxaca (OAX); Herbario of Universidad Autónoma Metropolitana, Unidad Iztapalapa (UAMIZ); and Herbario de la Sociedad para el Estudio de los Recursos Bióticos de Oaxaca (SERO). A database of georeferenced records for each species was developed with the information obtained. Duplicate records, as well as those located in urban areas, were excluded from the analysis. Information from specimens deposited in herbaria is of great value, because specimens can be examined and reviewed on subsequent occasions and any situation associated with their correct taxonomic determination can be assessed (James et al., 2018).
Climate variables
Current and future models (2050 and 2080) were constructed from 19 climate variables (Table 1) from the WorldClim database (Hijmans, Cameron, Parra, Jones, & Jarvis, 2005). These were generated by interpolation of data from 9 000 and 60 000 weather stations from the period 1960-1990 and represent monthly values of precipitation, minimum and maximum temperature with a spatial resolution of 0.0083° (about 1 km2). Such variables have been used in Mexican species distribution modeling studies (Alfonso-Corrado et al., 2017; Manzanilla-Quiñones et al., 2019; Monterroso-Rivas et al., 2013).
Table 1 Selection of climate variables for the construction of species distribution models according to the Jackknife test.
| Species | Climate variables |
|---|---|
| Liquidambar styraciflua | Bio 2, Bio 4, Bio 6, Bio 9, Bio 10, Bio 14, Bio 15, Bio 16, Bio 17, Bio 19 |
| Carpinus tropicalis | Bio 2, Bio 5, Bio 6, Bio 7, Bio 9, Bio 10, Bio 12, Bio 13, Bio 14, Bio 15, Bio 16 |
| Ostrya virginiana | Bio 2, Bio 3, Bio 5, Bio 6, Bio 7, Bio 9, Bio 10, Bio 11, Bio 12, Bio 13, Bio 15, Bio 16, Bio 17, Bio 18, Bio 19 |
| Zinowiewia concinna | Bio 5, Bio 6, Bio 9, Bio 10, Bio 11, Bio 16, Bio 17, Bio 18 |
| Juglans pyriformis | Bio 6, Bio 14, Bio 15, Bio 18 |
| Litsea glaucescens | Bio 1, Bio 2, Bio 3, Bio 4, Bio 5, Bio 6, Bio 7, Bio 8, Bio 9, Bio 10, Bio 11, Bio 12, Bio 14, Bio 15, Bio 16, Bio 17, Bio 18, Bio 19 |
| Magnolia dealbata | Bio 1, Bio 2, Bio 4, Bio 5, Bio 6, Bio 7, Bio 8, Bio 12, Bio 13, Bio 14, Bio 15, Bio 17, Bio 18, Bio 19 |
| Magnolia schiedeana | Bio 2, Bio 3, Bio 5, Bio 6, Bio 8, Bio 11, Bio 17, Bio 18, Bio 19 |
| Symplocos coccinea | Bio 1, Bio 2, Bio 4, Bio 6, Bio 7, Bio 8, Bio 9, Bio 10, Bio 11, Bio 13, Bio 18, Bio 19 |
| Taxus globosa | Bio 2, Bio 5, Bio 6, Bio 8, Bio 10, Bio 18, Bio 19 |
Bio 1: average annual temperature (°C). Bio 2: daily temperature oscillation (°C). Bio 3: isothermality (°C). Bio 4: temperature seasonality (°C). Bio 5: average maximum temperature of the warmest period (°C). Bio 6: average minimum temperature of the coldest period (°C). Bio 7: annual temperature oscillation (°C). Bio 8, Bio 9, Bio 10 and Bio 11: average temperature (°C) of the rainiest, driest, warmest and coldest quarters, respectively. Bio 12: annual precipitation (mm). Bio 13 and Bio 14: precipitation (mm) of the rainiest and driest period, respectively. Bio 15: seasonality of precipitation (mm). Bio 16, Bio 17, Bio 18 and Bio 19: precipitation (mm) of the rainiest, driest, warmest and coldest quarters, respectively.
Species distribution modeling
Distribution models were obtained from georeferenced records of species and climate variables. The current and future potential distribution was estimated with the MaxEnt software (Phillips, Anderson, & Schapire, 2006), which aims to generate inferences based on a series of punctual data combined with climatic information. In this way, the probability of species presence with an uniform distribution is adapted until a maximum entropy is reached. The algorithm implemented in MaxEnt estimates the probability of suitable areas for species distribution from presence data and does not require absence data; moreover, it is particularly efficient when there are few records available (Manzanilla-Quiñones et al., 2019; Pearson, Raxworthy, Nakamura, & Peterson, 2007; Phillips & Dudik, 2008). The variable clusters for each species were defined using the Jackknife test in MaxEnt (Phillips et al., 2006). The result of this test identified those variables that provide unique information (Table 1). To calibrate the species modeling, 75 % of the records were used for training and model generation and the remaining 25 % for validation. Twenty replicates and 1 000 iterations were used. The clamping and extrapolation options were disabled to keep constant the extreme values of the variables that had a different interval in future climatic conditions and thus avoid artificial extrapolations (Elith et al., 2011). Models were run with the logistic format that uses a suitability interval from 0 to 1, where low values indicate that conditions are not suitable for the presence of the species and high values (>0.5) indicate that conditions are suitable (Manzanilla-Quiñones et al., 2019). The average model for each species optimized the potential distribution and estimated the approximate potential area to be occupied.
Models validation
The models were evaluated with the ROC (Receiver Operating Characteristic) curve, implemented in MaxEnt, which describes the rate of correct identification of presences against the rate of commission errors. The area under the curve (AUC) was also obtained (Phillips et al., 2006) with values from 0 to 1, regarding that there is a good fit with the evaluation data when the values are close to 1; values between 0.7-0.9 are considered models with good accuracy (Alfonso-Corrado et al., 2017; Phillips & Dudik, 2008), while those greater than 0.9 are considered excellent (Manzanilla-Quiñones et al., 2019; Peterson et al., 2011).
Furthermore, the models were analyzed with the partial ROC test, which was developed to counterbalance the differences or error of the AUC, since it weights equally the values of commission and omission. The areas on the far right and left side of the AUC represent the high false positive and false negative rates respectively, so that, if the objective is to maximize correct predictions and reduce the value of commission errors, the important parts would be located in the middle and right side of the AUC (Lobo, Jiménez-Valverde, & Real, 2008). In the case of the partial ROC, the values cover the interval from 0 to 2, where 1 is equivalent to a completely random model, while values greater than 1 indicate that models have good prediction of the optimal climatic habitat for species development (Peterson, Papes, & Soberón, 2008). Then, partial ROC, AUC radius ratio, and P value were used to evaluate the model (Jiménez-García & Peterson, 2019; Peterson et al., 2008).
Climate change modeling
The general atmospheric circulation model (GCM) used was HadGEM2-ES, which is a climate simulation with favorable projection for the south-southeast region of the country and which decreases uncertainty due to the complex topography of the area (Cavazos et al., 2013; Torres-Alavez, Cavazos, & Turrent, 2014). This climate model has been used by several authors to evaluate biodiversity aspects in the country (Arce-Romero, Monterroso-Rivas, Gómez-Díaz, & Cruz-León, 2017; Cavazos et al., 2013; Durán et al., 2016).
The IPCC 5th Assessment Report (2014) defined four emission scenarios called Representative Concentration Pathways (RCPs). These are identified by their radiative forcing for the year 2100 ranging from 2.6 to 8.5 W∙m-2. Each RCP has an associated high spatial resolution database of pollution emissions, greenhouse gases (GHG) emissions and concentrations, and land use up to 2100, based on a combination of models of varying complexity of atmospheric chemistry and the carbon cycle. It includes a severe mitigation scenario (RCP 2.6), two intermediate scenarios (RCP 4.5 and 6.0) and a scenario with a very high level of GHG emissions (RCP 8.5). RCP 4.5 represents a scenario that maintains a stable radiative forcing for 2100, with a CO2 concentration of 538 ppm and a temperature increase of 2.5 °C. For RCP 6.0 and 8.5, the trend of their radiative forcing will be increasing, with a concentration of 670 ppm and 936 ppm CO2, respectively, while temperature will increase by approximately 3 °C and 5 °C, respectively (Cavazos et al., 2013; IPCC, 2014). In the present study, two emission scenarios were considered, RCP 4.5 and RCP 8.5, which represent the extremes of atmospheric conditions and have been used in climate change assessments in tree species in Mexico (Alfonso-Corrado et al., 2017; Arce-Romero et al., 2017; Durán et al., 2016; Jiménez-García & Peterson, 2019; Pérez-Miranda et al., 2019). As for the time horizons (TH), 2050 and 2080 are available for the MGC used, as well as for their RCPs, with a spatial resolution of approximately 1 km2. The resulting maps were visualized and manipulated using ArcGis (Environmental Systems Research Institute [ESRI], 2012).
Evaluation of changes in distribution areas
Distribution model maps for each species were reclassified. Each was assigned an interval with five presence classes (very high, high, medium, medium, low and very low) to analyze, in a simple way, the probability of the species to be distributed in an area.
The percentage change in species distribution was calculated according to Gutiérrez and Trejo (2014) and the number of pixels for each of the proposed classes was quantified. This process was carried out for each of the species, for the two THs and for the two RCPs, by applying the formula % = [((t1 - t0)/t0) ∗ 100]; where, t0 and t1 are the number of pixels of presence for the current time and for the future time horizon, respectively.
Results
Current distribution models
A total of 356 records were obtained for the 10 species: C. tropicalis (34), J. pyriformis (10), L. styraciflua (63), L. glaucescens (125), M. dealbata (17), M. schiedeana (11), O. virginiana (39), S. coccinea (28), Z. concinna (8) and T. globosa (21). The current potential distribution area obtained by the models for each species is shown in Table 2; all presented AUC greater than 0.8 and partial ROC greater than 1.7.
Table 2 Current potential distribution area estimated for the species analyzed and values of the respective area under the curve (AUC) and partial ROC (Receiver Operating Characteristic) curve.
| Species | Area | AUC | Partial ROC |
|---|---|---|---|
| Liquidambar styraciflua | 1 919 km2 | 0.901 | 1.869 |
| Carpinus tropicalis | 2 578 km2 | 0.871 | 1.84 |
| Ostrya virginiana | 2 573 km2 | 0.848 | 1.825 |
| Zinowiewia concinna | 3 300 km2 | 0.828 | 1.767 |
| Juglans pyriformis | 1 768 km2 | 0.826 | 1.721 |
| Litsea glaucescens | 3 350 km2 | 0.835 | 1.76 |
| Magnolia dealbata | 1 406 km2 | 0.928 | 1.89 |
| Magnolia schiedeana | 1 832 km2 | 0.849 | 1.77 |
| Symplocos coccinea | 651 km2 | 0.964 | 1.922 |
| Taxus globosa | 529 km2 | 0.971 | 1.974 |
Evaluation of climate change models
RCP 4.5: 2050 and 2080 time horizons
In the first period analyzed (current-2050), species responses were classified as negative or positive. Negative responses are those showing losses in their distribution area, while positive responses indicate gains. Of the selected species only J. pyriformis (Figure 2) showed a positive response with an increase of 83.6 %. In the case of L. glaucescens, the distribution area is maintained with respect to the current one. The rest of the species had a negative response; most of them did not present a loss of more than 30 % with respect to the current potential area (Figure 3).
For the second period (current-2080), the responses were different. Four of the species increased their distribution: J. pyriformis (20.5 %), L. styraciflua (7.8 %), L. glaucescens (2.8 %) and S. coccinea (6.9 %). Zinowiewia concinna reported a minimal gain (0.15 %); however, although its response can be considered positive, it does not represent a significant change. The rest of the species had a negative response, but compared to the first period, the percentage change was less than 20 % (Figure 3).
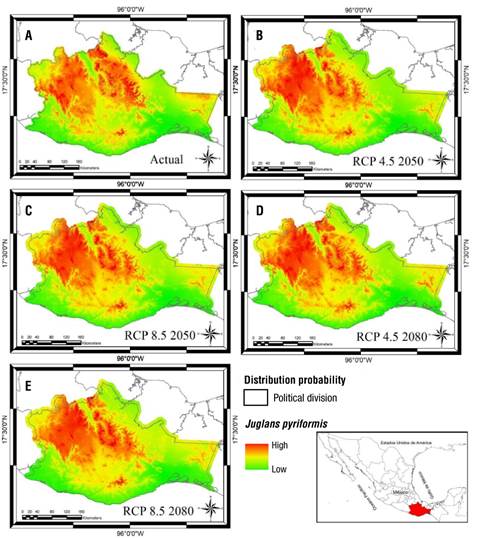
Figure 2 Distribution models of Juglans pyriformis in Oaxaca, Mexico. A) Current modeling (1 768 km2), B) RCP 4.5 2050 scenario (3 248 km2), C) RCP 4.5 2080 scenario (2 132 km2), D) RCP 8.5 2050 scenario (2 004 km2), E) RCP 8.5 2080 scenario (1 278 km2).

RCP 8.5: 2050 and 2080 time horizons
Modeling with RCP 8.5 scenario (current-2050) showed that J. pyriformis (Figure 2) and O. virginiana (Figure 4) have positive response with a gain greater than 5 % of their current potential distribution. The remaining eight species had a negative response with a distribution area loss of no more than 10 % (Figure 5).
For the second period of this scenario (current-2080), all species showed negative response; that is, some of them lost more than 10 % of their distribution area with respect to the current one (Figure 5).
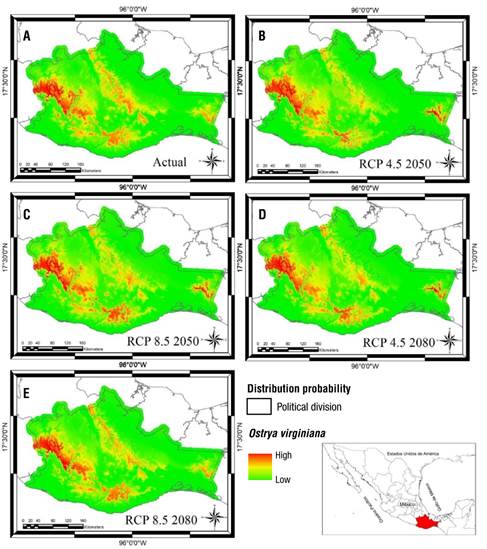
Figure 4 Distribution models of Ostrya virginiana in Oaxaca, Mexico. A) Current modeling (2 573 km2), B) RCP 4.5 2050 scenario (2 438 km2), C) RCP 4.5 2080 scenario (2 494 km2), D) RCP 8.5 2050 scenario (2 787 km2), E) RCP 8.5 2080 scenario (2 473 km2).

Discussion
According to the information predicted by the models, the species studied will be subject to pressures as a consequence of the alterations caused in the environment by climate change (e.g. increase in aridity and decrease in precipitation). Species will have to respond to such changes in relatively short times (Villers-Ruiz & Trejo-Vázquez, 2004). Survival will depend on their ability to adapt to climate change and their ability to migrate to places with optimal conditions (Gray, 2005; Martínez-Meyer, Díaz-Porras, Peterson, & Yañez-Arenas, 2013; Villers-Ruiz & Castañeda-Aguado, 2013). However, it should be considered that changes in vegetation distribution occur slowly and that the areas in which they become established may not be suitable soils for the species (Gray, 2005).
M. schiedeana and Z. concinna were poorly represented in herbaria; in some cases, herbarium records show the limited distribution of a species and its low population density (Contreras-Medina, Luna-Vega, & Ríos-Muñoz, 2010). Therefore, the study of these species is important due to the risk of decline in their distribution area, as nine of these species are within a threatened category in the Mexican Official Standard NOM-059 (SEMARNAT, 2010). Unfortunately, the low number of specimens recorded in herbaria prevents the elaboration of conclusive distribution models; this problem is evident in most species of the flora of Mexico, due to the scarcity of studies documenting the complete distribution area of the species. However, some authors consider that the model of a species, even if it has few records, is important, because it represents a guide to the specific sites where it can be found and where there is still no evidence of its presence (Alfonso-Corrado et al., 2017; Pearson et al., 2007). In addition, they are of great help in the estimation of the existing diversity in Natural Protected Areas to formulate a conservation program (Alfonso-Corrado et al., 2017; Jiménez-García & Peterson, 2019).
CF require specific climatic conditions for survival, mainly moisture (Luna-Vega & Magallón, 2010; Monterroso-Rivas et al., 2013; Rzedowski, 1996). Climate change reduces the entry of moisture into forests and their maintenance, leading to their fragmentation and loss of less drought-tolerant species, causing some plant and animal populations to become locally extinct (Alfonso-Corrado et al., 2017; Téllez-Valdés & Dávila-Aranda, 2003).
The response of each species regarding the climate change scenarios (RCP 4.5 and RCP 8.5) indicates that most of these species reduce their distribution area and very few are likely to expand it. This varied response is due to the establishment of optimal environmental conditions that facilitate the expansion of species expansion or limiting conditions that prevent it, a situation directly related to the intrinsic characteristics of taxa (Martínez-Meyer, 2012). Climate change is a factor that promotes the reduction of distribution areas of temperate taxa, rather than gain. The results are congruent with those already reported for other taxonomic groups of the biota of Mexico (Alfonso-Corrado et al., 2017; Arce-Romero et al., 2017; Durán et al., 2016; Gutiérrez & Trejo, 2014; Jiménez-García & Peterson, 2019; Luna-Vega, Alcántara, Contreras-Medina, & Ríos-Muñoz, 2012; Manzanilla-Quijada et al., 2020; Monterroso-Rivas et al., 2013; Pérez-Miranda et al., 2019; Villers-Ruiz & Castañeda-Aguado, 2013).
Vásquez-Morales et al. (2014) reported that, in the year 2050, the distribution of M. schiedeana will decrease 0.36 %, while by 2080 the decrease will be 1.94 %. The results of this study indicate that, for TH 2050 RCP 4.5, the loss of area will be 8.35 %, and for RCP 8.5, the species increases almost 1 % of the area with respect to the present one. For TH 2080, both scenarios (4.5 and 8.5) lose considerable area (1.64 % and 13.67 %, respectively). The methodology used by Vásquez-Morales et al. (2014) is different from that of the present study, as well as the evaluation they performed for the entire distribution area in the country and the scenarios used that consider different values and characteristics.
Contreras-Medina et al. (2010) modeled the potential distribution of T. globosa for the entire country and used three land use scenarios for 1976, 1996 and 2000. That study reported a significant reduction in distribution of up to 84 %. In comparison with the analyses of the present study, the reduction situation prevails in all future climate change scenarios.
Monterroso-Rivas et al. (2013) analyzed the distribution of some CF tree species under climate change scenarios in Hidalgo, including C. tropicalis and L. styraciflua. The authors concluded that the latter will benefit from changes in future climate, as it increases its distribution area because it is a species that grows well in disturbed environments, while for C. tropicalis the climatic conditions will become adverse. The results of the present study are similar for C. tropicalis in both scenarios and in the two TH considered, while L. styraciflua shows variations of increase or decrease depending on the emissions scenario and the TH analyzed.
Jiménez-García and Peterson (2019) modeled the ecological niche of several CF tree species under climate change scenarios in mountainous areas of Mexico by 2050, including S. coccinea. These authors concluded that the distribution area is reduced under both emission scenarios (RCP 4.5 and RCP 8.5), a situation that coincides with the results of the present study.
The distribution models for the species in this study show areas where they have not been recorded, possibly due to lack of sampling in specific areas of Oaxaca as suggested by some authors (García-Mendoza & Meave, 2011; Ramírez-Toro et al., 2017). These models can be used for the formulation of a grounded and consistent proposal of priority areas for conservation and natural protected areas of temperate forests in Oaxaca, considering that the Sierra Norte is the region with the largest area of CF in the country (Anta-Fonseca et al., 2010). Recently, the vulnerability of Oaxaca's CF to climate change has been exhibited, showing that the Sierra Norte is a key area that requires protection (Alfonso-Corrado et al., 2017; Anta-Fonseca et al., 2010; Gómez-Mendoza, Galicia, & Aguilar-Santelises, 2008; Jiménez-García & Peterson, 2019; Ponce-Reyes et al., 2012), a region where inhabit almost all the species analyzed in this study.
Conclusions
The distribution models provided valuable information on the areas with probability of presence of 10 tree species of cloud forest (CF) in their current and future distribution (2050 and 2080) in Oaxaca. Current climatic conditions will be affected, and species will tend to reduce their distribution areas, mainly under the RCP 8.5 scenario and the 2080 horizon; consequently, the CF will also be affected as an ecosystem. The distribution of some of the species was modeled for the first time and the analysis supports their inclusion as threatened and in some risk category based on NOM-059. The predictive models indicate that it is necessary to further evaluate the populations and the particular requirements of the species, to propose actions for preservation and monitoring under climate change, as well as for the protection of an important and biodiverse ecosystem in Mexico that is already considered threatened.

