


 texto em
  Inglês (pdf)
 Artigo em XML
 Referências do artigo
 Enviar este artigo por email
 Citado por SciELO
  Similares em
SciELO
Similares em
SciELO 
 Permalink
Highlights
The average temperature of the Monarch Butterfly reserve increased 0.87 °C in 20 years studied.
The beginning, middle, and end of the growing season have occurred earlier in the reserve.
Greening was recorded in 53.21 % of the reserve and browning in 33.97 %.
The increase in average temperature affects the phenology of the Monarch Butterfly Biosphere Reserve.
Introduction
The atmosphere, geosphere, and biosphere have been driven by humans beyond the typical conditions of the current interglacial epoch (Buitenwerf, Sandel, Normand, Mimet, & Svenning, 2018), directing the planet towards a different stage, the Anthropocene (Arias-Maldonado, 2018), which main manifestation is global changes in the original vegetation (Buitenwerf et al., 2018). Greening of the Earth has been the most distinctive effect in the last 30 years (Zeng, Peng, & Piao, 2018). Greening and browning are defined, respectively, as statistically significant increases and decreases in the average annual green leaf area at a location over a period; globally, it is estimated that one-third of vegetated areas are greening and 5% are browning (Chen et al., 2019). The main causes of vegetation increase are climate, in addition to the increase in CO2 concentration, N deposition, oscillation of atmospheric variables (Gao, Liang, & He, 2019) and land use change (Forzieri, Alkama, Miralles, & Cescatti, 2017; Zeng et al., 2018).
Changes in vegetation physiology and structure associated with greening can affect the global energy balance and fluxes of major elements, including carbon, nitrogen, and water; they can also regulate surface temperatures by affecting exchanges between the Earth and the atmosphere (Buitenwerf et al., 2018; Forzieri et al., 2017; Zeng et al., 2018). Effects on global water cycle occur through modification of terrestrial evapotranspiration leading to cooling of the Earth's surface, recycling of atmospheric precipitation (Zeng et al., 2018) and regulation of soil moisture, which affects plant functioning (Buitenwerf et al., 2018; Montgomery, Rice, Stefanski, Rich, & Reich, 2020). Thereby, positive feedback occurs in the terrestrial climate system that amplifies the biophysical impacts of greening on surface energy fluxes (Forzieri et al., 2017). Greening has mitigated 12 % of global warming of the Earth's surface over the past 30 years (Zeng et al., 2017), which exceeds recent estimates of climate warming caused by deforestation (Forzieri et al., 2017). The interaction between vegetation and climate is largely driven by the impact of vegetation on temperature and not vice versa (Forzieri et al., 2018).
Repeated and consistent satellite observations have recently been used to assess biophysical impacts of land cover transitions on global climate (Forzieri et al., 2017). Indices such as LAI (Leaf Area Index), NDVI (Normalised Difference Vegetation Index) and NPP (Net Primary Production) are derived from satellite observations since the 1980s (Buitenwerf et al., 2018; Cui et al., 2018). LAI is a key structural parameter of vegetation that largely estimates the result of Earth-climate interactions and feedbacks (Forzieri et al., 2017). According to Zeng et al. (2018), global LAI increased significantly 8 % between 1982 and 2011 with net leaf area increase of 2.3 % per decade (Chen et al., 2019) and a statistically significant positive trend in 46 % of the global vegetated surface (Forzieri et al., 2017).
Plant phenology is closely related to seasonal changes in temperature, available humidity and radiation, and this seasonality affects the availability of food for migratory animals and breeding processes (Vrieling et al., 2018). This could be the case of monarch butterflies that, coming from the United States and Canada, arrive annually to the Monarch Butterfly Biosphere Reserve (MBBR) to spend the winter season. However, populations of this lepidopteran have decreased in recent years (Leverkus, Jaramillo-López, Brower, Lindenmayer, & Williams, 2017); this is coupled with the effect that global climate change may be having on the forest.
The objective of this work was to study the impact of climate change over the last 20 years (2000-2019) in the MBBR, based on the analysis of the GEOV1 series of LAI from the European Copernicus program (Baret et al., 2013), to (1) describe variations in climate and phenology; (2) analyze the relationships between LAI and climate; and (3) estimate greening.
Materials and methods
Study area
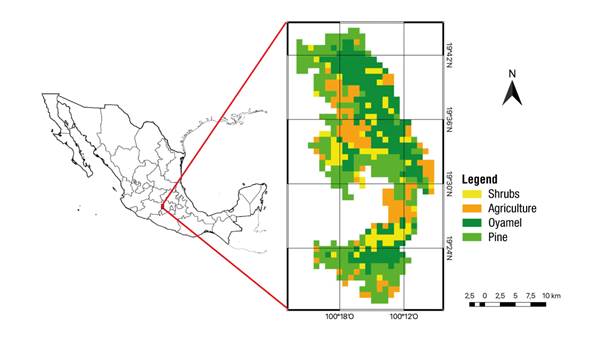
The MBBR, winter refuge of the butterfly Danaus plexippus L., is located between the states of Michoacán and Estado de México (100.16°-100.37° W and 19.32°-19.75° N) in the fisiographic province Neovolcanic Axis. The surface area is 56 259 ha. The climate is temperate sub-humid with summer rainfall, mean annual precipitation of 830 mm and mean annual temperature of 15.7 °C. Elevations range from 1 800 to 3 640 m with steep slopes. At lower elevations, the vegetation is representative of a temperate Pinus-Quercus forest and there are agricultural plots, mainly rainfed; at higher elevations oyamel forest (Abies religiosa [Kunth] Schltdl. & Cham.) can be found; habitat of the monarch butterfly, with patches of grasslands and shrublands (Giménez de Azcárate, Ramírez, & Pinto, 2003). Based on España-Boquera, Champo-Jiménez, and Uribe-Salas (2019), four land cover types were considered in the present study: pine, oyamel, shrub grassland, and crops (Figure 1).
Climate variables
Mean temperature (°C) and precipitation (m3∙m-2) values for the study area, corresponding to the period 2000-2019, were downloaded from the NASA Giovanni page (https://giovanni.gsfc.nasa.gov/giovanni). Data are monthly with 0.25° of spatial resolution (considering that 360° equals to 40 075 km and corresponds to a spatial resolution of 27.83 km2 at the equator). To cover the study area, four pixels were downloaded and the average of the four data was calculated for each variable. The average of temperature was calculated for each year of the series, as well as the average of each month in the period; the annual total was calculated for the precipitation. The frequency of the data provided a monthly, seasonal and interannual scale for analysis.
LAI time series
GEOV1 series of LAI for the period 2000-2019, developed from SPOT/VGT date within the Copernicus project of the Global Monitoring for Environment and Security (GMES) program of the European Union, with 0.05° spatial resolution (1 km at the Equator) and 10-day steps, were downloaded and analyzed (Baret et al., 2013). The study area was cropped and the mask corresponding to the MBBR was applied
Phenological variables
From the LAI series, using the TIMESAT algorithm (with Savitsky-Golay adaptive filter, 20 % window size, one season per year and two iterations; Jönsson & Eklundh, 2004), 11 phenological variables describing the annual phenology of the vegetation were determined per pixel and year: beginning, middle, end and season length, maximum and minimum LAI, LAI amplitude, left and right derivatives (growth rate and decay rates), extended and short integral (total and annual cumulative LAI). The spatial average of each phenological variable was determined for the total MBBR and for each land cover type (oyamel, pine, shrubs, and crops) in each year.
Greening
Greening was spatially detected by the cumulative increase of the extended integral, calculated as the sum of the differences between the extended integral of each year and the interannual average of the pixel land cover type. Positive or negative pixels correspond respectively to areas in which the total cumulative leaf area in the period has been greater or less than the average of the land cover. In the same way, the cumulative increase of the short integral was calculated by summing the differences between the short integral of each year and the interannual average of the pixel land cover type. Positive or negative pixels correspond to areas in which the increase in leaf area for each year has been greater or less than the average for their cover type.
Results and Discussion
Climate
The mean annual temperature and annual accumulated precipitation in the period 2000-2019 are shown in Figure 2. The mean temperature increased 0.87 °C in the 20 years studied (0.04 °C on average each year, R2 = 0.20), a value close to that calculated by the GMST (Global Mean Surface Temperature) of up to 0.89 °C during 1901-2012 (IPCC AR5, 2013). The year 2010 was the coldest, while 2014 and 2015 were the warmest. Meanwhile, accumulated precipitation remained stable.
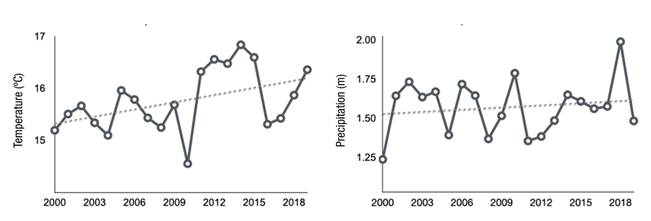
Figure 2 Mean annual temperature and annual accumulated precipitation in the Monarch Butterfly Biosphere Reserve during the period 2000-2019. Dotted lines indicate the trend generated from Giovanni data (NASA).
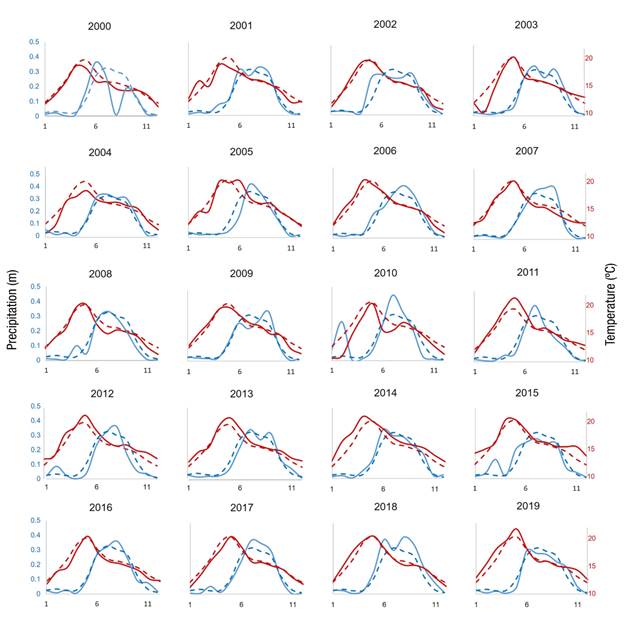
Figure 3 shows the average temperature and precipitation for each month in each year. In summary, in 2000, the spring was rainier and cooler, while the summer was drier and cooler. In 2001, late winter was warm, spring was cold and rainy, summer started rainy, and winter started cold. In 2002, spring was warm and rainy, summer was less rainy, and winter was cold and rainy. In 2003, winter was cold, as was early spring; summer was rainy with a period of haze; and autumn was warm and rainy. In 2004, winter, spring and early summer were cold, October was rainy and November was dry. In 2005, spring started cold, but ended warm; summer was warm, started dry and then was rainy; and autumn started warm. In 2006, the winter ended warm and the spring was warm; the fall was rainy and the winter was cold. In 2007, the fall started rainy and was cold. In 2008, early spring was rainy, summer was cool and ended dry. In 2009, winter ended warm; summer was warm and dry, but ended rainy; autumn was cool and started rainy, then was dry. In 2010, winter was very cold and rainy; spring started cold and May was warm; summer started cold and very rainy, but ended warm; and autumn was dry. In 2011, spring and summer were warm; autumn was dry and cold; and winter was warm. 2012 was warm with rainy winter and dry spring and fall. 2013 was warm with dry winter and spring and rainy autumn. 2014 was warm with rainy spring, summer and autumn. 2015 was warm with rainy late winter and early spring and dry summer and fall. 2016 was a cool year; summer ended rainy, fall was dry and winter started rainy. In 2017, winter ended rainy and cold, spring was warm and dry, summer was cold and late rainy, and fall was dry. In 2018, late winter and early spring were warm, late spring and early summer and autumn were rainy. In 2019, winter and spring were warm, summer was rainy, autumn was rainy and warm, and winter was warm and dry.
Phenological variables
The average annual value of each phenological variable in the MBBR (2000-2019) and the associated regression line are shown in Figure 4. The results indicate that the beginning (R2 = -0.85), middle (R2 = -0.92) and end (R2 = -0. 94) of season have gradually occurred earlier; minimum (R2 = 0.89) and maximum (R2 = 0.55) LAI have been increasing, as well as total cumulative leaf area (R2 = 0.59) and season length (R2 = 0.24).
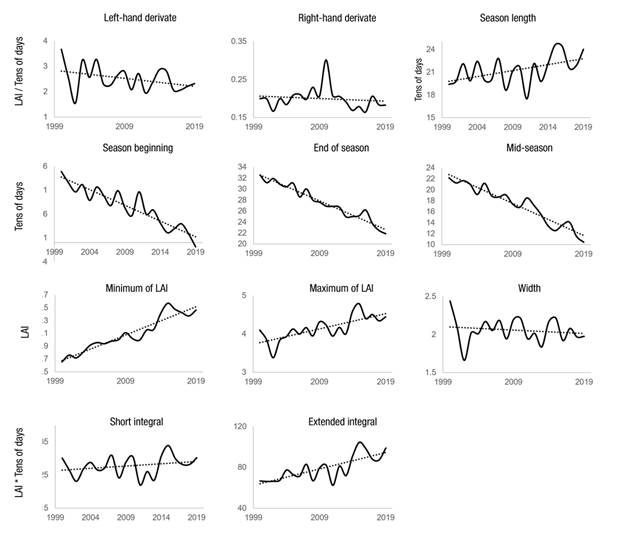
Figure 4 Annual average of each phenological variable in the Monarch Butterfly Biosphere Reserve in the period 2000-2019. LAI: leaf area index.
Figure 5 shows the average annual value of each phenological variable in each land cover of the MBBR. In all variables, the crops had a more differentiated temporal behavior with faster start and decay of the growing season and shorter season than in the other coverages, with oyamel having greater interannual variability.
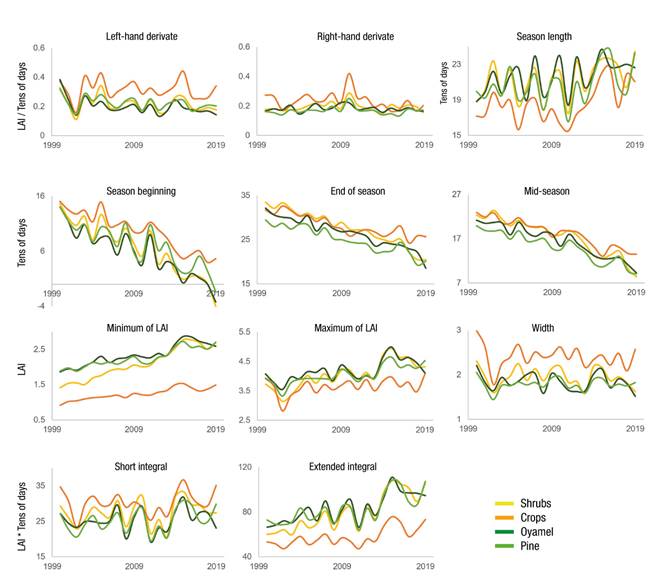
Figure 5 Average of each phenological variable per land cover of the Monarch Butterfly Biosphere Reserve in the period 2000-2019. LAI: Leaf area index.
The beginning, end and middle of the growing season are increasingly earlier in the order of ten tens of days from the beginning to the end of the studied period: the beginning of season moves from May (15th ten) to the beginning of the year, while the end of season moves from November (33rd ten) to August (23rd ten) and the mid-season moves from August (23rd ten) to April (13th ten). Although crops follow the tendency to move forward, they show greater interannual stability than natural cover types, as planting and harvesting dates are largely independent of the weather and dependent on human will. The minimum LAI is very low in crops, which is explained by the prevalence of annual rainfed crops. On the other hand, shrubs begin the period studied with a lower minimum LAI than forests, but end at the same level, which could correspond to an increase in their biomass due to the presence of leafier species and the emission of leaf buds in spring. The maximum LAI of the crops was lower than in the other land covers; however, it had a greater amplitude.
For natural land covers, the remaining vegetation (difference between extended and short integral) is the major element and has more weight in the total LAI throughout the year, but not in the case of crops, for which the annual growth is more relevant. Longer growing seasons with higher LAI result in more cumulative LAI (correlation between extended integral and season length with R2 = 0.77, and with maximum LAI, R2 = 0.73). The presence of evergreen plants or species that can take advantage of the occasionally warm autumn temperatures to continue their vegetative development may also contribute to higher cumulative LAI (Buitenwerf et al., 2018).
Climate-phenology relationship
The beginning of the vegetative season was very slow (very small left derivative) and early (small season beginning) in 2002 for all land covers, as well as in 2010 and 2012 for shrubs and oyamel; this may be associated with a very rainy spring (May) in 2002 and heavy winter rains in 2010 and 2012. It can be interpreted that, when temperatures rose, the presence of moisture in spring resulted in an early and slow regrowth of vegetation, maybe due to the differentiated reaction of the species. The growing season was long in those years and the maximum LAI was very low in 2002 for crops and shrubs.
In 2003, 2005, 2011 and 2013, the beginning of the growing season was very fast (very large left derivative), but late (large season on beginning set), for shrubs and crops. Spring was dry in 2003 and 2005, as rains were delayed until June and July, respectively; 2003 was cold in February and March, 2005 in March, and in 2011 and 2013 May was very warm and dry, which delayed the relatively short growing season. However, the season was long for oyamel in 2005 with a late end of season, perhaps because despite being a dry year, the highest and coolest parts of the MBBR remained moist as reported by España-Boquera et al. (2019), which is consistent with the relatively higher value of the minimum LAI of this land cover. In 2011 and 2013, the minimum and maximum LAI were relatively low for the entire reserve, as well as the cumulative LAI of annual growth, considering the remaining vegetation, which may also be associated with the short rainy season and hot summer.
In 2007, rainfall was abundant in September and, although temperatures in this month were somewhat low, the growing season was long, the LAI was relatively large (particularly for oyamel), and annual and cumulative growth was significant. A similar behavior was observed in 2009, when rainfall was low in July and August, but increased in September. In 2008, the winter was dry and, although it rained in early spring, May was dry, so the start of the vegetative growing season was late and fast; the summer was cool and the end of the rains came early, which made the season short, and the maximum LAI and its amplitude, as well as annual and cumulative growth were relatively small.
In 2010, abundant winter rains were accompanied by low temperatures, but the remaining moisture was able to bring forward the beginning of the growing season. The summer was particularly wet and cold, and the rains ended prematurely leading to a very dry autumn, bringing the growing season to an abrupt end for crops, shrubs, and pines. That year's total and cumulative LAI were relatively large for shrubs and oyamel, respectively.
In 2014, the winter was warm and the summer started very rainy so the beginning of the season was fast and early; the minimum and maximum LAI were relatively large, as well as the amplitude (particularly in shrubs) and integrals. In 2015, the beginning of the growing season was very fast (except for oyamel) and early; this can be understood by the heavy rain in March after a warm winter. Winter rains caused a high LAI minimum, as vegetation of the lower strata was maintained all year; also the maximum LAI was high in 2015, especially for shrubs and oyamel, as well as the cumulative LAI of annual growth, considering the remaining vegetation. In 2016, the end of season was late for crops and pines compared to previous years and the season was very long, which can be explained by cool temperatures in spring; the minimum LAI was high for oyamel and shrubs. In 2017, greening was late and slow for pine and crops; it rained in winter and summer rains were late, but abundant, while autumn was dry, causing the end of season to come quickly.
In 2018, the winter was warm and the summer started with abundant rainfall that lasted into the fall; the beginning of the season was early and slow, the season was long for crops and oyamel, the minimum and maximum LAI were high, although a little lower than in the immediate previous years, as well as the amplitude and integrals. In 2019, the season onset was much earlier, particularly for shrubs and oyamel, which may be due to the very warm winter and spring temperature that, although it was accompanied by a delay in rainfall, it is possible that in the elevated areas there was sufficient moisture. These circumstances are consistent with a later and quicker beginning of the season for crops. The growing season was very long for pines and shrubs.
To some extent, it is possible to interpret the behavior of some phenological variables from climate behavior; however, the effect of increased atmospheric CO2 on particular phenophases (García-Mozo et al., 2006) and other factors associated with climate change must also be considered. On a global scale, the increase in LAI in the northern hemisphere appears to be driven mainly by the increase in atmospheric CO2 concentration (accounting for 49 %), while interannual variations in LAI are controlled by temperature change (Piao, Friedlingstein, Ciais, Zhou, & Chen, 2006).
Other aspects related to plant phenology that are necessary for the growing season to begin must be included, such as the necessary cumulative heat (degree-days) and the winter cooling or the photoperiod; in addition, physiological sensitivity to climate is changeable during plant development, such as resistance to water stress (Bruce, Tyler, Shelly, & Mata, 2009; Seyednasrollah, Swensonb, Domec, & Clark, 2018).
Greening
Figure 6 shows the map of the annual (A) and total (B) increase of the LAI of each pixel in relation to the average of the corresponding land cover in the studied period. Pixels with higher than expected leaf area increase between 2000 and 2019 are shown in green and pixels with lower than expected increase are shown in pink; darker shades (green or pink) indicate larger differences (positive or negative) in relation to the interannual average.
In the MBBR, 12.82 % showed no significant changes compared to the average of previous years (cumulative increase or decrease of less than 100 LAI points, which means 5 m2 of leaf area∙m-2 of soil∙year-1); 53.21 % recorded greening and 33.97 % showed some degree of browning. In Mexico, it is estimated that 28.4 % of the plant area shows greening, while 2.4 % shows browning (Chen et al., 2019). In Europe, LAI increased in 84 % of pixels with semi-original vegetation, the absolute increase in LAI being higher in vegetation types with abundant biomass (forests), while, in relative terms, the increase was higher for woody vegetation types with intermediate biomass (Buitenwerf et al., 2018).
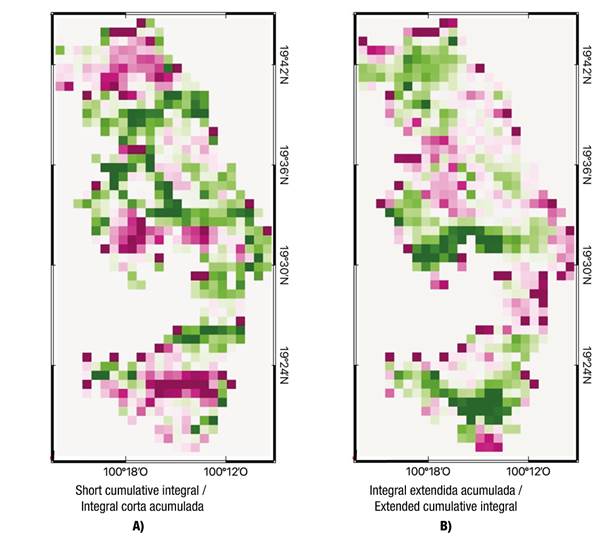
Figure 6 Map of the spatial distribution of the cumulative annual (A) and total (B) increase in leaf area index (LAI) of each pixel, relative to the average of the corresponding cover over the period 2000-2019. In green, pixels that consistently had leaf area increases greater than the average of their cover; in pink, pixels with increases less than the average of their cover; darker shades (green or pink) indicate larger absolute values of differences.
Figure 7 shows the percentage of area with greening and browning in each land cover. For pine forest, 7 % of the area showed no significant changes, 37 % recorded browning (in 18 % it is lower than 300 LAI points, which corresponds to 15 m2∙m-2∙year-1), while 66 % shows greening (in 27 % it is lower than 300 LAI points). The greatest greening occurs in two pine areas; one in the center, which CONAFOR-UACh reported as infested by mistletoe and bark beetle and where SEMARNAT carried out a sanitation in 2009 (Champo-Jiménez, Valderrama-Landeros, & España-Boquera, 2012), and another to the south, in Cerro Pelón. These are south-facing areas where, on average, the growing season is very long, the minimum and maximum LAI are very high, the short integral is low, and the extended one is very high (España-Boquera et al., 2019). However, in this zone, the cumulative annual growth in the period is lower than the average for pine, so the presence of important remnant vegetation is evident; for example, deciduous oak species (an important component in mixed pine-oak forests) have been reported for the reserve (Romero-Rangel et al., 2014) that lose their foliage in the non-rainy season. In Europe, the strongest increases in LAI have been observed in moderate climates in partially forested vegetation types and consist of more vigorous woody growth after the cessation of intensive management; greening in forests may also be due to the growth of increasingly taller trees that support a denser canopy and thus increase LAI (Buitenwerf et al., 2018).
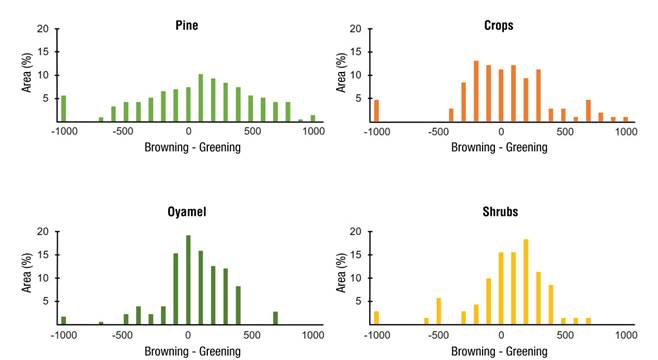
Figure 7 Distribution of greening and browning levels in each land cover. On the horizontal axis, leaf area index (LAI) levels in relation to the average of the corresponding land cover for the period 2000-2019. One LAI level corresponds to 0.5 m2 of leaf area per m2 of soil; a variation of 100 levels means 5 m2∙m-2∙year-1. The vertical axis shows the percentage of surface area (pixels).
From the area under cultivation, 11 % shows no significant change in cumulative LAI, 41 % shows browning (23 % below 300 LAI points) and 48 % greening (32 % below 300); i.e., there is almost as much crop area with browning, generally moderate, as with greening that becomes significant in some areas. Globally, it is estimated that agriculture contributes one third to the increase in the amount of vegetation, which would be a secondary effect of agricultural practices (Chen et al., 2019; Gao et al., 2019). Greening could be the result of changes in average leaf size, number of leaves per plant, plant density, species composition, duration of green leaf presence due to changes in the growing season or introduction of multiple crops (Chen et al., 2019).
On the other hand, for shrubs, 15 % of the area was unchanged, 27 % showed browning (17 % below 300 LAI points) and 58 % greening (44 % below 300); that is, half of the area had moderate greening, with some areas of browning.
Oyamel is the cover with the highest percentage of unchanged surface (19 %); more than half (51 %) shows moderate greening (41 % less than 300 LAI points), while 30 % shows browning (21 % less than 300). A zone is observed in the extreme north, where greening is important; this is the best preserved area of the MBBR (Champo-Jiménez et al., 2012) of northwest orientation, where the beginning, middle and end of season are early and slow, the growing season is long, the minimum LAI is high and the maximum is moderate, the amplitude and short integral are small and the extended integral is large (España-Boquera et al., 2019). In this zone, the cumulative annual growth over the period is lower than the average for oyamel (negative value of the cumulative short integral), possibly due to the presence of associated vegetation.
The highest zone of the MBBR (climate is cooler and wetter year-round), where oyamel and shrubs predominate, showed stable values (close to the interannual average) of both cumulative extended and short integrals. This agrees with Buitenwerf et al. (2018), who report that the smallest LAI increases occur in cooler areas across all vegetation types, whereas, in many vegetation types, LAI increases are higher in zones with average temperatures and intermediate soil moisture than in warmer areas, whether dry or very wet. Soil moisture is partially regulated by evapotranspiration, which in turn is partially regulated by temperature, a variable that not only affects plant functioning through water relations, but also physiological (photosynthesis and phenology) and behavioral (leaf expansion) processes (Buitenwerf et al., 2018; Montgomery et al., 2020).
Conclusions
Mean temperature increased 0.87 °C in the period 2000-2019, while precipitation remained relatively stable. The beginning, middle, and end of growing season have occurred earlier, particularly in years with rainy winters or springs; minimum and maximum leaf area index have increased, as well as total cumulative leaf area, which is associated with rainy years in late summer, resulting in longer growing seasons. Dry and warm springs delay the onset of the season, except in oyamel, due to the higher humidity of the elevated areas where it is found. Greening was recorded in 53.21 % of the land cover and 33.97 % showed some degree of browning; in oyamel, 19 % remained unchanged, 30 % with browning and 51 % with greening. The study of biophysical climate feedbacks will help to develop more integrated and effective climate mitigation and adaptation strategies.

