


 texto en
  Inglés (pdf)
 Artículo en XML
 Referencias del artículo
 Enviar artículo por email
 Citado por SciELO
  Similares en
SciELO
Similares en
SciELO 
 Permalink
Introduction
The coffee tree (Coffea spp.) is an evergreen shrub that can guarantee a constant supply of leaves throughout the year. This non-timber resource can be used as it represents a non-commercial part of the plant to which different medicinal properties are attributed (Chen, 2019). Coffee leaves have been consumed since ancient times, mainly as infusion, to treat various health conditions (Rosales-Villarreal et al., 2019), for example respiratory infections (Tabuti, Kukunda, & Waako, 2010), stomach problems (Belayneh & Bussa, 2014), obesity, body ache, headache, cough, fever, and hair loss (Heredia-Díaz et al., 2018).
These therapeutic effects could be influenced by the phytochemical composition of the foliar matrix, which contains phenolic compounds such as phenolic acids (ferulic, synaptic, caffeic, chlorogenic, and p-coumaric acids) and flavonoids (kaempferol, rutin, quercetin, and isoquercitrin) (Patay, Benczik, & Papp, 2016). It has been reported that 5-O-caffeoylquinic and feruloylquinic acids are also present in the leaves of Coffea canephora Pierre ex A. Froehner along with other components, including xanthone mangiferin (Campa et al., 2012), lipids (Delaroza, Rakocevic, Malta, Bruns, & Scarminio, 2014), alkaloids (Zheng & Ashihara, 2004), and carbohydrates (Brum, Melo, Barquero, Alves, & Chalfun-Júnior, 2013). Many of these biological active metabolites can be obtained by conventional infusions; however, the implementation of clean extraction techniques may allow greater yields of phytochemicals, mainly phenolic compounds, that can supply of prophylactic ingredients and broaden our knowledge on the composition of plant materials. Particularly, there is an enhanced process of extraction for the recovery of these plant metabolites, i.e., UAE (ultrasound assisted extraction), which is an emerging technology that accelerates heat and mass transfer and has been proposed for bioactives extraction of coffee leaves (Chen, Ding, Ji, He, & Ma, 2020). Hence, these transfer mechanisms along cavitation effects facilitate the release of extractable components, such as bioactive phenolics, and their mass diffusion by breaking down the cell walls of the plant (Chemat et al., 2017). The UAE process improves the quality and novelty of obtained extracts compared to traditional methods such as infusion (Chemat et al., 2017).
Therefore, the aim of the present study was to determine the complete and updated chemical profile of phenolic bioactives such as flavonoids, methylxanthines and phenolic acids, as well as the in vitro antioxidant response and oxidative stress of extracts derived from Coffea leaves, using ultrasound-assisted extraction.
Materials and methods
Reagent and biological materials
Air-dried Coffea arabica L. leaves cv. Catimor 5000 were obtained from the Instituto Nacional de Investigaciones Forestales Agrícolas y Pecuarias (INIFAP) at Xalapa, Veracruz, México. All reagents used were from Sigma-Aldrich (Estado de México, México). Colon adenocarcinoma cells (HT-29) were from American Type Culture Collection (ATCC® HTB-38™, CDMX, Mexico).
Preparation of extracts
Coffea leaves infusions were prepared adding 1 g of ground material to 100 mL of 80 °C distilled water and allowed to stand for 10 min. Infusions were lyophilized and kept protected from light and humidity until analysis.
Plant material was subjected to UAE at constant temperature (<35 °C), using a 13 mm probe (Sonifer® SFX250, BRANSON®) with depth of 2.5 cm, solvent volume of 200 mL, solvent-to-solid ratio (10:1.5), frequency of 20 KHz, power of 250 W and intermittent pulses of 5 s ON / 5 s OFF (Hossain et al., 2012). The variable factors were extraction time (3, 6 and 9 min), wave amplitude percentage (20, 30 and 40 %) and water/methanol solvent ratio (100/0, 60/40 and 20/80 v/v).
Total phenolic content
In 96-well microplates, 25 μL of extract samples at 0.1 mg∙mL-1 were placed in triplicate, then 80 μL of distilled water and 5 μL of Folin-Ciocalteu reagent 2 N were added. The plate was capped and stirred for 5 min, then 80 μL of Na2CO3 7 % was added to each well. Samples in plate were let to stand for 30 min and their absorbance read (ELISA SYNERGY HT, Microplate Reader BioTek; Winooski, VT, USA) at 765 nm. Results were expressed as mg chlorogenic acid equivalents per mg extract.
Flavonoid content
In a 96-well transparent microplate, 20 μL of extract at 0.1 mg∙mL-1 were placed, and then 7.5 μL of 5 % NaNO2, 15 μL of 10 % AlCl3, 50 μL of 1 M NaOH and 157 μL of distilled water were added to each well. Subsequently, the plate was shaken for 1 min and allowed to stand in the dark for 5 min. Afterwards, the absorbance was read at 570 nm as stated above. Results were expressed as mg catechin equivalents per mg extract.
Identification of phenolic compounds by UPLC-ESI-QqQ-MS/MS
The extracts were prepared at 10 mg∙mL-1 dissolved in UPLC grade methanol. An ultra-high-resolution liquid chromatograph Acquity UPLC® (Waters, Milford, MA, USA) coupled to a mass spectrometer (UPLC/MS) was used with a negative electrospray ionization module (ESI-). A reversed phase ZORBAX RRHD Eclipse XDB-C18 column (2.1 x 150 mm, 1.8 μm) (Agilent, Santa Clara, CA, USA) was used and maintained at 30 °C. Mobile phases, 7.5 mM formic acid in deionized water (Phase A) and acetonitrile (Phase B) were used at 0.21 mL∙min-1 and 20 min total run time. Binary gradient program was: 0 min, 97 % A; 1.88 min, 91 % A; 5.66 min, 84 % A; 16.9 min, 50 % A; 19.62 to 20 min, 97 % A (Díaz-Rivas et al., 2018).
The mass spectrometer was set at 150 °C, a solvation temp 450 °C, cone gas flow 151 L∙h-1 and N2 flow 796 L∙h-1. Methanol was used as co-solvent with 0.1 % of formic acid. Multiple reactions ionization mode was used for MS/MS assays at capillary voltage 2.5 kV, desolvation temp 400 °C, source temp 150 °C, desolvation gas flow 800 L∙h-1 and cone gas flow 150 L∙h-1; the collision gas flow was 0.13 mL∙min-1, the MS mode collision energy, 5.0 and the MS/MS mode collision energy, 20.0. The injection volume was 1 µL. The abundance of phenolic acids and flavonoids was calculated by calibration curves of various standards and expressed in µg∙g-1.
Identification of methylxanthines by UPLC-ESI-QqQ-MS/MS
An ACQUITY HPLC ® coupled to mass (UPLC/MS-MS) spectrometer was used in positive electrospray ionization module (ESI+) and a triple quadrupole detector. An ACQUITY UPLC® HSS T3 1.8 μm column was used at 40 °C, samples kept at 6 °C, and injection volume at 1 μL. The extracts were prepared at 10 mg∙mL-1 dissolved in UPLC grade methanol. A binary mobile phase was used with solvents A (0.1 % formic acid in water) and B (0.1 % formic acid in methanol) at 0.3 mL∙min-1 and 12 min of total run time. Elution gradient was: 0 min, 99 % A; 1.5 min, 95 % A; 3 min, 80 % A; 5.5 min, 45 % A; 5.8 min, 2 % A; 7.6 to 12 min, 99 % A. MS parameters: source temp, 150 °C; solvation temp, 450 °C; cone voltage, 30 V; cone gas flow, 150 L∙h-1; and N2 flow, 800 L∙h-1. Fragmentation patterns for 1,3,7-trimethylxanthine (caffeine), 1,3-dimethylxanthine (theophylline) and 3,7-dimethylxanthine (theobromine) were evaluated as Huck, Guggenbichler, and Bonn (2005). The abundance calculations were carried out through curves identifying peaks and reported in mg∙g-1.
Antioxidant activity by the absorbance capacity of oxygen radicals (ORAC)
In a 96-well dark microplate, 20 μL of extract prepared at 0.01 mg∙mL-1 in phosphate buffered saline pH 7.4 (PBS) and 200 μL of fluorescein at 1.09 µM were added and allowed to incubate for 15 min at 37 °C. After incubation, a first reading was taken, then 75 μL of 2,2-azobis (2-methylpropionamidine) dihydrochloride (AAPH) were added to each well, and the plate was read at intervals of 210 s during 120 min at 485 nm for excitation and 580 nm for emission wavelengths. The area under the curve was acquired by SigmaPlot® ver 12.0 software and analyzed (Systat Software Inc., 2014). PBS was used as a blank and results were expressed in μM Trolox equivalents per mg extract.
Antioxidant capacity determined by the Nitric Oxide Assay
Scavenging activity of NO was determined using sodium nitroprusside (SNP) as the NO donor. In test tubes, 1 000 μL of extract/solvent at 0.1 mg∙mL-1 were mixed with 200 μL of 113 mM SNP and mixture incubated for 2 h. Subsequently, 100 μL of each mixture were transferred to wells of a 96-well transparent microplate and mixed with 100 μL of modified Griess reagent (Sigma-Aldrich). The plate was stirred for 15 min at 25 °C and absorbance read at 546 nm, reporting the inhibition percentage.
Antioxidant activity by the scavenging capacity of the radical ABTS
In 96-well transparent microplates, 10 μL of extract in saline phosphate buffer (pH 7.4, 0.75 M) were mixed with 190 μL ABTS (2,2'-azino-bis [3-ethylbenzothiazoline-6-sulfonic acid] radical) prepared 16 h prior to test. The plate was stirred, allowed to stand for 10 min and absorbance read at 750 nm. Results were expressed as mg of Trolox equivalents per mg of extract.
Ferric reducing antioxidant power (FRAP) assay
The radical was prepared by mixing 400 mM acetate buffer, 30 mM 2,4,6-tripyridyl-s-triazine (TPTZ) and 60 mM ferric chloride hexahydrate at 1:1:10 (v/v/v). In a 96-well transparent microplate, 10 μL of extract at 0.1 mg∙mL-1 and 190 μL of reagent mixture were mixed, stirred, and left to stand for 20 min in darkness. The absorbance was read at 593 nm. Results were expressed as mM Trolox equivalent per mg of extract.
Cell culture experiments
Cell culture
Human colon adenocarcinoma cell line HT-29 was grown in RPMI-1640 medium with 10 % fetal bovine serum (FBS) and 1 % penicillin-streptomycin in 100 mm Petri plates and incubated at 37 °C and 5 % CO2 humidified atmosphere. The medium was changed every other day.
Cytotoxicity assay
The cytotoxicity of infusion and Coffea leaves extracts on HT-29 cells was evaluated by the trypan blue staining method. Cells were seeded into 24-well plates at 30 000 cells per well in 0.5 mL RPMI 1640 medium with 10 % FBS and antibiotics. The HT-29 cells were treated by samples at 5, 10, 30, 100, 200, 500, 1 000, 10 000 and 15 000 ng∙mL-1 for 24 h. Later, they were washed with PBS, added with 0.015 % trypsin dissolved in EDTA and incubated 10 min. Trypsin was neutralized with 0.35 mL RPMI with FBS. Live cells were counted in in a Neubauer camera by the trypan blue staining method and result expressed as the mean inhibitory concentration (IC50) in µg∙mL-1.
Measurement of reactive oxygen species induced by H2O2
Cells were seeded into 96-well dark plates at 9 600 cells per well in 0.2 mL RPMI with 10 % SFB and as antibiotics, streptomycin sulfate (0.6 mg∙mL-1) and penicillin (1 mg∙mL-1), incubated for 72 h at 37 °C and 5 % CO2. Cells were incubated with 200 µL of extracts at 50 ng∙mL-1 for 4 h. Later, cells were loaded with dichlorofluorescein-diacetate (10 mM) and incubated for 15 min at 37 °C, then washed with PBS and exposed to H2O2 (100 mM) for 1 h. Fluorescence was then measured at 37 °C at 485/530 nm excitation/emission wavelengths, respectively.
Statistical analysis
To reduce number of experimental runs, energy, and materials involved, an experimental design based on D-optimal criterium was used with ten different combinations, comprising all experimental variables as shown in Table 1. Results were expressed as the mean ± standard deviation. Data were analyzed by one-way ANOVA and differences among treatments were determined by comparison of means by Fisher tests with a statistical significance of P < 0.05 using the statistical program Minitab version 7 (Minitab Inc., 2009). The principal components analysis (PCA) was performed in the XLSTAT program.
Table 1 Experimental conditions for the D-optimal design in the ultrasound-assisted extraction of Coffea leaves.
| Extract sample | Extraction condition | Ratio of water/methanol (%) | Extraction time (min) | Amplitude (%) |
|---|---|---|---|---|
| 1 | 20/03/2020 | 20/80 | 3 | 20 |
| 2 | 100-3-20 | 100/0 | 3 | 20 |
| 3 | 100-9-20 | 100/0 | 9 | 20 |
| 4 | 40-3-30 | 60/40 | 3 | 30 |
| 5 | 100-6-30 | 100/0 | 6 | 30 |
| 6 | 20/09/1930 | 20/80 | 9 | 30 |
| 7 | 20/03/1940 | 20/80 | 3 | 40 |
| 8 | 100-3-40 | 100/0 | 3 | 40 |
| 9 | 60-6-40 | 60/40 | 6 | 40 |
| 10 | 100-9-40 | 100/0 | 9 | 40 |
Results and discussion
Phytochemical identification
The extractions of Coffea leaves were carried out by ultrasound assistance and infusions (conventionally). The content of total phenols and flavonoids in extractions is shown in Figure 1, which shows that the infusion had the highest concentration of total phenolic compounds. Flavonoids accounted for approximately 20 to 40 % of the total phenolic content. This determination is influenced by the ability of the Folin-Ciocalteu reagent to interact with the reducing compounds in the sample; therefore, liquid chromatography coupled to mass spectrometry (LC-MS) was used for more precise identification.
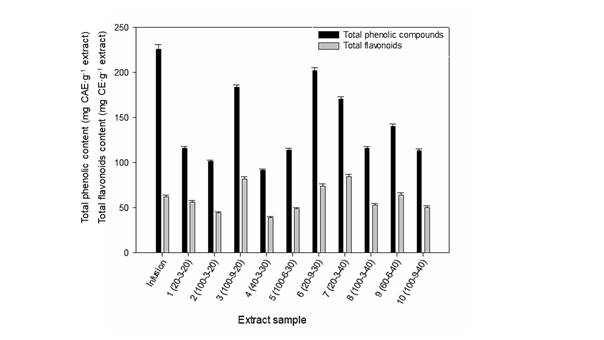
Figure 1 Total phenolic and flavonoids contents in infusion and extracts of Coffea leaves. Infusion: 1 g of ground material into 100 mL of distilled water at 80 °C and left for 10 min. Extraction conditions: Ratio of water/methanol (%) - Extraction time (min) - Amplitude (%). CAE: chlorogenic acid equivalents; CE: catechin equivalents. Different letters mean significant differences (Fisher P = 0.05).
Phenolic acids, flavonoids and xanthone mangiferin were identified (Table 2). Aqueous extracts 2, 3, 5, 8, 10 and the infusion showed lower contents of specific flavonoid compounds (<197.0 µg∙g-1), particularly flavanols such as catechin, procyanidin and mangiferin, when compared to the hydroalcoholic extracts 1, 4, 6, 7 and 9 (>274.0 µg∙g-1); however, mangiferin in extracts was twice as much (>54.0 µg∙g-1) as that found in infusions (25.8 ± 0.12 µg∙g-1). In contrast, higher concentrations of phenolic acids (735.6 to 899.7 µg∙g-1) were found in all extracts obtained with ultrasound assistance compared with the infusion (597.2 µg∙g-1) (Table 3). No significant differences were observed between aqueous extracts and the water/methanol mixtures. The group of hydroxycinnamic acids was the predominant, with quinic, 3-4/4-5 dicaffeoylquinic and chlorogenic acids as the major compounds identified in both infusion and extracts.
Table 2 Flavonoid compounds identified in extracts of Coffea leaves obtained by ultrasound assistance under different conditions.
| Compound (µg∙g-1 extract*) | Infusion | Extract 1 20-3-20 | Extract 2 100-3-20 | Extract 3 100-9-20 | Extract 4 60-3-30 | Extract 5 100-6-30 | Extract 6 20-9-30 | Extract 7 20-3-40 | Extract 8 100-3-40 | Extract 9 60-6-40 | Extract 10 100-9-40 |
|---|---|---|---|---|---|---|---|---|---|---|---|
| Flavanones | |||||||||||
| Naringenin | traces | 10.39 ± 4.2 ab | traces | traces | 6.49 ± 2.6 bc | traces | 8.38 ± 3.4 ab | 10.0 ± 4.0 ab | traces | 17.52 ± 7.1 a | 6.10 ± 2.5 b |
| Neohesperidin | traces | 0.14 ± 0.0 a | 0.19 ± 0.1 a | 0.26 ± 0.1 a | 0. 13 ± 0.0 a | 0.25 ± 0.1 a | 0.18 ± 0.1 a | 0.15 ± 0.1 a | 0.18 ± 0.1 a | 0.16 ± 0.1 a | 0.13 ± 0.0 a |
| Flavanols | |||||||||||
| Catechin | 3.02 ± 0.12 a | 3.14 ± 0.8 a | 1.19 ± 0.3 cd | 0.28 ± 0.1d | 2.42 ± 0.6 abc | 1.21 ± 0.3 bcd | 2.92 ± 0.7 a | 2.27 ± 0.6 abc | 0.57 ± 0.1 d | 2.64 ± 0.7 ab | 0.41 ± 0.1 d |
| Epicatechin | 10.6 ± 0.52 b | 35.37 ± 6.2 a | 13.82 ± 2.4 b | 11.16 ± 1.9 b | 29.71 ± 5.2 a | 9.29 ± 1.6 b | 32.19 ± 5.6 a | 33.20 ± 5.8 a | 13.14 ± 2.3 b | 28.22 ± 4.9 a | 8.08 ± 1.4 b |
| Procyanidin B1 | 13.94 ± 2.13 e | 1.99 ± 0.4 ab | 0.67 ± 0.1 a | 0.96 ± 0.2 d | 1.32 ± 0.3 bcd | 0.77 ± 0.2 d | 2.42 ± 0.5 a | 2.41± 0.5 a | 0.72 ± 0.1 d | 1.71 ± 0.3 abc | 0.57 ± 0.1 d |
| Procyanidin B2 | 14.03 ± 2.15 bc | 47.64 ± 15.5 a | 17.70 ± 5.8 abc | 16.51 ± 5.4 abc | 39.07 ± 12.8 b | 12.94 ± 4.2 c | 40.35 ± 3.2 abc | 41.02 ± 13.4 abc | 16.91 ± 5.5 bc | 43.80 ± 14.3 ab | 13.66 ± 4.5 bc |
| Flavonols | |||||||||||
| Quercetin | 0.18 ± 0.06 c | 0.19 ± 0.0 c | 0.10 ± 0.0 c | 0.12 ± 0.0 c | 1.19 ± 0.2 ab | 0.10 ± 0.0 c | 0.43 ± 0.1 c | 0.27 ± 0.0 c | 0.11 ± 0.0 c | 2.34 ± 0.4 a | 0.16 ± 0.0 c |
| Quercetin 3-O-glucoside | 11.98 ± 0.14 d | 30.88 ± 3.9 abc | 23.68 ± 3.0 c | 28.74 ± 3.6 c | 36.18 ± 4.5 ab | 30.74 ± 3.8 abc | 36.16 ± 4.5 ab | 31.76 ± 4.0 abc | 25.71 ± 3.2 bc | 40.67 ± 5.1 a | 31.07 ± 3.9 abc |
| Rutin | 21.76 ± 0.17 c | 63.52 ± 9.5 b | 66.66 ± 10 ab | 74.14 ± 11.1 ab | 87.05 ± 13 a | 82.99 ± 12.4 ab | 78.53 ± 11.7 ab | 71.68 ± 10.7 ab | 70.56 ± 10.5 ab | 97.47 ± 14.6 a | 79.00 ± 11.8 ab |
| Kaempferol 3-O-glucoside | 0.84 ± 0.04 | nd | nd | nd | nd | nd | nd | nd | nd | nd | nd |
| Xanthones | |||||||||||
| Mangiferin | 25.8 ± 0.12 c | 82.66 ± 3.7 a | 53.45 ± 2.4 b | 56.25 ± 2.5 b | 78.25 ± 3.5 a | 58.56 ± 2.6 b | 84.06 ± 3.7 a | 81.71 ± 3.6 a | 56.51 ± 2.5 b | 78.80 ± 3.5 a | 54.44 ± 2.4 b |
| Total | 97.04 c | 274.84 a | 177.45 b | 188.39 b | 281.79 a | 196.83 b | 285.61 a | 274.45 a | 184.45 b | 313.31 a | 193.61 b |
Infusion: 1 g of ground material to 100 mL of 80 °C distilled water and allowed to stand for 10 min. Extraction conditions: Ratio of water/methanol (%) - Extraction time (min) - Amplitude (%). Values in rows that show different letters are statistically different (Fisher, P = 0.05). nd: not detected (outside the detection limit of the equipment 0.0001 µg∙g-1 of extract). *Dry basis. Traces <0.001 µg∙g-1.
Table 3 Phenolic acids identified in extracts of Coffea leaves obtained by ultrasound assistance under different conditions.
| Compound (µg∙g-1 extract*) | Infusion | Extract 1 20-3-20 | Extract 2 100-3-20 | Extract 3 100-9-20 | Extract 4 60-3-30 | Extract 5 100-6-30 | Extract 6 20-9-30 | Extract 7 20-3-40 | Extract 8 100-3-40 | Extract 9 60-6-40 | Extract 10 100-9-40 |
|---|---|---|---|---|---|---|---|---|---|---|---|
| Hydroxybenzoic acids | |||||||||||
| Benzoic acid | 0.475 ± 0.04 f | 3.69 ± 0.15 bcd | 3.86 ± 0.15 bc | 3.02 ± 0.12 e | 3.52 ± 0.14 cd | 4.05 ± 0.16 ab | 3.89 ± 0.15 bc | 3.82 ± 0.15 bcd | 4.32 ± 0.17 a | 3.08 ± 0.12 e | 3.41 ± 0.13 de |
| 4-hydroxybenzoic /salicylic acid | 0.115 ± 0.00 b | 0.57 ± 0.08 a | 0.52 ± 0.08 a | 0.49 ± 0.07 a | 0.44 ± 0.06 a | 0.50 ± 0.07 a | 0.60 ± 0.09 a | 0.48 ± 0.07 a | 0.51 ± 0.07 a | 0.42 ± 0.06 a | 0.59 ± 0.09 a |
| 2,5 dihydroxybenzoic acid | 0.035 ± 0.00 c | 0.10 ± 0.01 ab | 0.08 ± 0.01 b | 0.06 ± 0.01 b | 0.07 ± 0.01 b | 0.09 ± 0.01 ab | 0.07 ± 0.01 b | 0.12 ± 0.02 a | 0.07 ± 0.01 b | 0.06 ± 0.01 b | 0.09 ± 0.01 ab |
| 2,4,6 trihydroxy-benzaldehyde acid | 0.085 ± 0.02 b | 0.03 ± 0.01 a | 0.03 ± 0.01 a | 0.03 ± 0.01 a | 0.02 ± 0.01 a | 0.02 ± 0.01 a | 0.02 ± 0.01 a | 0.03 ± 0.01 a | 0.03 ± 0.01 a | 0.03 ± 0.01 a | 0.02 ± 0.01 a |
| Protocatechuic acid | 0.05 ± 0.00 e | 1.82 ± 0.09 a | 1.64 ± 0.08 ab | 1.62 ± 0.08 abc | 1.20 ± 0.06 abc | 1.51 ± 0.08 bc | 1.81 ± 0.09 a | 1.82 ± 0.09 a | 1.65 ± 0.09 ab | 1.37 ± 0.07 cd | 1.57 ± 0.08 abc |
| Vanillic acid | 5.84 ± 1.56 f | 23.58 ± 1.56 cd | 26.67 ± 1.7 bc | 26.32 ± 1.74 bc | 18.15 ± 1.2 bc | 25.18 ± 1.66 c | 33.12 ± 2.19 a | 22.0 ± 1.45 cde | 22.89 ± 1.51 cde | 19.41 ± 1.28 de | 30.53 ± 2.01 ab |
| Gallic acid | 1.38 ± 0.13 e | 14.92 ± 3.51 a | 2.62 ± 0.62 d | 3.54 ± 0.83 bcd | 9.65 ± 2.27 bcd | 3.83 ± 0.90 bcd | 14.55 ± 3.42 a | 11.81 ± 2.78 a | 3.48 ± 0.82 cd | 9.13 ± 2.15 abc | 3.29 ± 0.77 cd |
| Shikimic acid | 5.74 ± 0.03 bcd | 5.13 ± 0.18 de | 5.49 ± 0.20 cde | 5.49 ± 0.20 cde | 5.84 ± 0.21 cde | 6.29 ± 0.23 ab | 5.71 ± 0.20 bcd | 5.20 ± 0.19 de | 5.48 ± 0.20 cde | 5.06 ± 0.18 e | 6.31 ± 0.23 a |
| Syringic acid | 0.075 ± 0.00 e | 0.34 ± 0.03 bc | 0.29 ± 0.03 bcd | 0.37 ± 0.03 b | 0.25 ± 0.02 b | 0.34 ± 0.03 bc | 0.32 ± 0.03 bcd | 0.30 ± 0.03 bdc | 0.36 ± 0.03 bc | 0.27 ± 0.02 cd | 0.47 ± 0.04 a |
| Ellagic acid | 0.73 ± 0.03 b | 0.82 ± 0.05 a | 0.71 ± 0.04 b | 0.36 ± 0.02 d | 0.16 ± 0.01 d | 0.49 ± 0.03 c | 0.90 ± 0.06 a | 0.36 ± 0.02 d | 0.53 ± 0.03 c | 0.23 ± 0.01 e | 0.55 ± 0.03 c |
| Hydroxycinnamic acids | |||||||||||
| Trans-Cinnamic acid | 25.04 ± 1.31 d | 54.99 ± 5.38 abc | 48.4 ± 4.73 bc | 41.30 ± 4.04 c | 49.05 ± 4.8 bc | 55.12 ± 5.4 abc | 48.58 ± 4.75 bc | 54.1 ± 5.28 abc | 59.22 ± 5.79 ab | 48.23 ± 4.71 bc | 63.96 ± 6.25 a |
| Coumaric acid | 0.25 ± 0.09 d | 0.47 ± 0.03 ab | 0.47 ± 0.03 ab | 0.46 ± 0.03 ab | 0.37 ± 0.02 c | 0.52 ± 0.03 a | 0.48 ± 0.03 ab | 0.46 ± 0.03 ab | 0.45 ± 0.03 abc | 0.44 ± 0.02 bc | 0.52 ± 0.03 a |
| Caffeic acid | Traces | 10.67 ± 0.53 ab | 9.79 ± 0.49 b | 10.93 ± 0.54 ab | 10.46 ± 0.52 ab | 10.3 ± 0.51 ab | 10.62 ± 0.53 ab | 9.85 ± 0.49 ab | 10.12 ± 0.50 ab | 10.58 ± 0.53 ab | 11.31 ± 0.56 a |
| Quinic acid | 519.35 ± 6.19 d | 393.81 ± 8.1 abc | 409.27 ± 8.4 a | 407.66 ± 8.35 a | 381.22 ± 7.81 bc | 396.1 ± 8.1 abc | 410.95 ± 8.42 a | 373.1 ± 7.64 c | 412.78 ± 8.46 a | 401.6 ± 8.23 ab | 408.07 ± 8.36 a |
| Ferulic acid | 0.27 ± 0.04 d | 0.41 ± 0.02 bc | 0.52 ± 0.03 a | 0.51 ± 0.03 a | 0.39 ± 0.02 bc | 0.51 ± 0.03 a | 0.49 ± 0.03 a | 0.35 ± 0.02 c | 0.53 ± 0.03 a | 0.46 ± 0.03 ab | 0.46 ± 0.03 ab |
| Synaptic acid | Traces | 0.30 ± 0.04 a | 0.16 ± 0.02 b | 0.18 ± 0.03 b | 0.32 ± 0.05 a | 0.15 ± 0.02 b | 0.31 ± 0.04 a | 0.29 ± 0.04 a | 0.18 ± 0.03 b | 0.37 ± 0.05 a | 0.18 ± 0.03 b |
| Caftaric acid | 0.31 ± 0.08 b | 14.81 ± 4.64 a | 7.56 ± 2.37 a | 13.65 ± 4.28 a | 11.31 ± 3.54 a | 14.39 ± 4.51 a | 15.59 ± 4.89 a | 14.44 ± 4.53 a | 14.69 ± 4.60 a | 14.67 ± 4.60 a | 11.86 ± 3.72 a |
| 4-O-cafeoylquinic acid | Traces | 9.78 ± 0.72 ab | 8.78 ± 0.65 b | 8.71 ± 0.64 b | 10.37 ± 0.76 ab | 9.28 ± 0.68 ab | 10.05 ± 0.74 ab | 9.14 ± 0.67 ab | 8.77 ± 0.65 b | 11.07 ± 0.82 a | 8.78 ± 0.65 b |
| Chlorogenic acid | 1.32 ± 0.4 f | 145.01 ± 4.56 a | 115.4 ± 3.63 e | 116.02 ± 3.65 de | 127.64 ± 4.0 bcd | 125.4 ± 3.9 cde | 138.39 ± 4.35 ab | 133.0 ± 4.2 bc | 118.16 ± 3.71 de | 139.0 ± 4.37 ab | 122.9 ± 3.86 cde |
| 3,4/4,5 dicaffeoylquinic acid | 36.13 ± 0.09 e | 193.52 ± 9.46 bc | 93.47 ± 4.57 d | 116.23 ± 5.68 d | 215.1 ± 10.52 ab | 102.0 ± 4.99 d | 203.28 ± 9.94 ab | 185.9 ± 9.09 c | 107.15 ± 5.24 d | 222.2 ± 10.87 a | 110.96 ± 5.43 d |
| Total | 597.15 f | 874.75 ab | 735.67 e | 756.90 e | 845.46 abc | 756.09 e | 899.69 a | 826.60 bcd | 771.32 de | 887.66 ab | 785.76 cde |
Infusion: 1 g of ground material to 100 mL of 80 °C distilled water and allowed to stand for 10 min. Extraction conditions: Ratio of water/methanol (%) - Extraction time (min) - Amplitude (%). Values in rows that show different letters are statistically different according to Fisher with P = 0.05. *Dry basis. Traces <0.001 µg∙g-1.
The amounts of caffeine in Coffea leaves samples are shown in Figure 2. Except for extract 9 (ratio of water/methanol [60/40 %] - extraction time [6 min] - amplitude [40 %]), the infusion exceeded the content of these compounds over the rest of extracts. A cup of coffee contains about 137 mg caffeine (Setiawan et al., 2015), and based on our results, one cup of Coffea leaves infusion has about 1.4 mg. A decrease in the concentration of caffeine has been reported in extracts obtained by ultrasound assistance, possibly due to its degradation by the sonication effect (Guglielmetti, D´Ignoti, Ghirardello, Belviso, & Zeppa, 2017). Theophylline and theobromine were low in all samples.
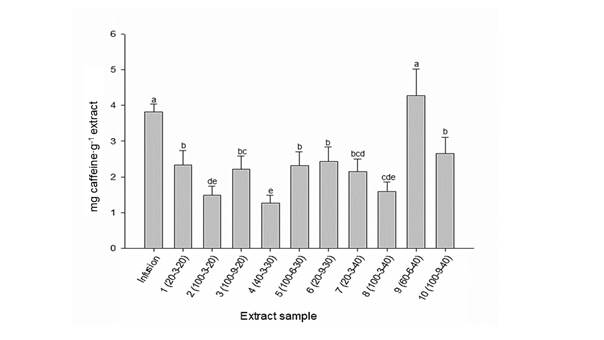
Figure 2 Total caffeine content in infusion and extracts of Coffea leaves. Infusion: 1 g of ground material into 100 mL of distilled water at 80 °C and allowed to stand for 10 min. Extraction conditions: Ratio of water/methanol (%) - Extraction time (min) - Amplitude (%). Different letters mean significant differences (Fisher P = 0.05).
Different phenolic compounds and alkaloids such as caffeine have already been previously reported in Coffea leaves (Ratanamarno & Subkar, 2017), and many of these phytochemicals may be related to therapeutic properties. Particularly, chlorogenic acid and mangiferin exhibit important pharmacological effects such as anti-diabetic, anti-lipidemic (Ong, Hsu, & Tan, 2013), anti-inflammatory (Hwang, Kim, Park, Lee, & Kim, 2014), anti-carcinogenic (Ebkatan, Li, Ghorbani, Azadi, & Kubow, 2018; Yamagata, Izawa, Onodera, & Tagami, 2018) and increased antioxidant capacity (Shi et al., 2016).
In this work, identification of two flavanones have been reported for the first time in Coffea leaves: neohesperidin and naringenin. Their detection was possible mainly in extracts using sonication and hydroalcoholic solvents (extracts 1, 4, 6, 7 and 9). These compounds were also extracted with water, but at the largest amplitude and extraction times; thus, only at higher energy administered to the extract or in combination with methanol, was possible to get these flavanones. The aglycone naringenin and the glycoside form of hesperetin, neohesperidin are important flavanones. They have shown several functional properties, such as antioxidant, antiproliferative, antiviral, antiallergic, anti-inflammatory, anti-atherosclerotic and anticancer activities (Kim et al., 2011). Naringenin has been highly studied for its antidiabetic activity. Some mechanisms for this flavanone are its modulatory effects on insulin secretion and sensitivity, hepatic production, transporters, peripheral uptake, and intestinal glucose absorption, blood lipids and cholesterol biosynthesis, oxidative stress and inflammation (Joshi, Kulkarni, & Wairkar, 2018). Naringenin is a primary flavanone abundant in many citrus fruits such as oranges (1.47 to 11.15 mg∙100 g-1) and grapefruits (14.17 to 53 mg∙100 g-1) (Nogata et al., 2006); in this study, the highest concentration was 1.75 mg∙100 g-1 for extract 9.
Regarding phenolic acids, it was detected and identified a group of hydroxybenzoic acids not previously reported in coffee leaves, such as vanillic, shikimic, syringic, and ellagic acids, along with 2,4,6 trihydroxybenzaldehyde and 2,3 dihydroxybenzoic acid. Among them, vanillic acid was found in higher concentration and it is related to multiple pharmacological activities such as the inhibition of snake venom activity, plus antioxidant, antimicrobial, and anti-inflammatory properties (Dhananjaya, Nataraju, Raghavendra Gowda, Sharat, & D’Souza, 2009; Tai, Sawano, & Ito, 2012).
Antioxidant Activity
Results from the antioxidant assays are shown in Table 4. The ABTS and FRAP assays essentially quantify the ability of the extract to neutralize a radical by single electron transfer (SET). However, the ABTS assay could also act under the mechanism of a hydrogen atom transfer (HAT). The ORAC and NO trials evaluate the HAT mechanism. The ABTS radical scavenging activity showed a positive and statistically significant correlation with the total phenolic (Pearson 0.754, P = 0.007) and the flavonoid contents (Pearson 0.854, P = 0.001).
Extract 6 (ratio of water/methanol [20/80 %] - extraction time [9 min] - amplitude [30 %]) showed the highest ABTS and FRAP values, while extract 9 (ratio of water/methanol [60/40 %] - extraction time [6 min] - amplitude [40 %]), the highest activity in ORAC and NO assays. Extract 9 showed a higher concentration of flavanones, flavonols and caffeine compared to extract 6. It has been reported that low concentrations of caffeine can favor an antioxidant effect by exerting strong trapping capacity of radical •OH (Petrucci, Zollo, Curulli, & Marrosu, 2018). However, recent research suggests that caffeine has no influence on the antioxidant capacity by assays based on the HAT mechanism (Petrucci et al., 2018). Extract 6 also showed a higher concentration of epicatechin and mangiferin than extract 9.
It is known that both oxidative and nitrosative stresses, due to various circumstances both intrinsic and extrinsic, induce biological mechanisms to lose control over free radicals with the consequent imbalance between oxidant conditions and cellular antioxidant defenses. It is therefore of interest to evaluate not only the antioxidant potential of a plant material, but also its anti-nitrosative capacity. The nitric oxide inhibitory potential of the evaluated extracts ranged 36-58 % and extract 9 was the most efficient scavenger against it.
Table 4 Assays for the evaluation of in vitro antioxidant capacity in infusion and extracts of Coffea leaves.
| Extract sample | Extraction conditions | ABTS mM TE∙mg-1 extract | FRAP mM TE∙mg-1 extract | ORAC mM∙TE mg-1 extract | NO (% inhibition) |
|---|---|---|---|---|---|
| Infusion* | - | 180.71 ± 7.14 d | 198.33 ± 23.09 bcd | 166.17 ± 9.82 f | 36.25 ± 2.46 g |
| 1 | 20/03/2020 | 178.81 ± 0.15 d | 238.33 ± 21.53 a | 112.56 ± 0.52 i | 50.74 ± 2.03 b |
| 2 | 100-3-20 | 120.95 ± 0.10 h | 223.33 ± 20.17 ab | 159.82 ± 0.74 g | 42.67 ± 1.71 de |
| 3 | 100-9-20 | 289.76 ± 0.26 b | 126.66 ± 11.44 f | 120.77 ± 0.56 h | 45.32 ± 1.82 cd |
| 4 | 40-3-30 | 86.42 ± 0.077 i | 188.33 ± 17.01 cd | 103.59 ± 0.48 j | 40.64 ± 1.63 ef |
| 5 | 100-6-30 | 144.52 ± 0.13 g | 196.66 ± 17.76 bcd | 156.32 ± 0.73 g | 38.62 ± 1.55 fg |
| 6 | 20/09/1930 | 343.09 ± 0.31 a | 218.33 ± 19.72 abc | 182.92 ± 0.85 e | 47.06 ± 1.88 c |
| 7 | 20/03/1940 | 230.71 ± 0.21 c | 245.00 ± 22.13 a | 197.85 ± 0.92 d | 47.71 ± 1.91 bc |
| 8 | 100-3-40 | 154.04 ± 0.14 f | 150.00 ± 13.55 ef | 232.84 ± 1.08 b | 46.85 ± 1.88 c |
| 9 | 60-6-40 | 165.47 ± 0.15 e | 175.00 ± 15.81 de | 259.05 ± 1.21 a | 58.71 ± 2.35 a |
| 10 | 100-9-40 | 152.14 ± 0.13 f | 193.33 ± 17.46 bcd | 214.82 ± 1.00 c | 50.65 ± 2.03 b |
*Infusion: 1 g of ground material to 100 mL of 80 °C distilled water and allowed to stand for 10 min. Extraction conditions: Ratio of water/methanol (%) - Extraction time (min) - Amplitude (%). Values in same column with different letters are significantly different (Fisher P = 0.05). Assays: absorbance capacity of oxygen radicals (ORAC), ferric reducing antioxidant power (FRAP), radical ABTS (2,2'-azino-bis [3-ethylbenzothiazoline-6-sulfonic acid]), nitric oxide (NO). TE: Trolox equivalent.
Cell viability
Different concentrations of extracts and infusions were evaluated in HT-29 cultures and their IC50’s obtained. Table 5 shows that IC50 values of all samples were below 13 µg∙mL-1. Based on these results, it was proposed a fixed concentration of extracts and infusions of 50 ng∙mL-1 (where the cell viability was 100 %) to assess their protective effect. Phytochemicals present in extracts and infusions at this low concentration were able to inhibit the stress generated in cells by exposure to H2O2. Compared to 100 % stress in the positive control with H2O2, all treatments were able to reduce the stress by 5.9(16 %, particularly extract 9 (Figure 3). The extraction conditions of process 9 favored an extract rich in mangiferin, which shows cellular protection by attenuating the expression of oxidative stress (Rocha, Bonet, Tambeli, de-Faria, & Parada, 2018).
Table 5 Cell viability results expressed as IC50 (mean inhibitory concentration) of infusions and Coffea leaves extracts evaluated in human colon adenocarcinoma cells (HT-29).
| Extract sample | Extraction conditions | IC50 (µg∙mL-1) |
|---|---|---|
| Infusion* | - | 9.16 ± 0.9 b |
| 1 | 20/03/2020 | 6.50 ± 0.8 c |
| 2 | 100-3-20 | 8.97 ± 1.1 b |
| 3 | 100-9-20 | 5.05 ± 0.6 c |
| 4 | 40-3-30 | 2.86 ± 0.4 d |
| 5 | 100-6-30 | 12.09 ± 1.5 a |
| 6 | 20/09/1930 | 12.50 ± 1.6 a |
| 7 | 20/03/1940 | 6.19 ± 0.8 c |
| 8 | 100-3-40 | 5.22 ± 0.7 c |
| 9 | 60-6-40 | 5.70 ± 0.7 c |
| 10 | 100-9-40 | 9.82 ± 1.2 b |
*Infusion: 1 g of ground material to 100 mL of 80 °C distilled water and allowed to stand for 10 min. Extraction conditions: Ratio of water/methanol (%) - Extraction time (min) - Amplitude (%). Values with different letters are significantly different (Fisher P = 0.05).
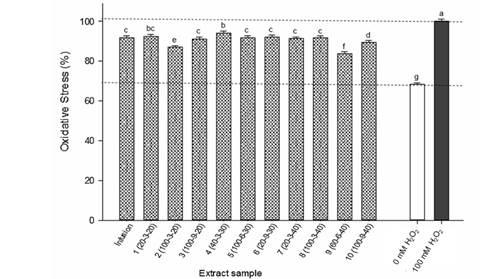
Figure 3 Ability of Coffea leaf extracts to inhibit oxidative stress in a human colon adenocarcinoma cell assay (HT-29). Positive control with H2O2. Different letters mean significant differences (Fisher P = 0.05). Infusion: 1 g of ground material into 100 mL distilled water at 80 °C and allowed to stand for 10 min. Extraction conditions: ratio of water/methanol (%) - extraction time (min) - amplitude (%).
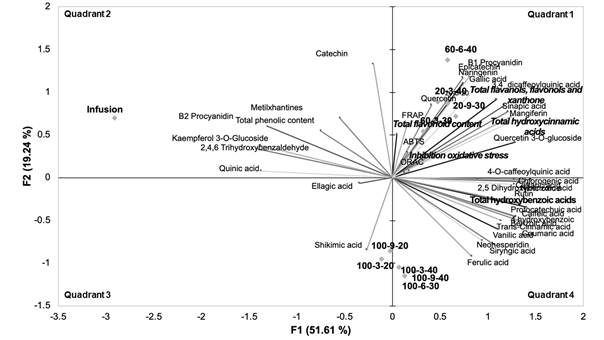
Figure 4 illustrates a PCA of the response variables, and the extraction processes (ultrasound and infusion). On quadrant 1, a group with most of the responses can be observed and all the ultrasound extraction processes in which a hydroalcoholic medium (water/methanol) was used. In this group all the antioxidant responses (ON, ORAC, ABTS and FRAP) are related to hydroalcoholic extracts, as well as to the evaluation of oxidative stress in cells. Phenolic compounds with important therapeutic activity are also observed. The correlation between the observed responses as well as phytochemicals of biological importance, make these extraction conditions a good alternative for obtaining phenolic compounds with potential capacity as nutraceutical ingredients.
In the lower quadrants the extraction processes with ultrasound assistance, exclusively the aqueous medium, were observed and related to the recovery of simple phenolic compounds, while infusion was found in quadrant 2. This extraction process has a high correlation specifically with the recovery of quinic acid. The 11 processes evaluated showed the recovery capability of phenolic compounds, and those obtained by sonication and combination with alcohol as solvent, had also important antioxidant activity.
Conclusions
Phenolic and methylxanthines contents in extracts from Coffea arabica leaves were evaluated. Their antioxidant activity in vitro through NO, ORAC, FRAP, and ABTS assays, and inhibition of oxidative stress by H2O2 in HT-29 cells was determined. Effect of ultrasound-assisted extraction conditions was observed and extracts at 60/40 water/methanol, 40 % amplitude and 6 min of extraction (extract 9) showed the highest concentrations of phenolics and caffeine, and the greater oxidative stress inhibition in the HT-29 model, ORAC and NO assays. It was also possible to identified new phenolic compounds, such as flavanones (naringenin and neohespiridin), and hydroxybenzoic acids (vanillic acid). The total content of identified compounds was always higher in ultrasound-assisted extracts while phenolic extraction yields improved with the addition of alcohol. The phytochemical composition of ultrasound-assisted extracts of Coffea leaves represents an opportunity for using this plant material as a novel source of nutraceuticals to treat various health conditions related to oxidative stress; however, further investigations are needed.

